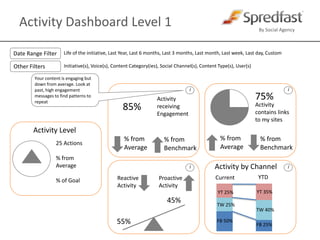
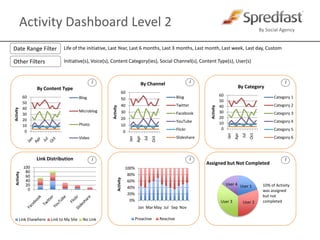
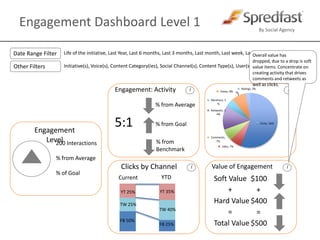
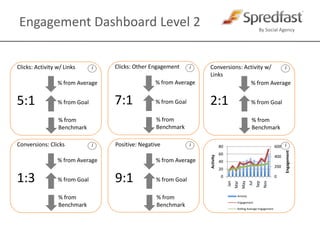
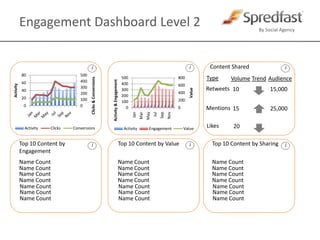
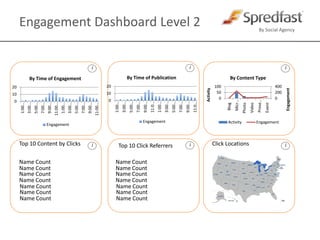
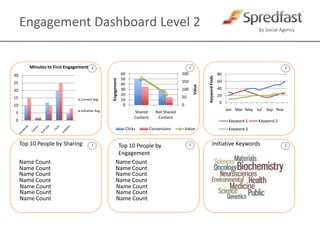
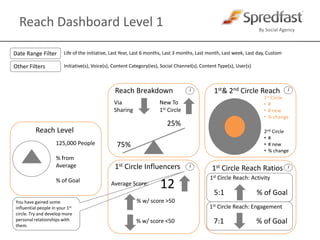
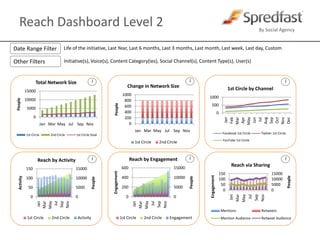
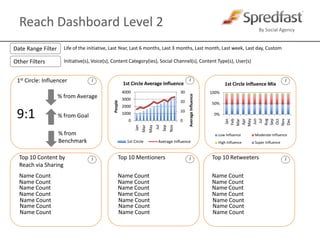
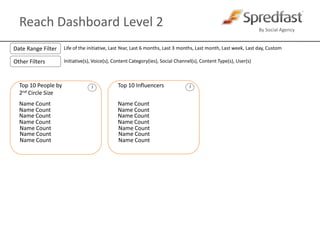
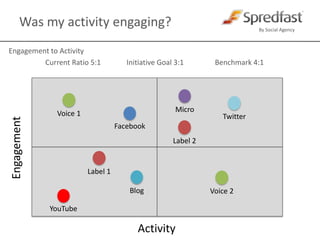
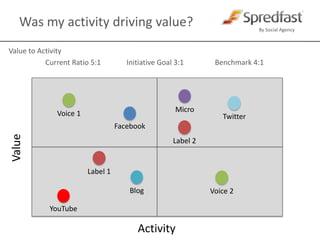
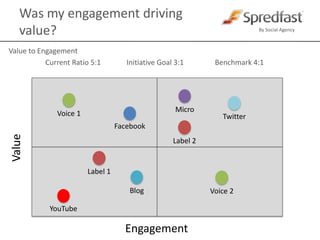
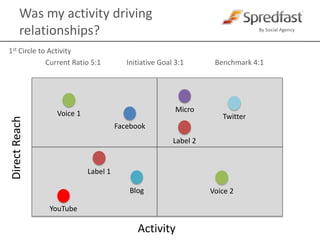
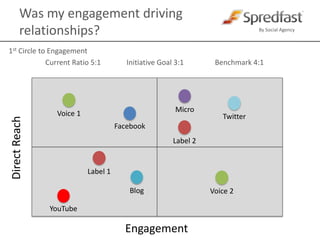
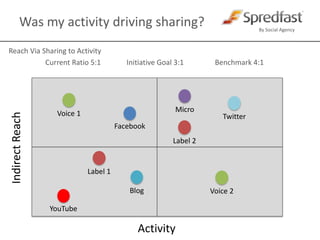
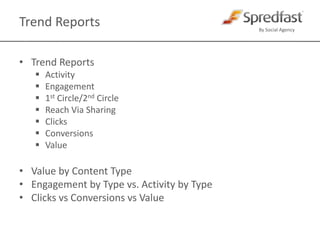
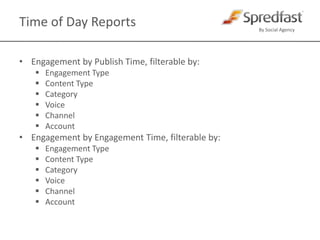
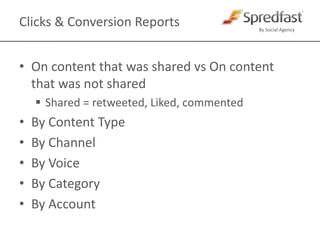
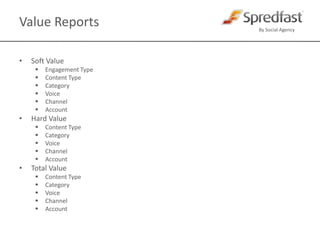
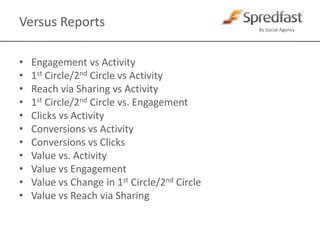
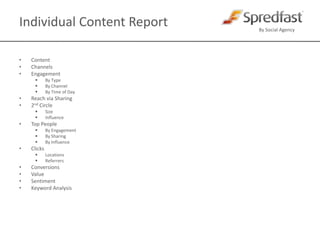
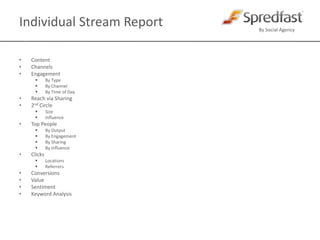
The document outlines proposed new analytics dashboards and reports from Spredfast Analytics. The dashboards and reports will provide deeper insights into activity, engagement, reach, and their relationships. They include metrics on key performance indicators over time, versus benchmarks, and breakdowns by content, user, and other attributes. The goal is to move beyond raw data to actionable answers.
2. What is Spredfast Analytics? Spredfast Analytics is a layer of meaningful data analysis on top of the raw metrics we currently provide. The goal is to move beyond providing great data to providing great answers. There will be significantly more utility in the overall metrics section, including dashboards, canned reports and raw data tables We will maintain our high level groups of Activity, Engagement and Reach
4. Activity Dashboard Level 1 Date Range Filter Life of the initiative, Last Year, Last 6 months, Last 3 months, Last month, Last week, Last day, Custom Other Filters Initiative(s), Voice(s), Content Category(ies), Social Channel(s), Content Type(s), User(s) Your content is engaging but down from average. Look at past, high engagement messages to find patterns to repeat 75% Activity receiving Engagement 85% Activity contains links to my sites Activity Level % from Average % from Benchmark % from Average % from Benchmark 25 Actions % from Average % of Goal YTD Current Activity by Channel i i i i Reactive Activity Proactive Activity YT 25% YT 35% TW 25% 45% TW 40% FB 50% 55% FB 25%
5. Activity Dashboard Level 2 Date Range Filter Life of the initiative, Last Year, Last 6 months, Last 3 months, Last month, Last week, Last day, Custom Other Filters Initiative(s), Voice(s), Content Category(ies), Social Channel(s), Content Type(s), User(s) i i i i i i 10% of Activity was assigned but not completed
6. Engagement Dashboard Level 1 Date Range Filter Life of the initiative, Last Year, Last 6 months, Last 3 months, Last month, Last week, Last day, Custom Other Filters Initiative(s), Voice(s), Content Category(ies), Social Channel(s), Content Type(s), User(s) Overall value has dropped, due to a drop is soft value items. Concentrate on creating activity that drives comments and retweets as well as clicks. Engagement: Activity % from Average 5:1 % from Goal Engagement Level % from Benchmark 200 Interactions % from Average % of Goal YTD Current Clicks by Channel Value of Engagement i i i i Soft Value $100 YT 25% + + YT 35% TW 25% Hard Value $400 TW 40% = = FB 50% Total Value $500 FB 25%
7. Engagement Dashboard Level 2 Clicks: Other Engagement Clicks: Activity w/ Links Conversions: Activity w/ Links % from Average % from Average % from Average 7:1 5:1 2:1 % from Goal % from Goal % from Goal % from Benchmark % from Benchmark % from Benchmark Conversions: Clicks Positive: Negative % from Average % from Average i i i i i i 1:3 9:1 % from Goal % from Goal % from Benchmark % from Benchmark
8. Engagement Dashboard Level 2 Content Shared Type Volume Audience Trend Retweets 10 15,000 Mentions 15 25,000 Likes 20 Top 10 Content by Engagement Top 10 Content by Value Top 10 Content by Sharing Name Count Name Count Name Count i i i i i i Name Count Name Count Name Count Name Count Name Count Name Count Name Count Name Count Name Count Name Count Name Count Name Count Name Count Name Count Name Count Name Count Name Count Name Count
9. Engagement Dashboard Level 2 Top 10 Content by Clicks Click Locations Top 10 Click Referrers Name Count Name Count i i i i i i Name Count Name Count Name Count Name Count Name Count Name Count Name Count Name Count Name Count Name Count Name Count Name Count
10. Engagement Dashboard Level 2 Top 10 People by Sharing Initiative Keywords Top 10 People by Engagement Name Count Name Count i i i i i i Name Count Name Count Name Count Name Count Name Count Name Count Name Count Name Count Name Count Name Count Name Count Name Count
15. % change125,000 People % from Average % of Goal 75% 1st Circle Influencers 1st Circle Reach Ratios i i i i 1st Circle Reach: Activity 12 Average Score: 5:1 % of Goal % w/ score >50 1st Circle Reach: Engagement 7:1 % of Goal % w/ score <50
16. Reach Dashboard Level 2 Date Range Filter Life of the initiative, Last Year, Last 6 months, Last 3 months, Last month, Last week, Last day, Custom Other Filters Initiative(s), Voice(s), Content Category(ies), Social Channel(s), Content Type(s), User(s) i i i i i i
17. Reach Dashboard Level 2 Date Range Filter Life of the initiative, Last Year, Last 6 months, Last 3 months, Last month, Last week, Last day, Custom Other Filters Initiative(s), Voice(s), Content Category(ies), Social Channel(s), Content Type(s), User(s) 1st Circle: Influencer % from Average 9:1 % from Goal % from Benchmark Top 10 Content by Reach via Sharing Top 10 Mentioners Top 10 Retweeters i i i i i i Name Count Name Count Name Count Name Count Name Count Name Count Name Count Name Count Name Count Name Count Name Count Name Count Name Count Name Count Name Count Name Count Name Count Name Count Name Count Name Count Name Count
18. Reach Dashboard Level 2 Date Range Filter Life of the initiative, Last Year, Last 6 months, Last 3 months, Last month, Last week, Last day, Custom Other Filters Initiative(s), Voice(s), Content Category(ies), Social Channel(s), Content Type(s), User(s) Top 10 People by 2nd Circle Size Top 10 Influencers Name Count Name Count Name Count Name Count Name Count Name Count Name Count Name Count Name Count Name Count Name Count Name Count Name Count Name Count i i
20. Was my activity engaging? Engagement to Activity Current Ratio 5:1 Initiative Goal 3:1 Benchmark 4:1 Voice 1 Twitter Facebook YouTube Engagement Voice 2 Label 2 Label 1 Blog Micro Activity
21. Was my activity driving traffic? Clicks to Activity Current Ratio 5:1 Initiative Goal 3:1 Benchmark 4:1 Voice 1 Twitter Facebook YouTube Clicks Voice 2 Label 2 Label 1 Blog Micro Activity
22. Was my activity driving value? Value to Activity Current Ratio 5:1 Initiative Goal 3:1 Benchmark 4:1 Voice 1 Twitter Facebook YouTube Value Voice 2 Label 2 Label 1 Blog Micro Activity
23. Was my engagement driving traffic? Clicks to Engagement Current Ratio 5:1 Initiative Goal 3:1 Benchmark 4:1 Voice 1 Twitter Facebook YouTube Clicks Voice 2 Label 2 Label 1 Blog Micro Engagement
24. Was my engagement driving value? Value to Engagement Current Ratio 5:1 Initiative Goal 3:1 Benchmark 4:1 Voice 1 Twitter Facebook YouTube Value Voice 2 Label 2 Label 1 Blog Micro Engagement
25. Was my activity driving relationships? 1st Circle to Activity Current Ratio 5:1 Initiative Goal 3:1 Benchmark 4:1 Voice 1 Twitter Facebook YouTube Direct Reach Voice 2 Label 2 Label 1 Blog Micro Activity
26. Was my engagement driving relationships? 1st Circle to Engagement Current Ratio 5:1 Initiative Goal 3:1 Benchmark 4:1 Voice 1 Twitter Facebook YouTube Direct Reach Voice 2 Label 2 Label 1 Blog Micro Engagement
27. Was my activity driving sharing? Reach Via Sharing to Activity Current Ratio 5:1 Initiative Goal 3:1 Benchmark 4:1 Voice 1 Twitter Facebook YouTube Indirect Reach Voice 2 Label 2 Label 1 Blog Micro Activity
29. Trend Reports Trend Reports Activity Engagement 1st Circle/2nd Circle Reach Via Sharing Clicks Conversions Value Value by Content Type Engagement by Type vs. Activity by Type Clicks vs Conversions vs Value
30. Time of Day Reports Engagement by Publish Time, filterable by: Engagement Type Content Type Category Voice Channel Account Engagement by Engagement Time, filterable by: Engagement Type Content Type Category Voice Channel Account
31. Clicks & Conversion Reports On content that was shared vs On content that was not shared Shared = retweeted, Liked, commented By Content Type By Channel By Voice By Category By Account
32. Value Reports Soft Value Engagement Type Content Type Category Voice Channel Account Hard Value Content Type Category Voice Channel Account Total Value Content Type Category Voice Channel Account
33. Versus Reports Engagement vs Activity 1st Circle/2nd Circle vs Activity Reach via Sharing vs Activity 1st Circle/2nd Circle vs. Engagement Clicks vs Activity Conversions vs Activity Conversions vs Clicks Value vs. Activity Value vs Engagement Value vs Change in 1st Circle/2nd Circle Value vs Reach via Sharing
35. Individual Content Report Content Channels Engagement By Type By Channel By Time of Day Reach via Sharing 2nd Circle Size Influence Top People By Engagement By Sharing By Influence Clicks Locations Referrers Conversions Value Sentiment Keyword Analysis
37. Individual Stream Report Content Channels Engagement By Type By Channel By Time of Day Reach via Sharing 2nd Circle Size Influence Top People By Output By Engagement By Sharing By Influence Clicks Locations Referrers Conversions Value Sentiment Keyword Analysis