Download to read offline


![40 AUSTRALIAN COMMUNITY SECTOR SURVEY VOLUME I NATIONAL
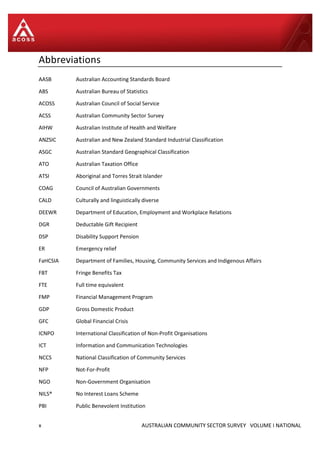
between the relative proportions of volunteers to paid staff and the organisational size,
locality and area of service delivery.
As indicated in Figure 3.21, the proportion of volunteers to paid staff was significantly higher
in smaller organisations and in organisations in regional and remote areas, with volunteers
comprising over two-thirds of the workforce in these organisations. The proportion of
volunteers also showed substantial variation across different areas of service delivery, with
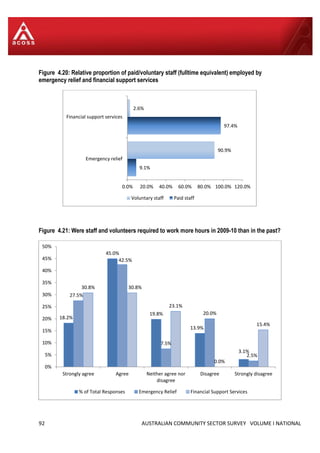
the heaviest reliance on volunteers among those agencies providing emergency relief,
mental health services, or support for migrants, refugees and asylum seekers.
While the survey data confirm the significant contribution volunteers make to the delivery
of social services, organisations that were dependent on voluntary staff faced a range of
challenges. When asked to identify the three most important issues they faced in 2009-10,
the most prevalent issue associated with volunteers related to a lack of resources and
capacity to manage, coordinate or train volunteers. As one organisation stated:
Lack of funding to cover a full-time volunteer coordinator [is a major issue for our
organisation]. We have had to expand our services significantly to meet demand and due to
some additional program funding. But we rely heavily on volunteers and have had no
additional funding to cover the costs of coordinating volunteers. Existing staff are already
over-stretched and don’t have capacity to undertake this coordinating role which is vital but
labour-intensive. This raises duty of care risks to the organisation, clients, staff and volunteers
(survey respondent).
Additional issues included difficulties recruiting and retaining volunteers; volunteer burn-
out; the increasing costs of engaging volunteers; the lack of volunteers with the requisite
skills and training needed in particular areas of services delivery; and, for some
organisations solely dependent on volunteers, an inability to plan ahead given the
uncertainty and lack of continuity in their workforce. The response from an organisation
providing emergency relief and homelessness support encapsulates a range of these issues:
Volunteer burnout/fatigue [is a major issue for organisation]. Most of our services are
unfunded, and the growth in demand has not been matched by a growth in the number of
volunteers. Retaining volunteers is an ongoing problem, due in part to the massive workload
and insufficient resources to provide coordination and support for new volunteers. This
situation threatens our sustainability as an organisation, placing serious strain on existing
volunteers, many of whom are working long hours, without support, and increasingly unable
to deal with the many and complex needs of people seeking assistance (survey respondent).
While few organisations paid their board members, those organisations that did were large
or very large organisations. When identifying prominent issues they had faced over 2009-10,
a few organisations noted that the voluntary nature of board membership made it difficult
to attract or retain board members with the appropriate skills or experiences. Continual
turnover in boards or management committees were seen to contribute to organisational
instability and to detract from service delivery and planning.](https://image.slidesharecdn.com/acss2011reportvolume1national-140716080024-phpapp02/85/Acss-2011-report_volume_1_national-54-320.jpg)
![National survey findings 49
3.3.5 Equal pay and changes to workplace awards
When survey respondents were asked to identify the three most important issues or
challenges facing their organisation, the most ubiquitous response concerned the
inadequacy of funding for services.
A further theme that organisations persistently identified related to the difficulties they
faced in recruiting and retaining staff. An analysis of the open-ended responses relating to
staffing and workforce further reveals that the lack of pay parity with other sectors,
industrial change with the introduction or the Modern Award and the implications of the
2009 Queensland equal pay decision for community sector workers were persistent issues
for organisations in 2009-10.
Award Modernisation
During 2009-2010, the Federal Government implemented changes to workplace bargaining
and awards systems as part of its industrial relations agenda. With the commencement of
the Fair Work Act on 1 July 2009, a process of reviewing and rationalising awards in the
national workplace relations system took place, replacing the range of awards offered in
different states and territories with a single system of 'modern awards'. Changes to
workplace awards in turn came into effect on 1 January 2010.
While organisations were not necessarily opposed to the aims and intentions of award
modernisation, the survey responses suggest that many organisations experienced
significant uncertainty and difficulties adapting to changes to wages and conditions. A lack
of resources and time to adjust to changes, limited support in implementing changes, and a
lack of internal expertise were cited as persistent concerns. As one respondent remarked:
The introduction of the modern award system [was one of the most important issues our
organisation faced in 2009-10]. This created uncertainty and also strain due to [the] resources
and time needed to understand and operationalise new awards, and the lack of relevant
expertise within our small organisation. This is in a context where we are already struggling to
cope with administering contracts, tendering for funds, managing volunteers and staff,
escalating costs (survey respondent).
Whilst some organisations expressed concerns about an inability to fund any wage increases
without a commensurate increase in the funding they received via government contracts,
others noted that the new Awards had resulted in a decrease in wages and conditions:
Transition to the new Awards system [is an important issue for our organisation]. Staff are
paid at Award rates and conditions, but the Federal Award is less generous in pay and leave. It
is not clear whether we are required to pay at Federal or State Award rate, reduce leave
entitlements, or how the transition process is to work (survey respondent).](https://image.slidesharecdn.com/acss2011reportvolume1national-140716080024-phpapp02/85/Acss-2011-report_volume_1_national-63-320.jpg)
![50 AUSTRALIAN COMMUNITY SECTOR SURVEY VOLUME I NATIONAL
Equal pay
Workforce challenges arising from inadequate pay for community workers have long been
articulated by the sector. These include declining capacity by services to attract and retain
workers. In 2009 the QIRC made a new award to address what it recognised as pay inequity
for community sector workers in Queensland. The QIRC acknowledged that ‘the pay
inequity that is present in [the community services sector] as a result of undervaluation of
work is exacerbated by the absence of enterprise bargaining in this sector. This means that
the wages paid to employees in this sector are substantially less than their counterparts
employed in the public sector’ (QIRC 2007:6).
Taking the Queensland decision as a precedent, unions representing social and community
sector and disability workers lodged an Equal Remuneration Order for community workers
before Fair Work Australia in the first half of 2010. The application was based on the
gendered nature of the work conducted within the community sector and its consequent
undervaluing in terms of wages. The application sought to increase the pay of workers
covered by the Social, Community, Home Care and Disability Services Industry Award
(formerly SACS award).
The case was ongoing at the time of publication of this report and therefore its outcome
was unknown when respondents completed this survey. However, there had been a
sustained campaign for funding of higher wages that might flow from a successful equal
remuneration application, and many respondents were cognisant of the case and its
potential outcomes in the commentary they provided through open-ended survey
responses.
3.4 Funding and regulatory arrangements
The adequacy and effectiveness of funding and regulatory frameworks are issues of
enduring concern within the community sector. Over the past two decades, such issues
have taken on a renewed urgency in the context of the sector’s expansion, the rise of
competitive contracting arrangements, and the growing demand for human services. While
such changes have opened up opportunities for many organisations, access to sufficient and
reliable income remains a key challenge impacting on organisational ability to recruit and
retain staff, to effectively deliver services, and to balance service delivery demands and
administrative requirements with the need for systemic advocacy.
This section examines key measures of funding, and presents data relating to organisational
income, expenditure and operating surpluses. It also considers the impact that government
legislation and regulations have had on service delivery, including the ability of
organisations to innovate, advocate and plan.
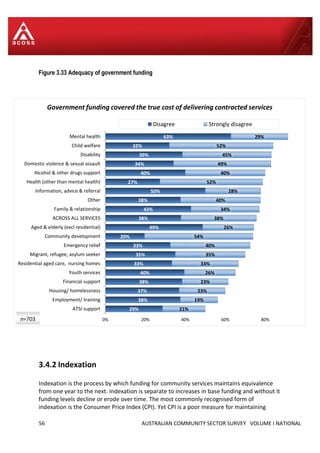
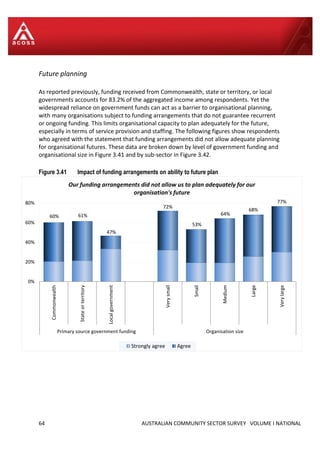
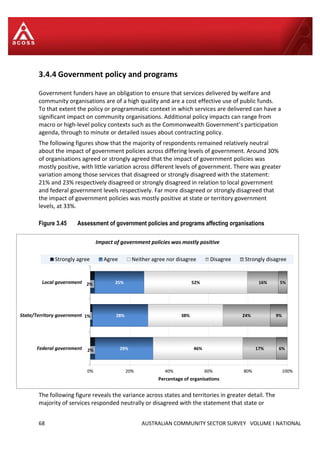
The majority of surveyed organisations stated that the level of funding they received in
2009-10 was insufficient to cover the true costs of delivering contracted services. Although
the survey findings reveal that the overall income of larger organisations usually covered](https://image.slidesharecdn.com/acss2011reportvolume1national-140716080024-phpapp02/85/Acss-2011-report_volume_1_national-64-320.jpg)
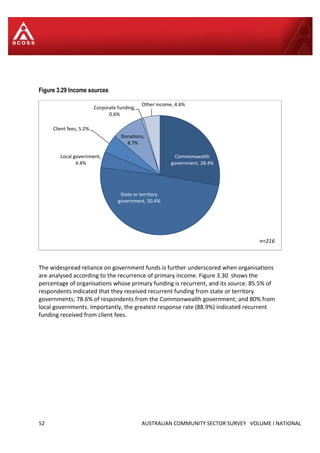
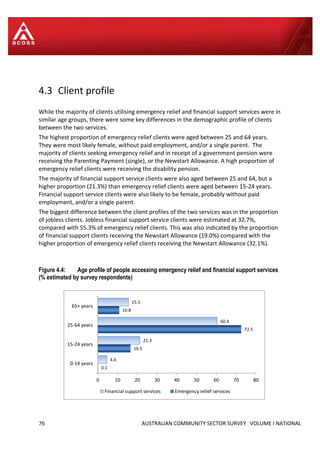
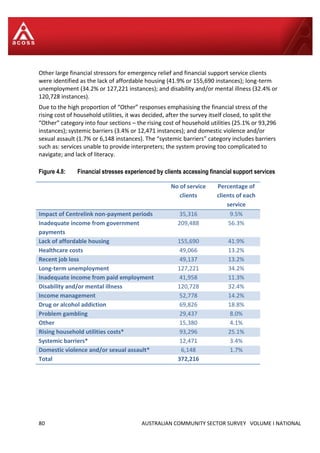
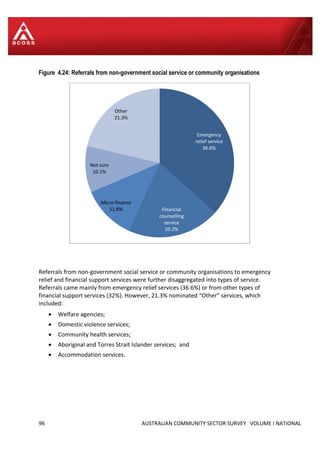
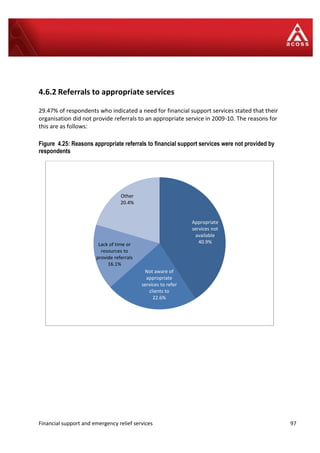


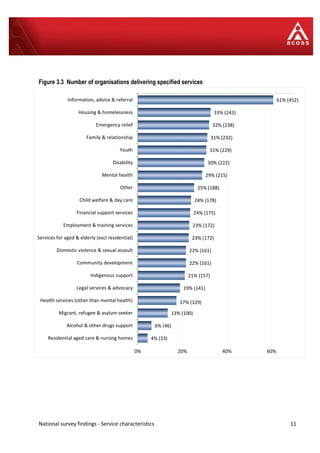
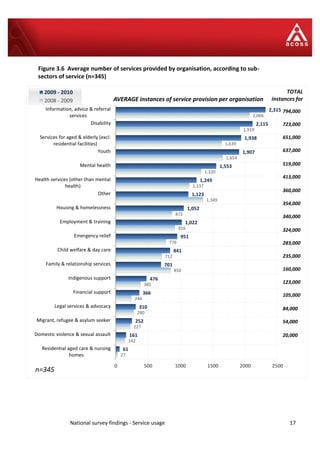
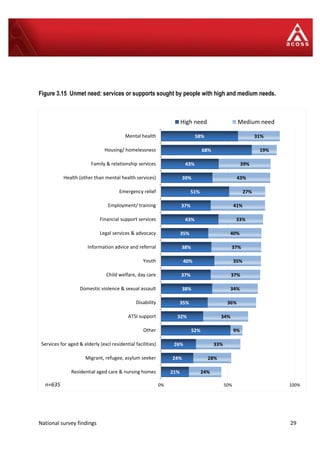
This document summarizes the key findings of the 2011 Australian Community Sector Survey. The survey collected data from 745 community service agencies about service provision, funding, and operations between July 2009 and June 2010. Key findings include: services increased 12% to over 6 million instances but demand still outpaced supply; clients were denied services on 345,000 occasions, a 19% increase; unmet needs were greatest for mental health, disability, housing and homelessness, and financial support services.


