Download to read offline
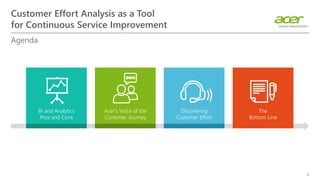
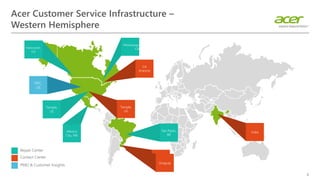
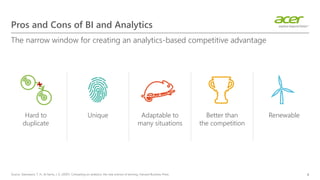
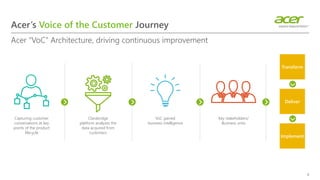
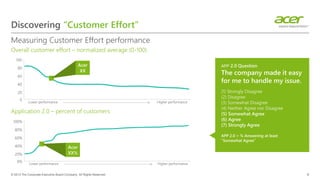
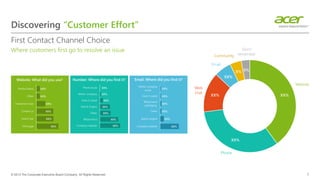
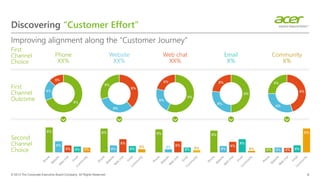

This document discusses using customer effort analysis as a tool for continuous service improvement. It outlines Acer's customer service infrastructure and journey to capture customer feedback. The presentation then discusses measuring and analyzing customer effort data to identify areas for improvement across different contact channels, prioritizing channels that have high volume and effort. The goal is to use insights from customer effort data to enhance the customer experience.


