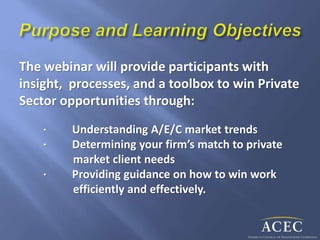
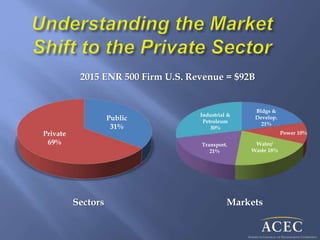
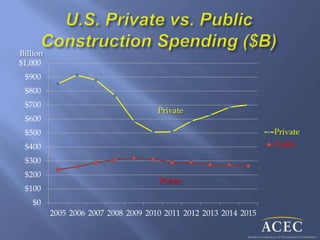
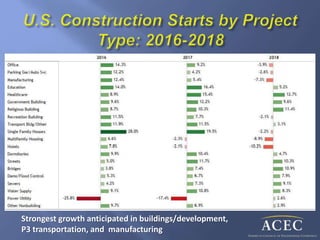
THIS EDUCATIONAL ACTIVITY IS
PROTECTED BY U.S. AND
INTERNATIONAL COPYRIGHT LAWS.
REPRODUCTION, DISTRIBUTION,
DISPLAY AND USE OF THE
EDUCATIONAL ACTIVITY WITHOUT
WRITTEN PERMISSION OF THE
PRESENTERS IS PROHIBITED.
The webinar will provide participants with
insight, processes, and a toolbox to win Private
Sector opportunities through:
· Understanding A/E/C market trends
· Determining your firm’s match to private
market client needs
· Providing guidance on how to win work
efficiently and effectively.
U.S. Private Sector Construction Spending
Exceeds $700 Billion Annually
Private Sector A/E Spending
nearly 2.5 x Public sector
Top 500 Design Firms’ Private Sector
Revenue Reaches $73 Billion
https://www.youtube.com/watch?v=UK2Gia8HtE8
1. Understand the Market Trends
2. Determine your firm’s capability to pursue and
win work
3. Apply a portfolio approach to prioritizing and
managing opportunities
4. Implement “campaign to contract” capture
planning
5. Be logical and efficient
1. Understand the Market Trends
2. Determine your firm’s capability to pursue and
win work
3. Apply a portfolio approach to prioritizing and
managing opportunities
4. Implement “campaign to contract” capture
planning
5. Be logical and efficient
Public
31%
Private
69%
Bldgs &
Develop.
21%
Power 10%
Water/
Waste 18%
Transport.
21%
Industrial &
Petroleum
30%
2015 ENR 500 Firm U.S. Revenue = $92B
Sectors Markets
2013 2014 2015
62.1
66
71.2
28.1 26.7
21.2
ENR 500 Total Revenue Comparison
ACEC Member Firms Non-Member Firms
$ Billion
2013 2014 2015
35.5
38.2
45.1
24
26.7
21.2
ENR 500 Top Design Firm Comparison
ACEC Member Firms Non-Member Firms
$ Billion
0.00%
10.00%
20.00%
30.00%
40.00%
50.00%
60.00%
Growth
Buildings/Land Dev.
Manufacturing
Power
Industrial/Petroleum
23%
Bldg/
Land Dev.
53%
Ind./
Petrol.
40%
Power
31%
Mfg.
$0
$100
$200
$300
$400
$500
$600
$700
$800
$900
$1,000
2005 2006 2007 2008 2009 2010 2011 2012 2013 2014 2015
Private
Public
Billion
Private
Public
A/E Work Precedes Construction by 12-24+ months
$ Billion
Project Type
0
50
100
150
200
250
2015
2016
2017
2018
2019
Strongest growth anticipated in buildings/development,
P3 transportation, and manufacturing
1. Understand the Market Trends
2. Determine your firm’s capability to pursue and
win work
3. Apply a portfolio approach to prioritizing and
managing opportunities
4. Implement “campaign to contract” capture
planning
5. Be logical and efficient
 Business Development Capability – Assess:
 Firm’s BD culture
 Strategic plans and goals
 Capability to serve target markets
 Client development and relationship building
 Marketing management and BD support
 Opportunity assessment and management
 Campaigns to contracts – capture planning
 Skill, resources, and processes gaps
 Implement - Plan to fill gaps and maximize marketing
and sales efficiency and effectiveness
 Process is not driven by government regulations
 Rules may be less rigid (or harder to identify)
 Information may not be public
 Lead time may be shorter
 May be easier (or harder) to get in
 When they trust you access may be easier
 Cost may be more important (or the only criteria)
But one fact is the same: “When all things are equal, clients hire friends
And when they are not equal, they still hire friends”.
.
1. Understand the Market Trends
2. Determine your firm’s capability to pursue and
win work
3. Apply a portfolio approach to prioritizing and
managing opportunities
4. Implement “campaign to contract” capture
planning
5. Be logical and efficient
Templates and guidance are provided for:
 Market assessment
 Client identification and profiling
 Lead and Opportunity identification
 Opportunity portfolio assessment and
tracking
 Pursuit plan and resource requirement
 Decision-maker motivators and
relationship building
 Activity responsibilities and milestones
 Revenue and backlog forecasting
 Take a “big picture view” of your world
 Understand and appreciate the culture and its people
 Identify universe of potential clients
 Profile potential clients
 Understand what business they are in and what
services they may need
 Know the competition and your differentiators
 Implement client development plans
Take a “Big Picture View" of Your World
 Metro population - 3,395,300
 Major industries - Financial services, technology,
biomedical, retail
 Gross metro product - $204.7 B
 Median household income - $67,976
 Median home price - $193,600
 Unemployment - 4.4%
 Job growth (2013) - 2%
 Cost of living - 1.6% below national average
 College attainment - 39.5%
 Net migration (2013) - 2,210
 The “Miracle of Minneapolis”, Atlantic Magazine
 Ranked as one the 10 best cities in the USA
 Ranked as the 6th most attractive city
 Ranked 3rd among top 50 bike-friendly cities
 Ranked 3rd as most livable city in the USA
 Ranked 2nd in American Fitness Index
 Scored among ‘most innovative cities in America’
 Ranked 3rd best city for recent college graduates
 Ranked 11th for best places to start a business
Source: City of Minneapolis /
www.minneapolis.org
 Andrews Sisters
 James Arness
 Warren Burger
 Bob Dylan
 F. Scott Fitzgerald
 Judy Garland
 J. Paul Getty
 Josh Hartnett
 Garrison Keillor
 Jessica Lang
 John Madden
 Joe Mauer
 Mayo Brothers
 Prince
 Charles Schultz
 Vince Vaughn
 Lindsey Vonn
 Jesse Ventura
 Google Maps
 Wikipedia
 City of Minneapolis’s Convention and Visitors Bureau
 Minneapolis and St. Paul Business Journal
 Engineering News Record Magazine
 CBRE
 Federal Reserve Bank, 9th District
 Forbes Magazine
 Fortune Magazine
 Facebook for the “Who Even Lives Here?” image
 Greater Minneapolis/St. Paul Chamber of Commerce
 Minneapolis Chamber of Commerce/Meet Minneapolis
 City of Minneapolis – Community Planning and Economic Development
 50States.com
 Minnesota Department of Employment and Economic Development
 Atlantic Magazine
 United Health*
 Target*
 Best Buy*
 CHS*
 Supervalu
 3M Company*
 U.S. Bancorp
 General Mills
 Medtronic
 Land O’ Lakes
 Ecolab
 C.H. Robinson
 Ameriprise Financial
 Xcel Energy
 Mosaic Company
 Hormel Foods
 Thrivent Financial
 St. Jude Medical
* = Also on Fortune Global List
2014
 Mayo Clinic
 Target
 Delta Airlines
 Allina Health
 Wal-Mart Stores
 Wells Fargo
 Fairview Health Services
 UnitedHealth
 Best Buy
 3M Company
 Health Partners
 U.S. Bancorp
 Essentia Health
 Park Nicollet Health
Services
 Supervalu
 Hormel Foods
 Thompson Reuters
 Medtronic
 Xcel Energy (Power)
 Mosaic Company (Mining)
 Target (Retail)
 3M Company (Diversified
Ind.)
 General Mills (Food)
 Medtronic (Medical
Device)
 Allete Inc. (Power)
 Ecolab (Chemicals)
 Ottertail Power (Power)
 Life Time Fitness
(Recreation)
 Fastenal (Industrial)
 H.B. Fuller (Chemicals)
 Hormel Foods (Food)
ENR, November 10, 2014, p 53 - 63
 Target - 13,000
 Wells Fargo - 7,000
 HCMC - 5,800
 Hennepin County - 5,200
 Ameriprise Financial - 5,000
 U.S. Bancorp - 3,400
 City of Minneapolis - 1,800
 Xcel Energy - 1,600
 RBC Wealth Mgmt. - 1,300
 Capella University - 1,200
 Star Tribune - 1,100
 TCF Bank - 1,100
 Federal Reserve Bank -
1,000
 Thrivent Financial - 1,000
 AT&T - 745
 Cargill - $135 B, agribusiness & trading, 143,000 employees
 Carlson Companies -$4.4 B, hotels, travel, 51,000 employees
 Holiday Companies - $4.15 B, convenience stores, 6,000
employees
 Rosen’s Diversified - $3.6 B, agribusiness, 4,000 employees
 Schwan Food - $3.2 B, food, 15,000 employees
 Andersen Windows - $2.3 B windows & doors. 9,000
employees
 MA Mortenson - $2.24 B, construction. 2,500 employees
CONSTRUCTION IN PROGRESS
 Mosaic - $1.5B
 Target - $840m
 General Mills - $600m
 3M Company - $770m
 Life Time Fitness - $160m
CAPITAL EXPENDITURES
 Target
 Xcel Energy
 3M Company
 United Health Group
ENR, November 10, 2014, p 46 - 50
 SEH - $43m
 Barr - $41m
 Bolton & Menk - $38m
 AECOM - $32m
 SRF Consulting - $28m
 AET - $25m
 HDR - $25m
 Amec Foster Wheeler -
$25m
 TKDA - $25m
 Stantec - $23m
 Wenck - $22m
 CH2MHill - $21m
 WSB & Associates - $20m
 Braun Intertec - $19m
 Ulteig Engineers - $18m
 HGA - $18m
 LHB - $16m
 Dunham - $16m
 Machaud Cooley Erickson
- $15m
 VAA - $12m
In State billings. Total actual billings for some firms
is much higher.
MN Construction Forecast by Dodge Data & Analytics
Typical activities include:
• Joining client professional and trade associations
• Involvement in community activities – sports, civic,
social, charitable organizations, etc.
• Online information gathering from client website,
SEC 10K filings, social media feeds, etc.
• Subscribing to online market and business
intelligence services such as Dun & Bradstreet,
Hoovers, AiHit, and Dodge Data & Analytics
Dashboard summarizes opportunity information
Detailed project and contact information are provided
Opportunity Tracking Provides Basis for
Prioritizing BD Activities and Resources
Portfolio “Net Probability” is an indicator of BD program
success: ≤ 25% poor; 30-40% ok; ≥ 50% good
54%
1. Understand the Market Trends
2. Determine your firm’s capability to pursue and
win work
3. Apply a portfolio approach to prioritizing and
managing opportunities
4. Implement “campaign to contract” capture
planning
5. Be logical and efficient
Win rates are significantly
increased by:
• Understanding how you will be
asked to compete
• Knowing your client and your
competition
• Building relationships and trust
• Identifying and communicating
your unique value proposition
• Providing an efficient and
effective framework for
winning work
“Creative” pursuits win. Reactive pursuits lose
Basic go/no-go questions:
 Is the opportunity “real”?
 Do “we” (the firm) want it?
 Can we win it?
 If we win it, can we do it?
 If we do it, can we make a profit, without
significant risk?
 When we finish, will the client be satisfied?
You must be able to say yes to all questions!
By:
1. Understanding the Market Trends
2. Determining your firm’s capability to pursue and
win work
3. Applying a portfolio approach to prioritizing and
managing opportunities
4. Implementing “campaign to contract” capture
planning
5. Being logical and efficient
By:
1. Understanding the market trends
2. Determining your firm’s capability to pursue and
win work
3. Applying a portfolio approach to prioritizing and
managing opportunities
4. Implementing “campaign to contract” capture
planning
5. Being logical and efficient
ACEC-Shift Your Paradigm Webinar - 21-MAY-2015m-rev1

ACEC-Shift Your Paradigm Webinar - 21-MAY-2015m-rev1

  • 3.
    THIS EDUCATIONAL ACTIVITYIS PROTECTED BY U.S. AND INTERNATIONAL COPYRIGHT LAWS. REPRODUCTION, DISTRIBUTION, DISPLAY AND USE OF THE EDUCATIONAL ACTIVITY WITHOUT WRITTEN PERMISSION OF THE PRESENTERS IS PROHIBITED.
  • 4.
    The webinar willprovide participants with insight, processes, and a toolbox to win Private Sector opportunities through: · Understanding A/E/C market trends · Determining your firm’s match to private market client needs · Providing guidance on how to win work efficiently and effectively.
  • 5.
    U.S. Private SectorConstruction Spending Exceeds $700 Billion Annually Private Sector A/E Spending nearly 2.5 x Public sector Top 500 Design Firms’ Private Sector Revenue Reaches $73 Billion
  • 6.
  • 7.
    1. Understand theMarket Trends 2. Determine your firm’s capability to pursue and win work 3. Apply a portfolio approach to prioritizing and managing opportunities 4. Implement “campaign to contract” capture planning 5. Be logical and efficient
  • 8.
    1. Understand theMarket Trends 2. Determine your firm’s capability to pursue and win work 3. Apply a portfolio approach to prioritizing and managing opportunities 4. Implement “campaign to contract” capture planning 5. Be logical and efficient
  • 9.
    Public 31% Private 69% Bldgs & Develop. 21% Power 10% Water/ Waste18% Transport. 21% Industrial & Petroleum 30% 2015 ENR 500 Firm U.S. Revenue = $92B Sectors Markets
  • 10.
    2013 2014 2015 62.1 66 71.2 28.126.7 21.2 ENR 500 Total Revenue Comparison ACEC Member Firms Non-Member Firms $ Billion
  • 11.
    2013 2014 2015 35.5 38.2 45.1 24 26.7 21.2 ENR500 Top Design Firm Comparison ACEC Member Firms Non-Member Firms $ Billion
  • 12.
  • 13.
    $0 $100 $200 $300 $400 $500 $600 $700 $800 $900 $1,000 2005 2006 20072008 2009 2010 2011 2012 2013 2014 2015 Private Public Billion Private Public
  • 14.
    A/E Work PrecedesConstruction by 12-24+ months
  • 15.
  • 16.
    Strongest growth anticipatedin buildings/development, P3 transportation, and manufacturing
  • 17.
    1. Understand theMarket Trends 2. Determine your firm’s capability to pursue and win work 3. Apply a portfolio approach to prioritizing and managing opportunities 4. Implement “campaign to contract” capture planning 5. Be logical and efficient
  • 19.
     Business DevelopmentCapability – Assess:  Firm’s BD culture  Strategic plans and goals  Capability to serve target markets  Client development and relationship building  Marketing management and BD support  Opportunity assessment and management  Campaigns to contracts – capture planning  Skill, resources, and processes gaps  Implement - Plan to fill gaps and maximize marketing and sales efficiency and effectiveness
  • 20.
     Process isnot driven by government regulations  Rules may be less rigid (or harder to identify)  Information may not be public  Lead time may be shorter  May be easier (or harder) to get in  When they trust you access may be easier  Cost may be more important (or the only criteria) But one fact is the same: “When all things are equal, clients hire friends And when they are not equal, they still hire friends”. .
  • 21.
    1. Understand theMarket Trends 2. Determine your firm’s capability to pursue and win work 3. Apply a portfolio approach to prioritizing and managing opportunities 4. Implement “campaign to contract” capture planning 5. Be logical and efficient
  • 22.
    Templates and guidanceare provided for:  Market assessment  Client identification and profiling  Lead and Opportunity identification  Opportunity portfolio assessment and tracking  Pursuit plan and resource requirement  Decision-maker motivators and relationship building  Activity responsibilities and milestones  Revenue and backlog forecasting
  • 23.
     Take a“big picture view” of your world  Understand and appreciate the culture and its people  Identify universe of potential clients  Profile potential clients  Understand what business they are in and what services they may need  Know the competition and your differentiators  Implement client development plans
  • 24.
    Take a “BigPicture View" of Your World
  • 29.
     Metro population- 3,395,300  Major industries - Financial services, technology, biomedical, retail  Gross metro product - $204.7 B  Median household income - $67,976  Median home price - $193,600  Unemployment - 4.4%  Job growth (2013) - 2%  Cost of living - 1.6% below national average  College attainment - 39.5%  Net migration (2013) - 2,210
  • 30.
     The “Miracleof Minneapolis”, Atlantic Magazine  Ranked as one the 10 best cities in the USA  Ranked as the 6th most attractive city  Ranked 3rd among top 50 bike-friendly cities  Ranked 3rd as most livable city in the USA  Ranked 2nd in American Fitness Index  Scored among ‘most innovative cities in America’  Ranked 3rd best city for recent college graduates  Ranked 11th for best places to start a business Source: City of Minneapolis / www.minneapolis.org
  • 31.
     Andrews Sisters James Arness  Warren Burger  Bob Dylan  F. Scott Fitzgerald  Judy Garland  J. Paul Getty  Josh Hartnett  Garrison Keillor  Jessica Lang  John Madden  Joe Mauer  Mayo Brothers  Prince  Charles Schultz  Vince Vaughn  Lindsey Vonn  Jesse Ventura
  • 32.
     Google Maps Wikipedia  City of Minneapolis’s Convention and Visitors Bureau  Minneapolis and St. Paul Business Journal  Engineering News Record Magazine  CBRE  Federal Reserve Bank, 9th District  Forbes Magazine  Fortune Magazine  Facebook for the “Who Even Lives Here?” image  Greater Minneapolis/St. Paul Chamber of Commerce  Minneapolis Chamber of Commerce/Meet Minneapolis  City of Minneapolis – Community Planning and Economic Development  50States.com  Minnesota Department of Employment and Economic Development  Atlantic Magazine
  • 33.
     United Health* Target*  Best Buy*  CHS*  Supervalu  3M Company*  U.S. Bancorp  General Mills  Medtronic  Land O’ Lakes  Ecolab  C.H. Robinson  Ameriprise Financial  Xcel Energy  Mosaic Company  Hormel Foods  Thrivent Financial  St. Jude Medical * = Also on Fortune Global List 2014
  • 34.
     Mayo Clinic Target  Delta Airlines  Allina Health  Wal-Mart Stores  Wells Fargo  Fairview Health Services  UnitedHealth  Best Buy  3M Company  Health Partners  U.S. Bancorp  Essentia Health  Park Nicollet Health Services  Supervalu  Hormel Foods  Thompson Reuters  Medtronic
  • 35.
     Xcel Energy(Power)  Mosaic Company (Mining)  Target (Retail)  3M Company (Diversified Ind.)  General Mills (Food)  Medtronic (Medical Device)  Allete Inc. (Power)  Ecolab (Chemicals)  Ottertail Power (Power)  Life Time Fitness (Recreation)  Fastenal (Industrial)  H.B. Fuller (Chemicals)  Hormel Foods (Food) ENR, November 10, 2014, p 53 - 63
  • 36.
     Target -13,000  Wells Fargo - 7,000  HCMC - 5,800  Hennepin County - 5,200  Ameriprise Financial - 5,000  U.S. Bancorp - 3,400  City of Minneapolis - 1,800  Xcel Energy - 1,600  RBC Wealth Mgmt. - 1,300  Capella University - 1,200  Star Tribune - 1,100  TCF Bank - 1,100  Federal Reserve Bank - 1,000  Thrivent Financial - 1,000  AT&T - 745
  • 37.
     Cargill -$135 B, agribusiness & trading, 143,000 employees  Carlson Companies -$4.4 B, hotels, travel, 51,000 employees  Holiday Companies - $4.15 B, convenience stores, 6,000 employees  Rosen’s Diversified - $3.6 B, agribusiness, 4,000 employees  Schwan Food - $3.2 B, food, 15,000 employees  Andersen Windows - $2.3 B windows & doors. 9,000 employees  MA Mortenson - $2.24 B, construction. 2,500 employees
  • 39.
    CONSTRUCTION IN PROGRESS Mosaic - $1.5B  Target - $840m  General Mills - $600m  3M Company - $770m  Life Time Fitness - $160m CAPITAL EXPENDITURES  Target  Xcel Energy  3M Company  United Health Group ENR, November 10, 2014, p 46 - 50
  • 40.
     SEH -$43m  Barr - $41m  Bolton & Menk - $38m  AECOM - $32m  SRF Consulting - $28m  AET - $25m  HDR - $25m  Amec Foster Wheeler - $25m  TKDA - $25m  Stantec - $23m  Wenck - $22m  CH2MHill - $21m  WSB & Associates - $20m  Braun Intertec - $19m  Ulteig Engineers - $18m  HGA - $18m  LHB - $16m  Dunham - $16m  Machaud Cooley Erickson - $15m  VAA - $12m In State billings. Total actual billings for some firms is much higher.
  • 41.
    MN Construction Forecastby Dodge Data & Analytics
  • 42.
    MN Construction Forecastby Dodge Data & Analytics
  • 43.
    Typical activities include: •Joining client professional and trade associations • Involvement in community activities – sports, civic, social, charitable organizations, etc. • Online information gathering from client website, SEC 10K filings, social media feeds, etc. • Subscribing to online market and business intelligence services such as Dun & Bradstreet, Hoovers, AiHit, and Dodge Data & Analytics
  • 45.
  • 46.
    Detailed project andcontact information are provided
  • 48.
    Opportunity Tracking ProvidesBasis for Prioritizing BD Activities and Resources Portfolio “Net Probability” is an indicator of BD program success: ≤ 25% poor; 30-40% ok; ≥ 50% good 54%
  • 49.
    1. Understand theMarket Trends 2. Determine your firm’s capability to pursue and win work 3. Apply a portfolio approach to prioritizing and managing opportunities 4. Implement “campaign to contract” capture planning 5. Be logical and efficient
  • 50.
    Win rates aresignificantly increased by: • Understanding how you will be asked to compete • Knowing your client and your competition • Building relationships and trust • Identifying and communicating your unique value proposition • Providing an efficient and effective framework for winning work
  • 51.
    “Creative” pursuits win.Reactive pursuits lose
  • 54.
    Basic go/no-go questions: Is the opportunity “real”?  Do “we” (the firm) want it?  Can we win it?  If we win it, can we do it?  If we do it, can we make a profit, without significant risk?  When we finish, will the client be satisfied? You must be able to say yes to all questions!
  • 55.
    By: 1. Understanding theMarket Trends 2. Determining your firm’s capability to pursue and win work 3. Applying a portfolio approach to prioritizing and managing opportunities 4. Implementing “campaign to contract” capture planning 5. Being logical and efficient
  • 56.
    By: 1. Understanding themarket trends 2. Determining your firm’s capability to pursue and win work 3. Applying a portfolio approach to prioritizing and managing opportunities 4. Implementing “campaign to contract” capture planning 5. Being logical and efficient