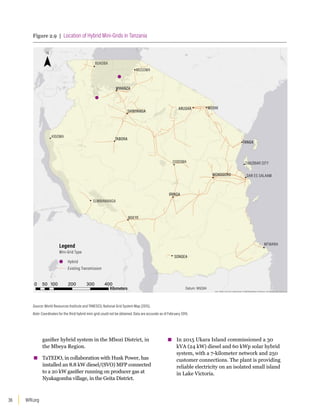
The document provides an overview and analysis of mini-grid development in Tanzania based on interviews and research. Some key findings:
- Tanzania has over 100 mini-grids powered by hydro, fossil fuels, biomass, solar and hybrid technologies. The number and capacity of mini-grids has nearly doubled since 2008 policy reforms.
- The initial 2008 policy favored hydro and biomass but did not support solar/wind. The 2015 revisions differentiated tariffs by technology and introduced competitive bidding to better support solar and wind.
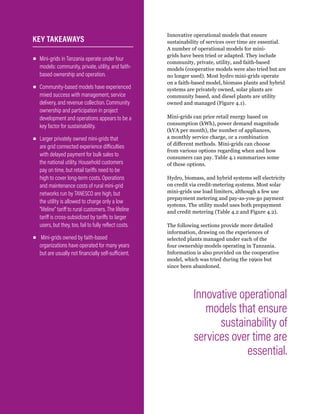
- Mini-grids are owned and operated by the national utility, private companies, faith groups and communities, with varying levels of financial sustainability.
- The process for obtaining necessary approvals
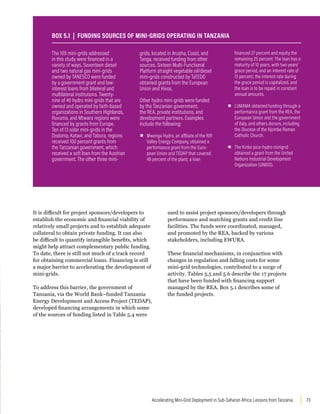
![WRI.org
14
The majority of households, small- and medium-
size enterprises, and institutions in rural Sub-
Saharan Africa lack access to reliable electricity
and spend much of their resources on poor-quality
substitutes. In many countries national utilities lack
the resources to finance centralized grid extensions
to remote areas of the country, where low levels
of electricity consumption and limited ability to
pay for service in rural areas often make these
extensions uneconomic (Tenenbaum et al. 2014).
Globally, the energy sector is facing new challenges
and opportunities, many of which have implications
for the future of traditional grid infrastructure. The
deployment of newer technologies (such as solar
photovoltaic [PV]), the trend toward distributed
generation, and policy shifts that encourage cleaner
energy are creating new ways in which electricity
sector planners can meet energy access goals (Jairaj
et al. 2016).
In Africa consensus has formed that decentralized
energy provision must complement centralized
grid expansion efforts if countries are to meet their
energy access targets (Tenenbaum et al. 2014).
The International Energy Agency (IEA) projects
that mini-grids (see Box 1.1) and stand-alone
off-grid systems will play key roles in extending
electricity to many rural areas in Africa that do not
have access to national grids. It estimates that 140
million of the projected 315 million rural Africans
who will gain access to electricity by 2040 will be
served by mini-grids. Achieving this level of access
will require 100,000–200,000 mini-grids (IEA
2014a; UN 2015a).
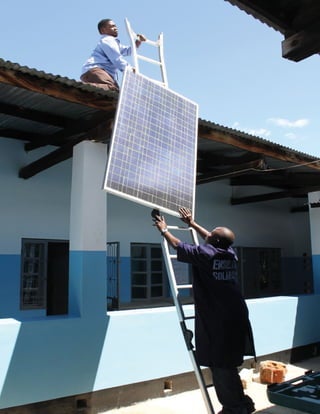
There is limited experience in Sub-Saharan Africa
in developing and implementing mini-grids at
scale. Local knowledge and capacity are lacking
in terms of choosing the technology, crafting
sustainable and scalable business models, and
creating enabling policy/financial environments. A
few countries, including Tanzania (Box 1.2), have
had some successes in creating attractive policy
environments and regulatory frameworks for mini-
grids, and some small power producers (SPPs)
have generated investor interest. The time is right
to document the progress that has been made, so
that Tanzania’s experience can benefit mini-grid
stakeholders both inside the country and in other
countries in the region.
A mini-grid can be defined as one or more electricity
generators, and sometimes storage systems,
connected to a distribution network serving multiple
customers. Mini-grids can provide electricity at the
local level using isolated distribution networks. They
can accelerate access to electricity in remote rural
communities that would otherwise have to wait
years, if not decades, for a grid connection. Mini-grids
typically provide higher levels of energy service than
solar home systems. They can operate as isolated grids
or be connected to a central grid.
BOX 1.1 | WHAT IS A MINI-GRID?](https://image.slidesharecdn.com/accelerating-mini-grid-deployment-sub-saharan-africa1-221222124130-7ed23cad/85/accelerating-mini-grid-deployment-sub-saharan-africa_1-pdf-18-320.jpg)
![WRI.org
20
Energy Access in Tanzania
Tanzania enjoys political stability and saw economic
growth rates of about 7 percent over the past decade.
Social well-being indicators (education, health,
nutrition, employment) improved during this period,
but poverty remains widespread, particularly in
rural areas, where three-quarters of the population
lives. Approximately 28 percent of the country’s
inhabitants live below the poverty line.2
Given the country’s young demographic profile,
Tanzania will experience rapid population growth
in coming years. According to the national census
(www.nbs.go.tz), the population was 44.9 million
in 2012, with an annual growth rate of 2.9 percent.
Based on this growth rate, the population at the end
of 2016 is estimated at 50.3 million. The United
Nations’ median population projection is more than
82 million by 2030 (UN 2015b).
Continued economic and population growth will
create strong demand for electricity. According to the
International Energy Agency (IEA 2014b), demand
in Tanzania could rise by an annual average rate of
6.6 percent between 2012 and 2040.3
Providing access to electricity remains a major
challenge. Ninety percent of the energy consumed
in Tanzania comes from biomass; only 1.5 percent
comes from electricity (URT 2015b). As of 2014,
less than 20 percent of the population had access
to electricity, with a dramatic difference between
urban areas (43 percent access) and rural areas (6
percent access).4
The challenges facing Tanzania’s energy sector are
similar to the challenges facing other countries
in Sub-Saharan Africa. The national utility, the
Tanzania Electric Supply Company (TANESCO),
struggles to maintain financial solvency. Tanzania’s
electricity sector is largely vertically integrated:
TANESCO owns the majority of generation assets
and all transmission and distribution assets. As
part of its Electricity Supply Industry Reform
Strategy 2014–2025, Tanzania plans to unbundle
its electricity sector and separate TANESCO’s
generation, transmission, and distribution
functions, eventually privatizing some components.
These reforms are driven by the Tanzanian
Development Vision, which seeks to make Tanzania
a middle-income country by 2025.
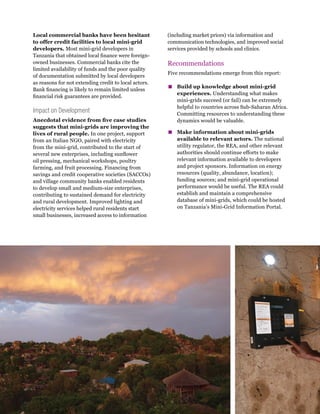
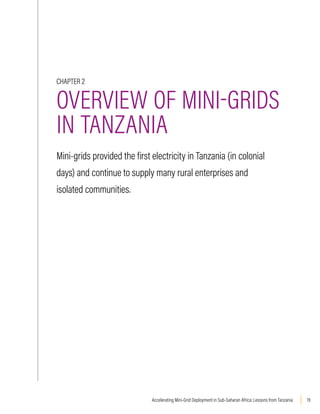
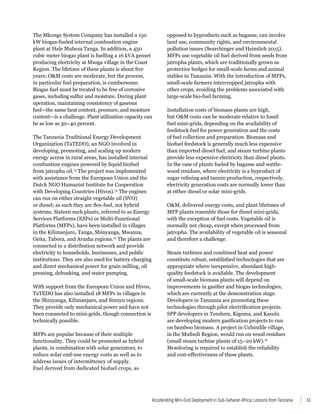
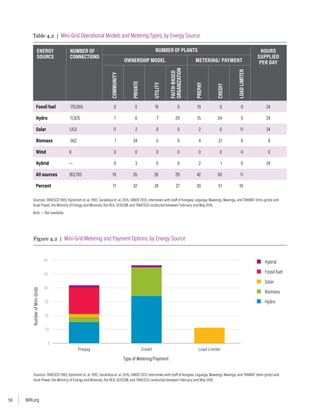
▪
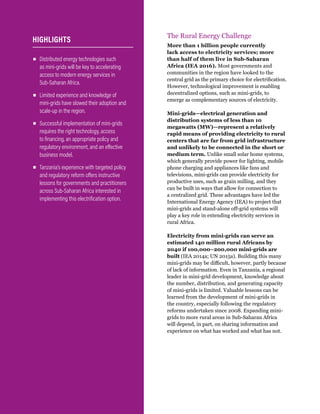
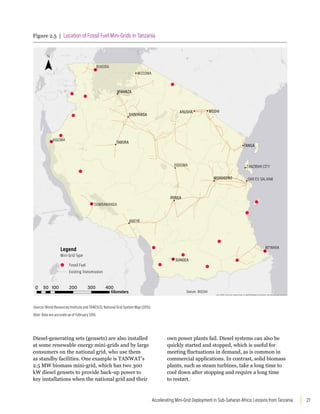
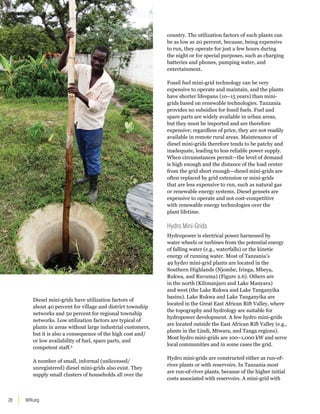
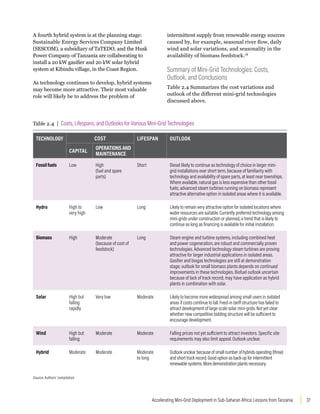
▪ Mini-grids provided the first electricity in
Tanzania (in colonial days) and continue to
supply many rural enterprises and isolated
communities. Developers have favored
technologies that have proven to be robust
and cost-effective.
▪
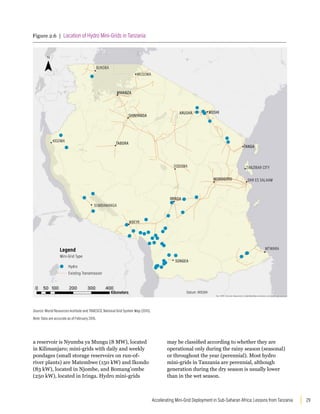
▪ Hydro mini-grids are the most common type
of mini-grids, but fossil fuel and biomass
systems dominate installed capacity. Hydro is
expected to remain the dominant technology
if current financing support is maintained.
▪
▪ Diesel and natural gas mini-grids (all owned
by the Tanzania Electric Supply Company
[TANESCO]) account for the vast majority of
mini-grid customers.
▪
▪ Diesel and natural gas plants are large
(average 3.8 MW) and relatively inexpensive
to install, but they need frequent maintenance
and spare parts that are not readily available
in rural areas.
▪
▪ Hydro mini-grids are smaller (average 672 kW),
and most of them are run-of-river installations.
They are expensive to build but long-lived and
relatively inexpensive to operate.
▪
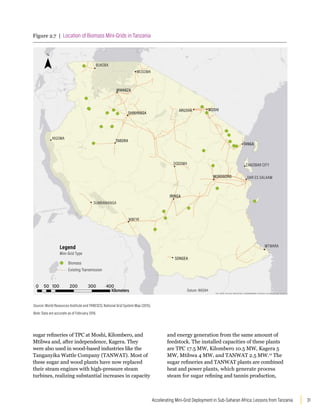
▪ Most biomass plants (average 2.1 MW) are
commercially owned units powering wood
or sugar mills and supplying other users in
the vicinity. They are moderately inexpensive
to build and maintain, but fuel supply and
preparation can be challenging.
▪
▪ Consumers are familiar with stand-alone solar
home systems; they are less familiar with
larger solar mini-grid systems that provide
services to a cluster of users. Solar mini-grids
remain mostly at the demonstration stage.
▪
▪ Numerous small, informal diesel mini-
grids exist. They supply small clusters of
households all over the country and are not
captured in formal records.
KEY TAKEAWAYS](https://image.slidesharecdn.com/accelerating-mini-grid-deployment-sub-saharan-africa1-221222124130-7ed23cad/85/accelerating-mini-grid-deployment-sub-saharan-africa_1-pdf-24-320.jpg)

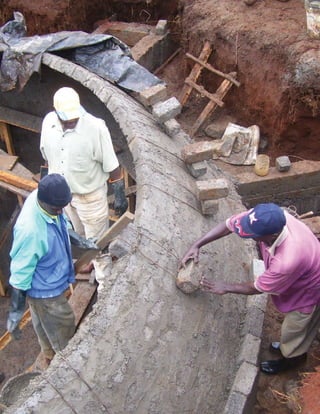
![43
Accelerating Mini-Grid Deployment in Sub-Saharan Africa: Lessons from Tanzania
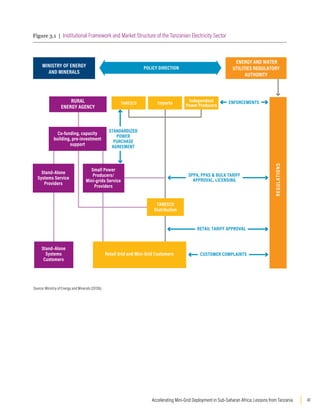
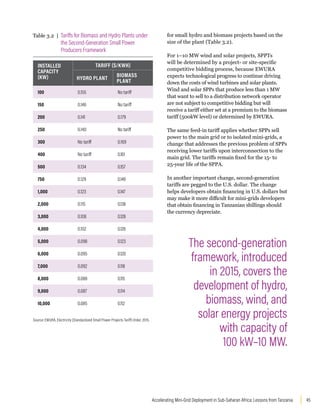
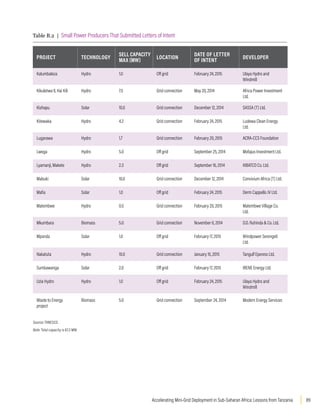
The Policy and Regulatory Framework
In recognition of the role of the private sector
and the opportunities to increase and diversify
the energy supply, Tanzania has developed a
comprehensive set of policies, supporting acts, and
regulations to encourage private actors to develop
small-scale distributed renewable energy resources.
The SPP framework addresses some of the barriers
that previously discouraged commercial or quasi-
commercial mini-grid development.
The SPP framework incorporates feed-in tariffs
(standardized power purchase tariffs [SPPTs]
in the Tanzanian context) for SPPs that use
renewable energy. Feed-in tariffs are tariff-support
mechanisms often used to encourage renewable
energy development by providing long-term price
agreements that can provide a return on investment
for developers that sell electricity to a central utility.
In Tanzania EWURA determines these tariffs and
sets the price at which TANESCO pays SPPs for
electricity. SPPs may choose to sell electricity to
TANESCO through interconnection with the grid or
with a TANESCO-owned isolated mini-grid.
The agreement is laid out in a long-term contract
(known as a standardized power purchase
agreement [SPPA]) between the SPP and
TANESCO. SPPTs and SPPAs enable the developer/
sponsor to determine whether, given the tariff, it
will be able to recoup its investment over the term
of the power purchase agreement.
The regulatory process for SPP projects under
EWURA has been streamlined and simplified. SPPs
can obtain a provisional generation and distribution
license that provides them with temporary exclusive
use rights for three years, during which time they
conduct preparatory assessments, studies, financial
arrangements, land acquisitions, construction, and
other activities leading to an application for a final
license (SIDA/DfID 2015).
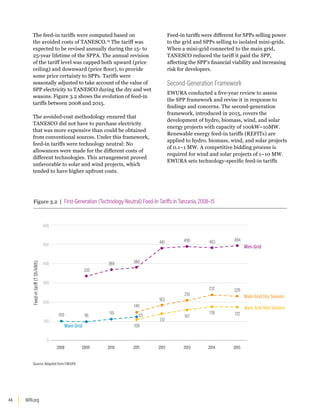
First- and Second-Generation Small
Power Producers Frameworks
First-Generation Framework
The first-generation SPP Framework was adopted
in 2008. It outlined a clear process for the
initiation, signing, and licensing of SPPs. It also
enacted SPPAs and SPPTs for producers that
chose to sell power to TANESCO. SPPAs could be
applied for only in the case of projects of 1 MW or
larger; they were signed for 15–25 years. SPPAs and
SPPTs were created to minimize the time spent on
negotiations between developers and TANESCO.
The first-generation framework distinguished the
prices the SPP received for the sale of its electricity
depending on who the off-taker was. The off-
taker could be TANESCO through the main grid,
TANESCO through an isolated mini-grid, and/or
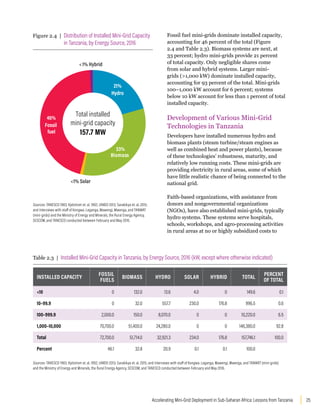
retail customers (Table 3.1).
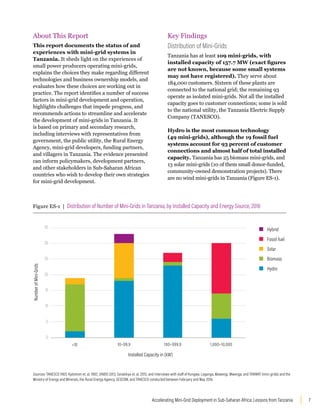
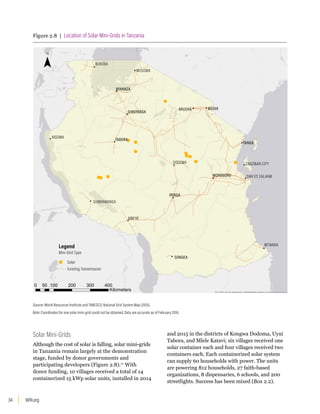
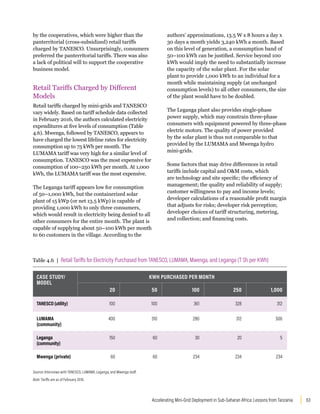
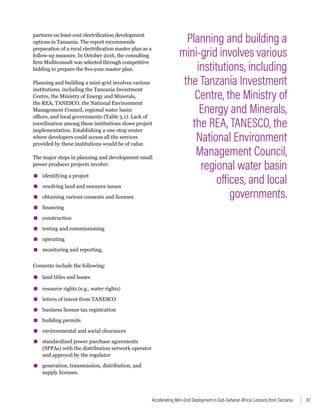
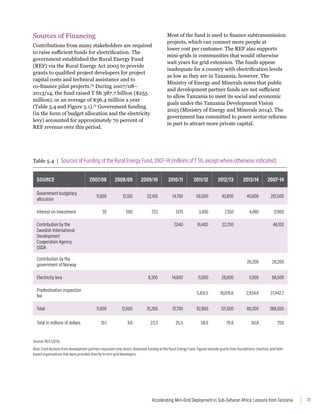
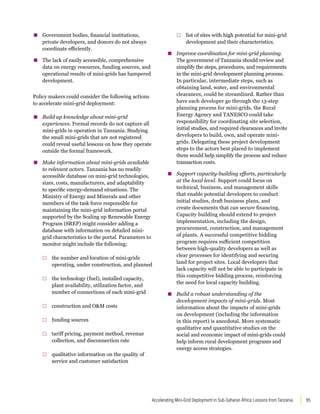
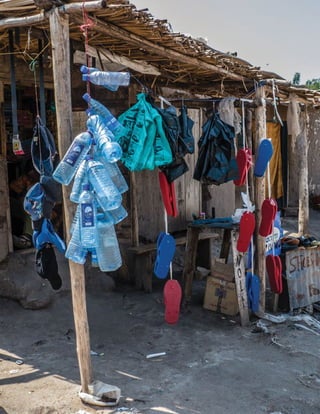
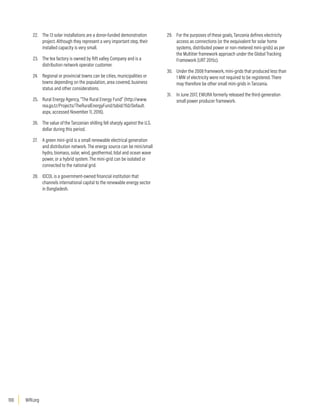
Table 3.1 | Tariffs under the First-Generation Small Power Producers Framework
TYPE OF SALE APPLICABLE TARIFF
Wholesale to TANESCO main grid Feed-in tariff based on main grid cost avoided by TANESCO.
Wholesale to TANESCO isolated mini-grid Feed-in tariff based on mini-grid cost avoided by TANESCO.
Directly to retail customers Developer must submit application to EWURA for end-user (cost-
based) tariff.
Sources: Adapted from EWURA (2011), Kahyoza and Greacen (2011), and Mtepa (2014).](https://image.slidesharecdn.com/accelerating-mini-grid-deployment-sub-saharan-africa1-221222124130-7ed23cad/85/accelerating-mini-grid-deployment-sub-saharan-africa_1-pdf-47-320.jpg)
![WRI.org
76
$10 million will be used primarily for on-grid
electrification; the remaining $2 million and the
$39 million from the United Kingdom will support
private sector–led renewable energy investments
(SIDA/DfID 2015). The distribution of these funds
to off-grid investments will be under a results-
based financing facility, which will consider the
number of connections and the quality of service
in distributing grants (REA 2016).
The World Bank has committed to support a $200
million renewable energy and rural electrification
project for conventional grid extension and
provide $75 million for mini-grid projects, the SPP
credit line, and a risk mitigation facility.
Funding outside the Small Power Producers
Framework
Of the 52 mini-grids constructed since 2008,
35 did not receive financing through TEDAP or
the REF. These projects are funded by donors.
Examples include two gasifier mini-grids, one being
constructed by the Sustainable Energy Services
Company (SESCOM) in Kibindu village, through
a grant from the U.S. African Development Fund
(USADF) Power Africa Program, and another, being
constructed by TaTEDO, ONGAWA, and Husk
Power, in Biro village, through a grant from the
Environmental and Energy Program, supported by
the Finnish government.
Shortcomings of the Small Power Producer
Funding System
A number of challenges have been experienced
in the course of implementing some of the new
financing mechanisms for mini-grids in Tanzania.
For example, some of the matching grants
provided to potential project developers for initial
studies were not used for the intended purposes,
underscoring the need for stronger monitoring
and evaluation (ME).
In addition to ME for grant use, there is also
a need for ME of product quality. Global
experience establishes that ME is a necessary
component for market development. Substandard
and poor-quality products create risks of market
spoilage and widespread mistrust in renewable
technologies.
ME is more feasible in some contexts than in
others. In Bangladesh, for example, the country’s
dense population, the smaller geographic span
of the market, and the existence of a central
institution (the Infrastructure Development
Company Limited [IDCOL]) with the authority
and resources to tie financing to product standards
have contributed to the success of its ME of a
solar home system program (World Bank 2015).28
ME may be much more challenging in Tanzania,
given its large geographic area and dispersed
population centers. Nonetheless, funding to
support ME will be necessary for market growth.
A number of developers that submitted feasibility
studies and business plans to commercial banks
were unsuccessful in obtaining credit. Most of
those that succeeded were foreign developers.
Some of the reasons cited by commercial banks
for failure to grant financing included the limited
funds available and the poor quality of the
submitted documentation. Part of the problem
may be inadequate experience on the part of some
Tanzanian developers. Proper documentation
and submission of requests to various financing
institutions in acceptable formats are critical to
obtaining funds. It may be necessary to devote
more resources to building the capacity of local
developers and institutions to do so.
Bank financing is likely to remain limited without
financial risk guarantees. Potential developers
and financial institutions are often unaware of
the favorable regulatory framework for renewable
energy mini-grids and the new financing
arrangements that are available to them.](https://image.slidesharecdn.com/accelerating-mini-grid-deployment-sub-saharan-africa1-221222124130-7ed23cad/85/accelerating-mini-grid-deployment-sub-saharan-africa_1-pdf-80-320.jpg)


![5G Explained! A High Level Overview [Introduction]](https://cdn.slidesharecdn.com/ss_thumbnails/5gexplainedahighleveloverview-260119165306-cc137a3e-thumbnail.jpg?width=640&height=640&fit=bounds)


