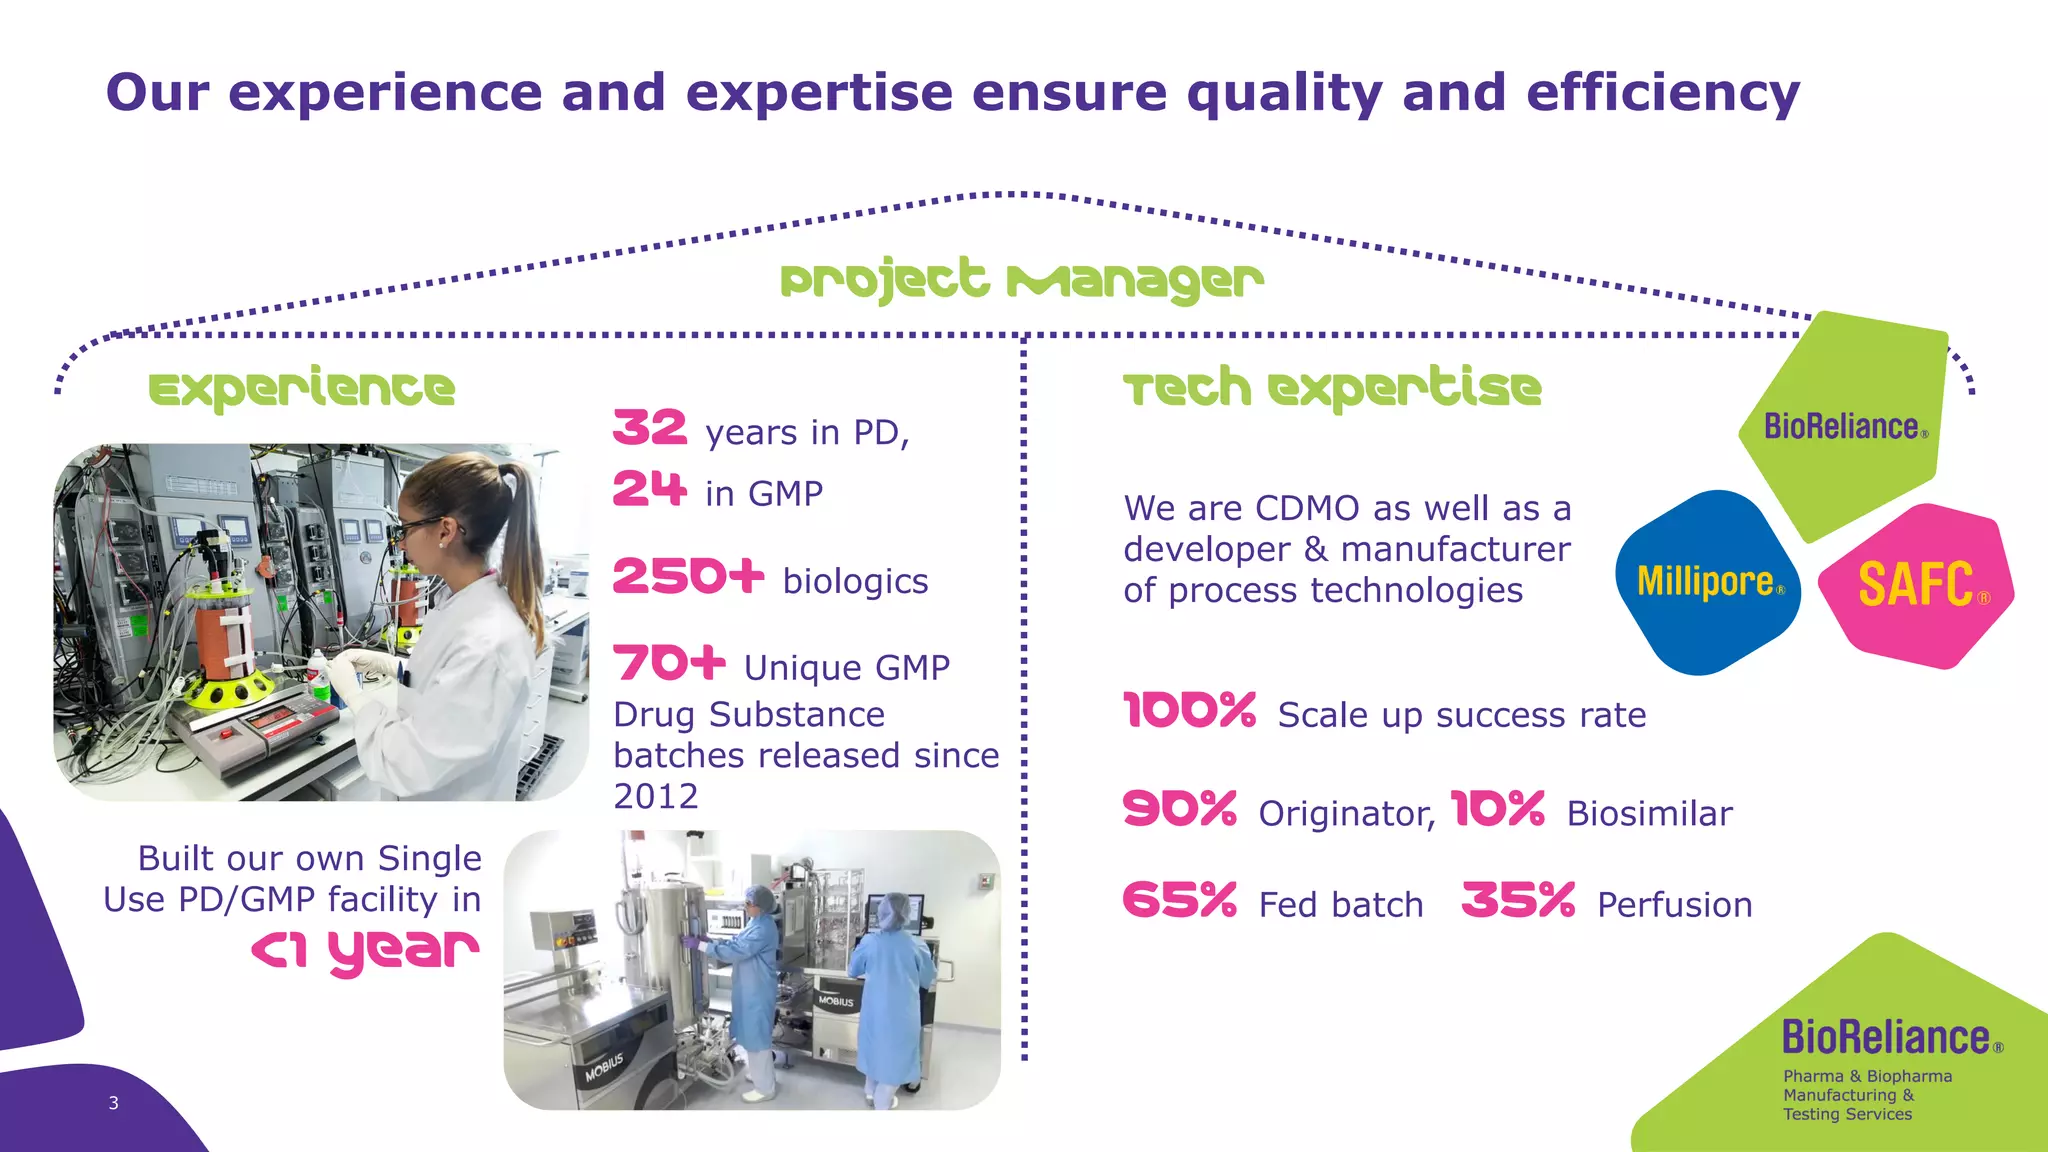
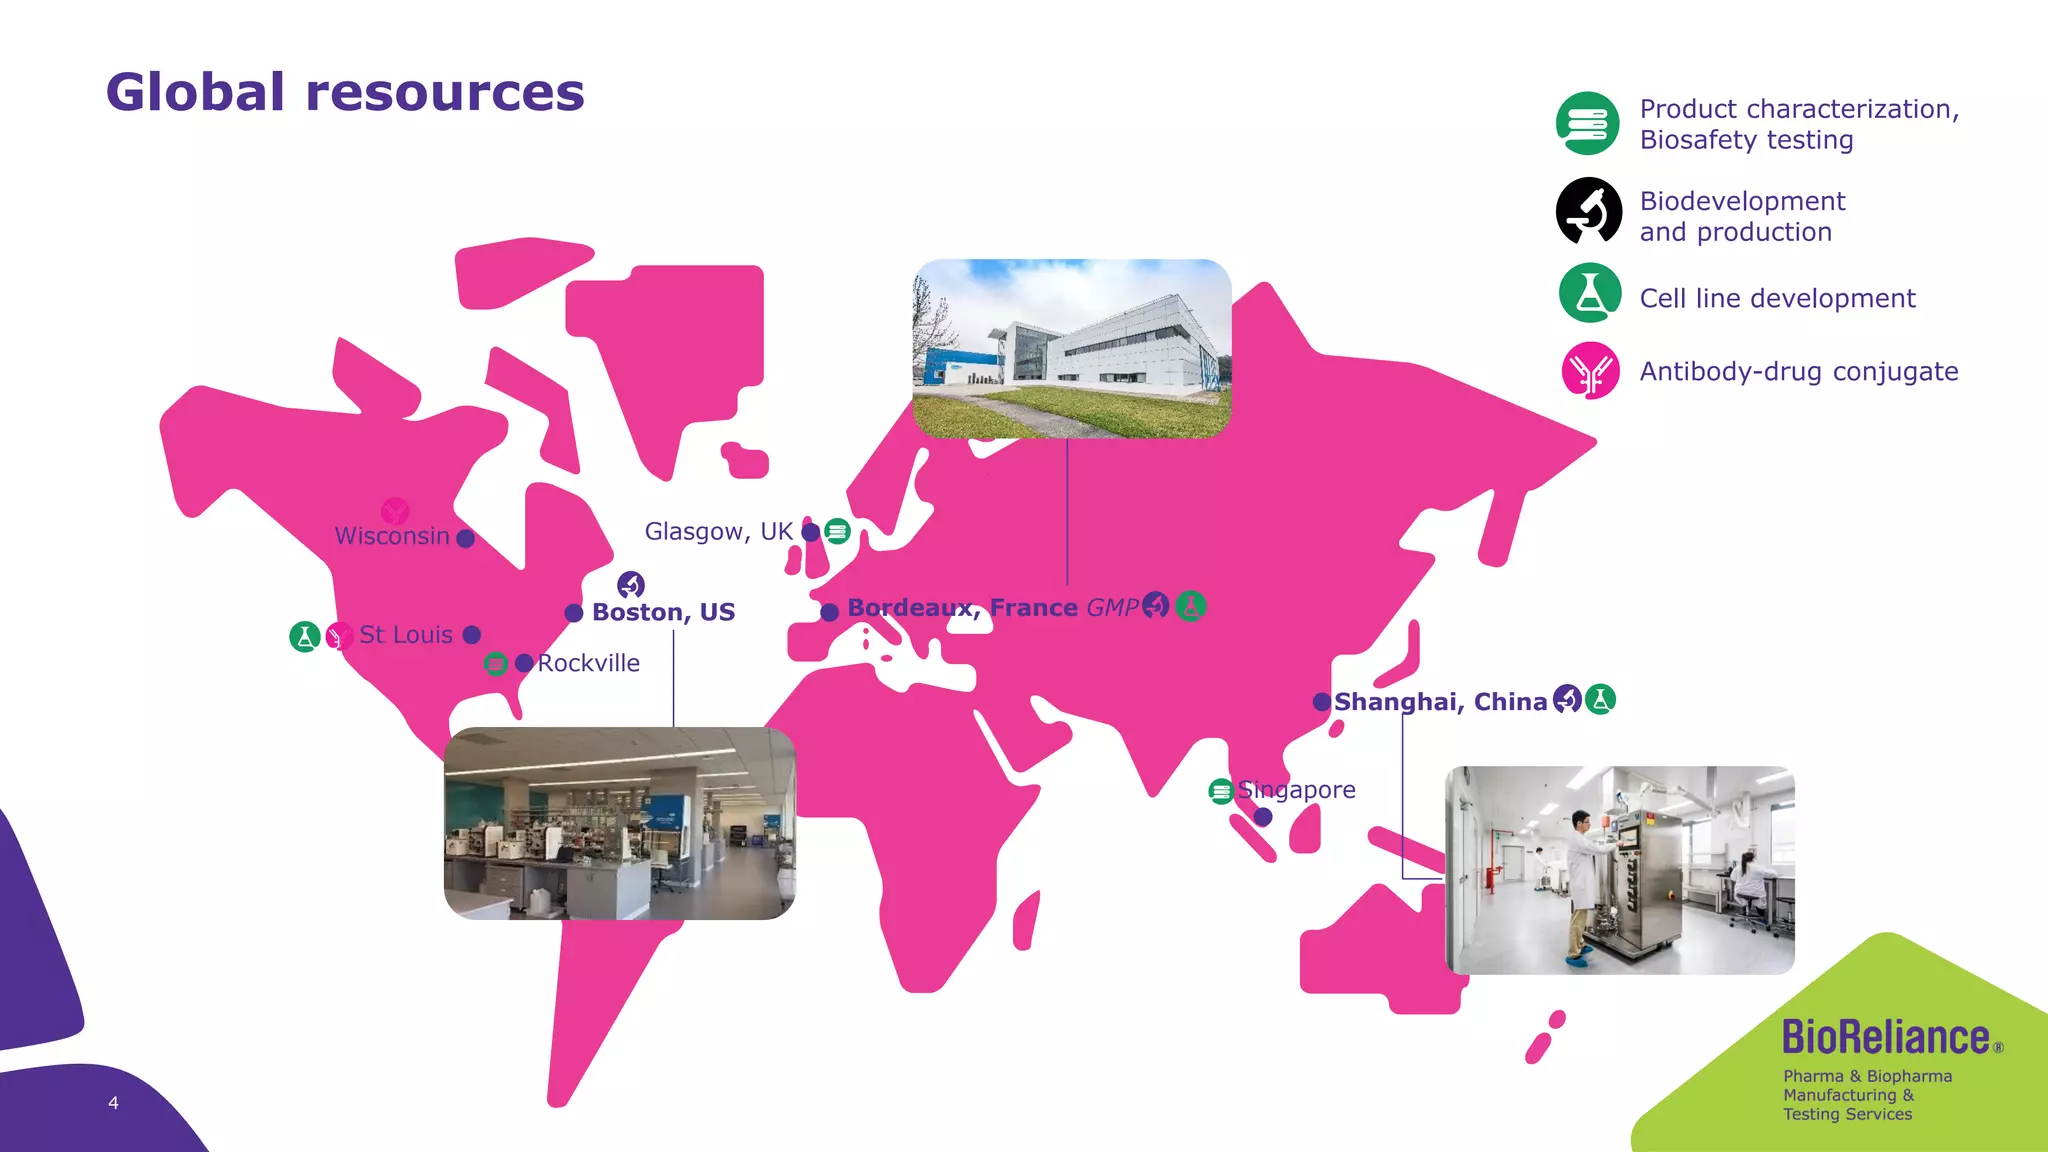
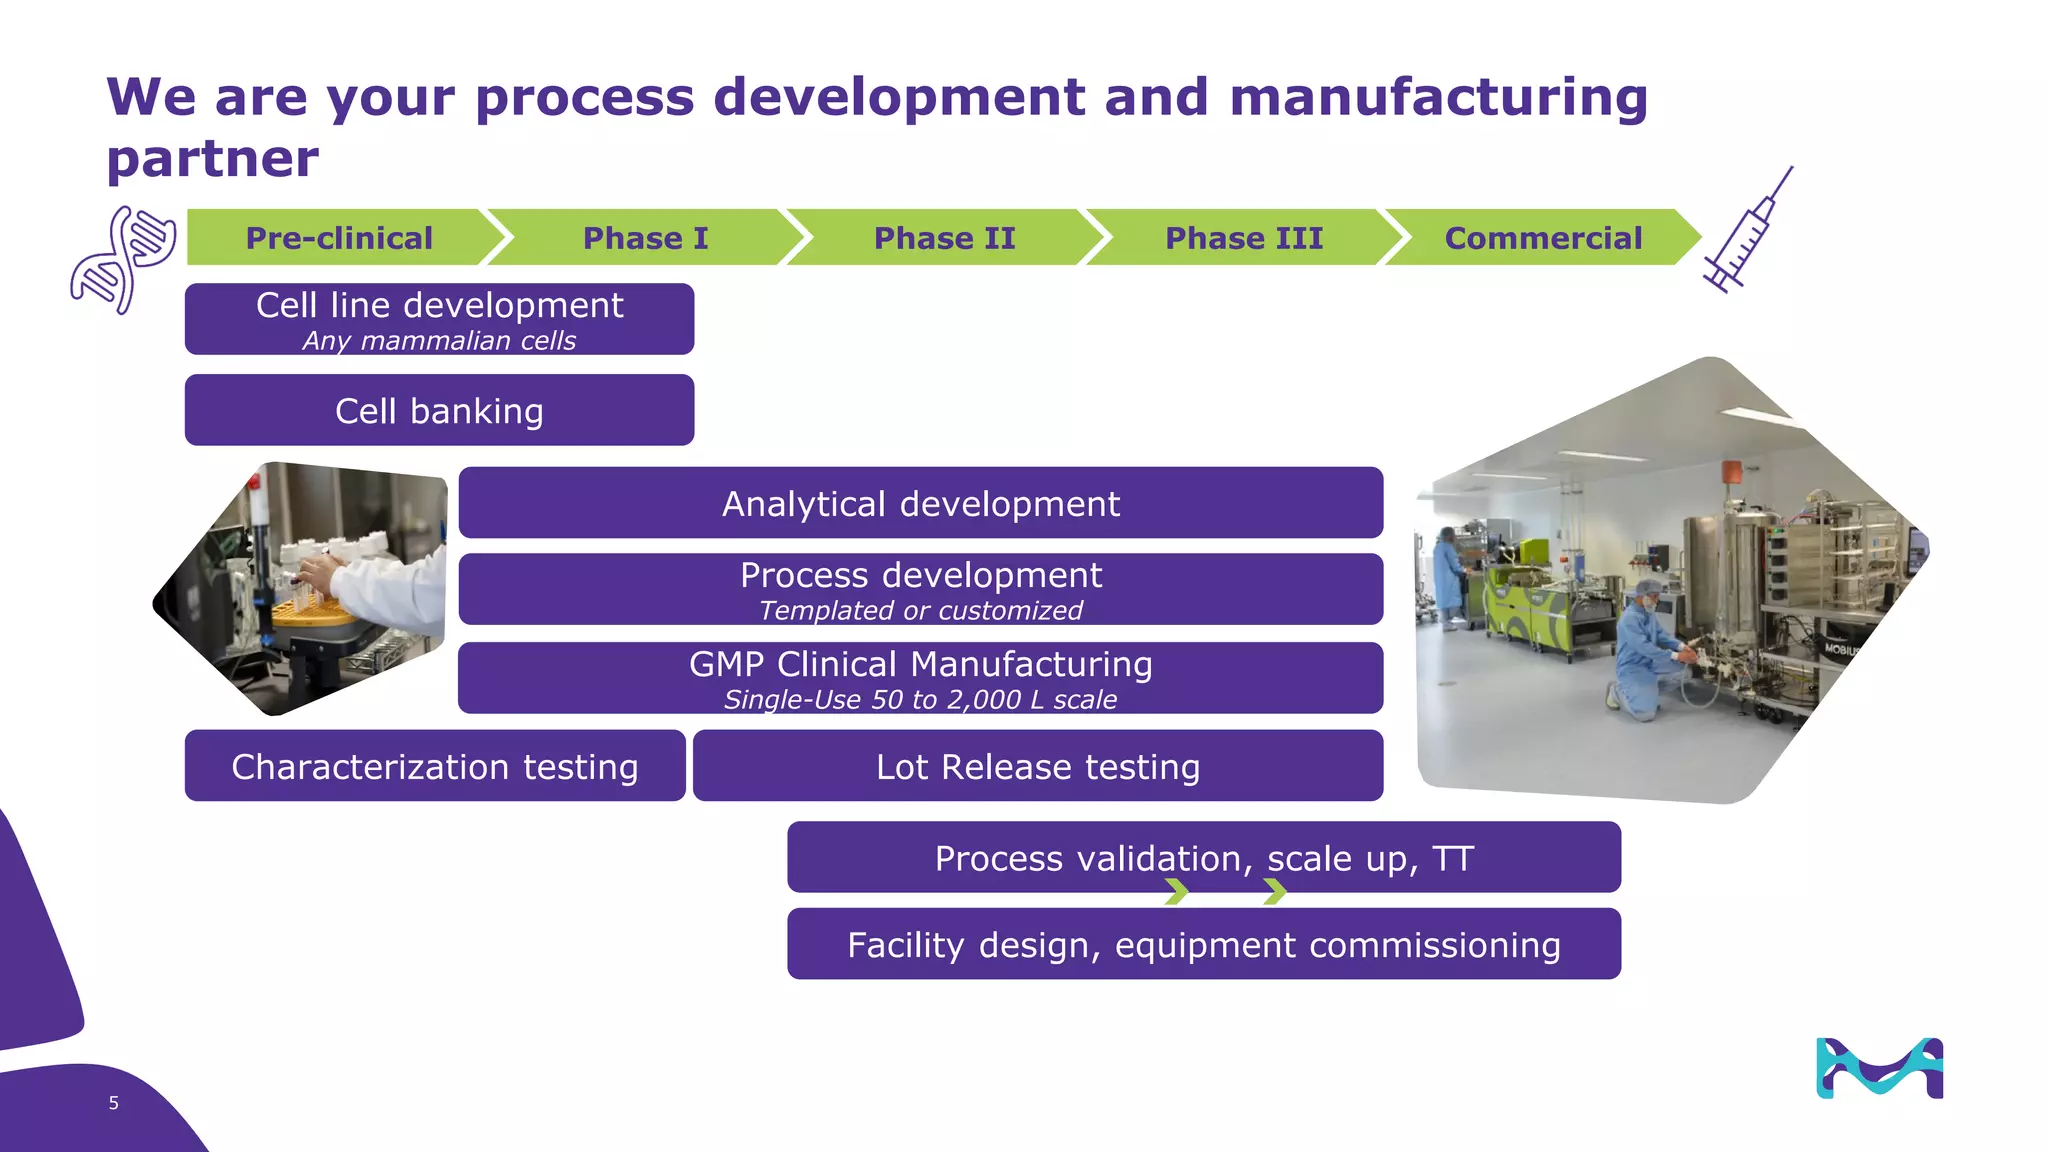
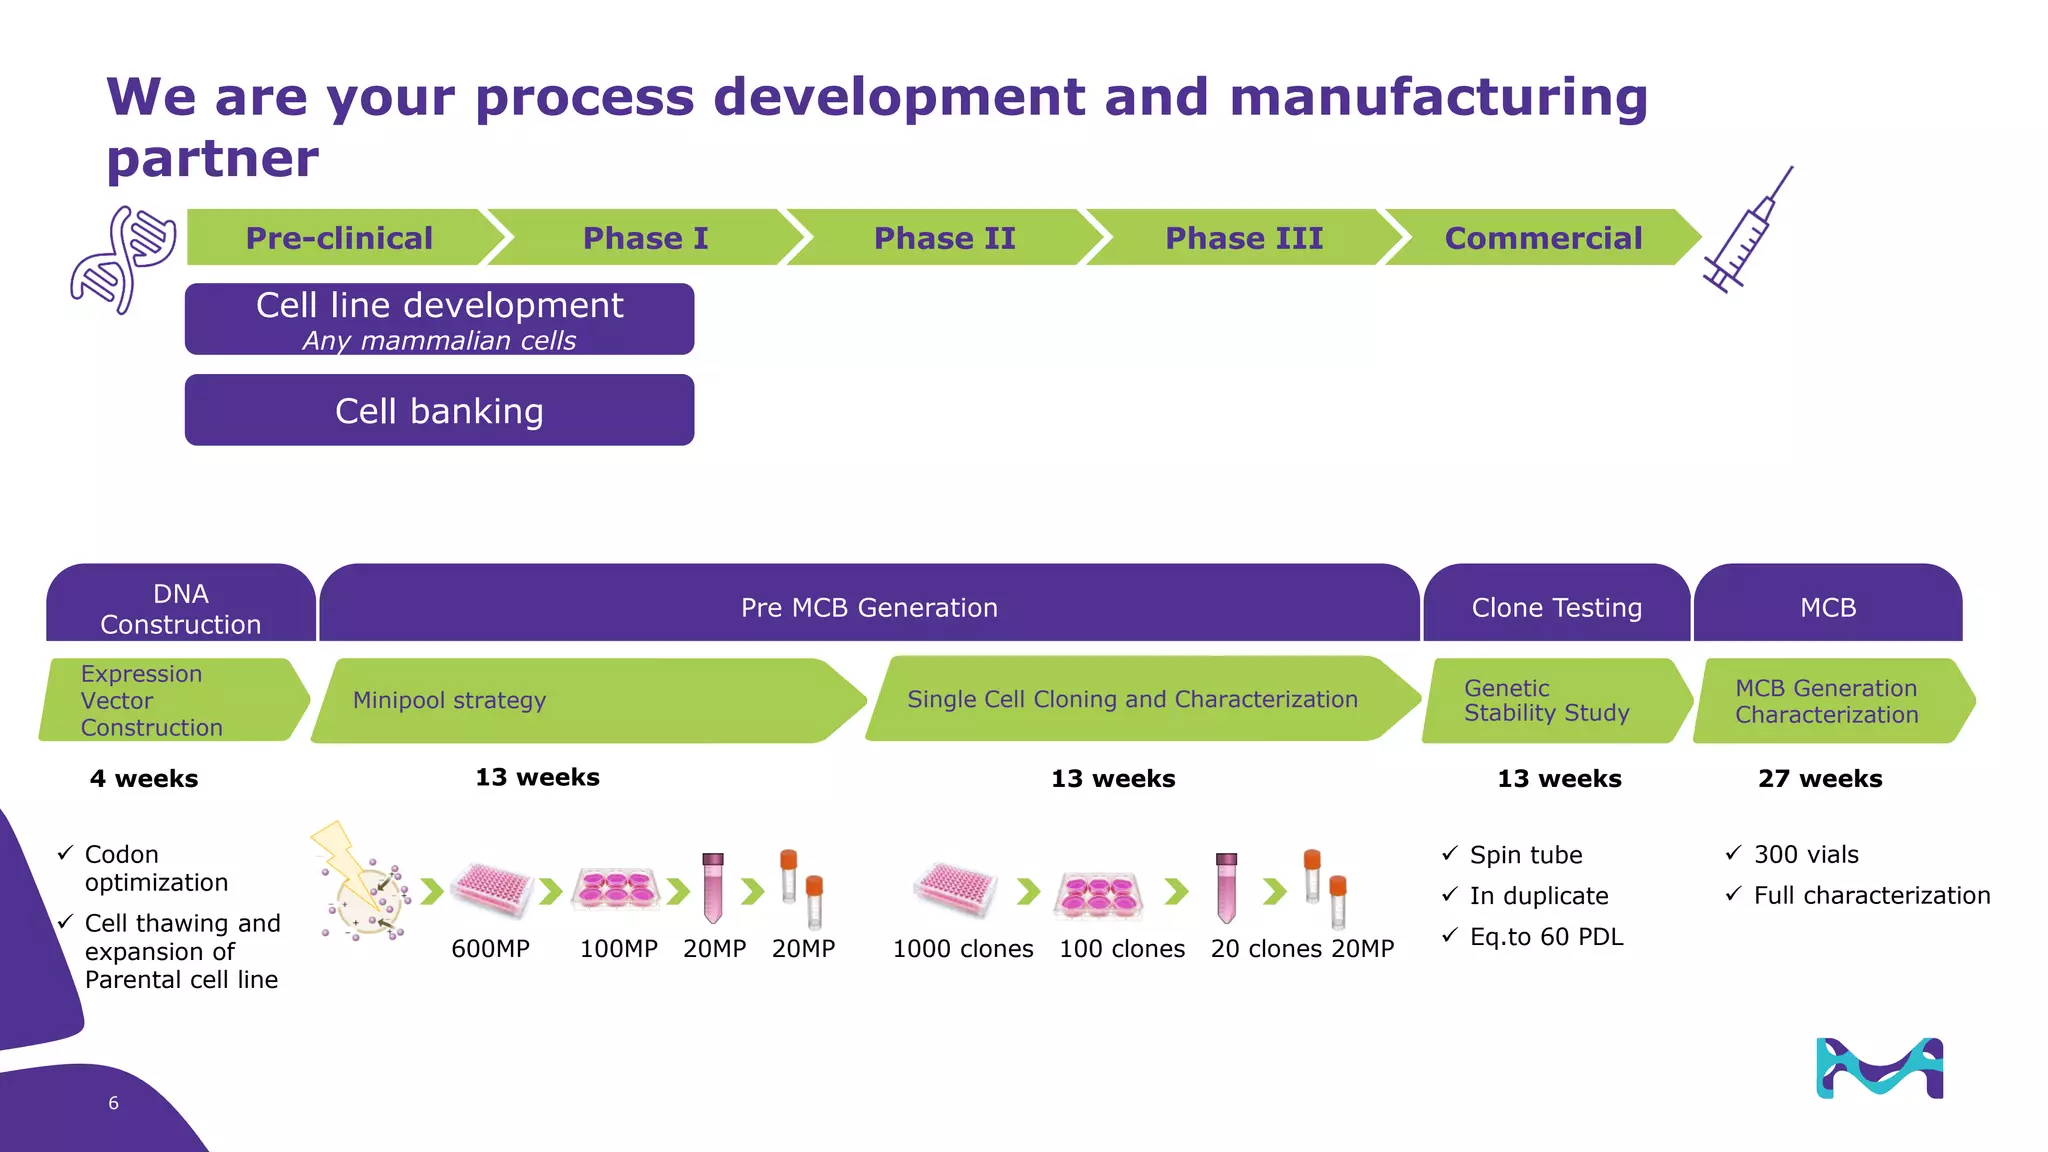
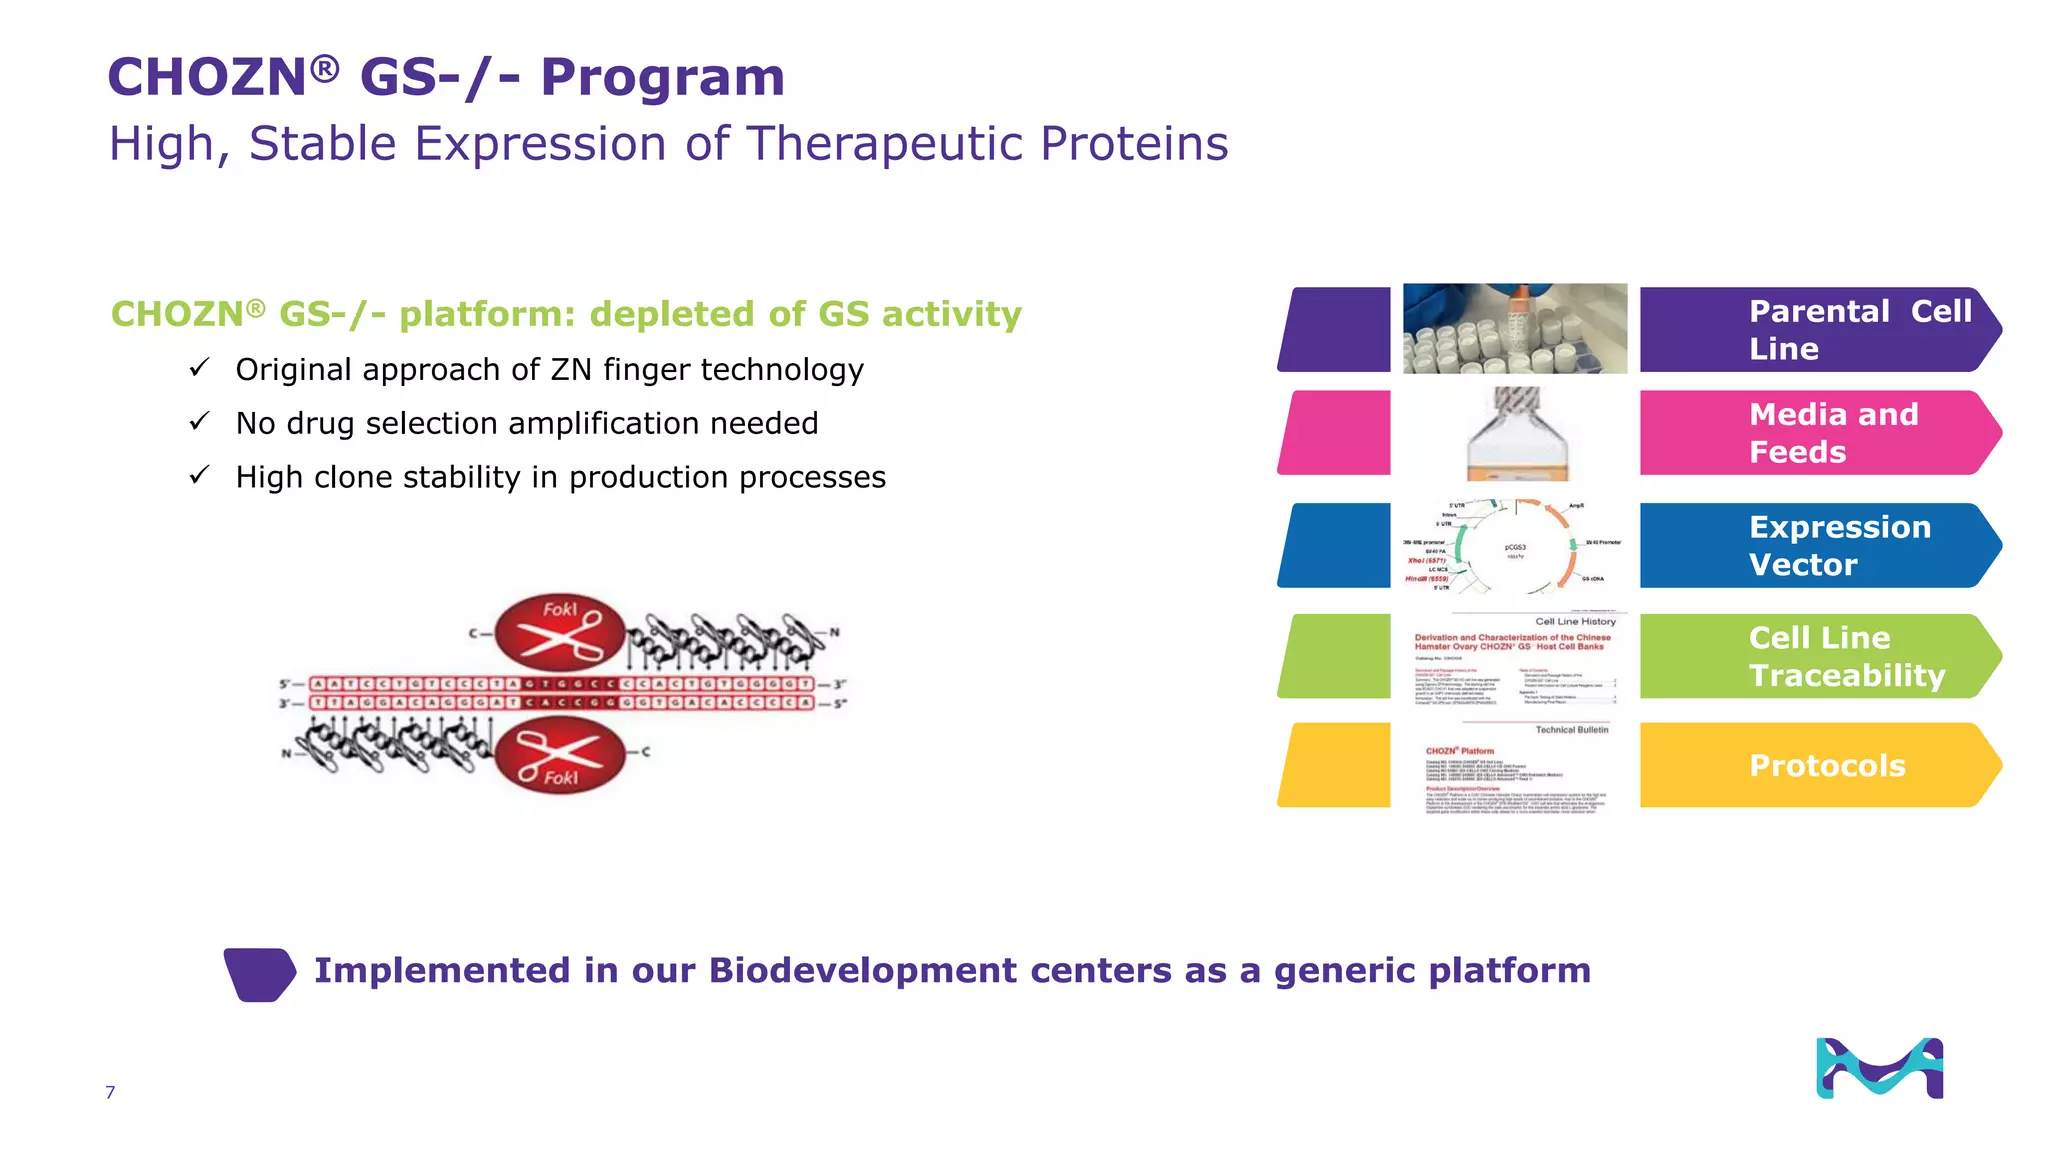
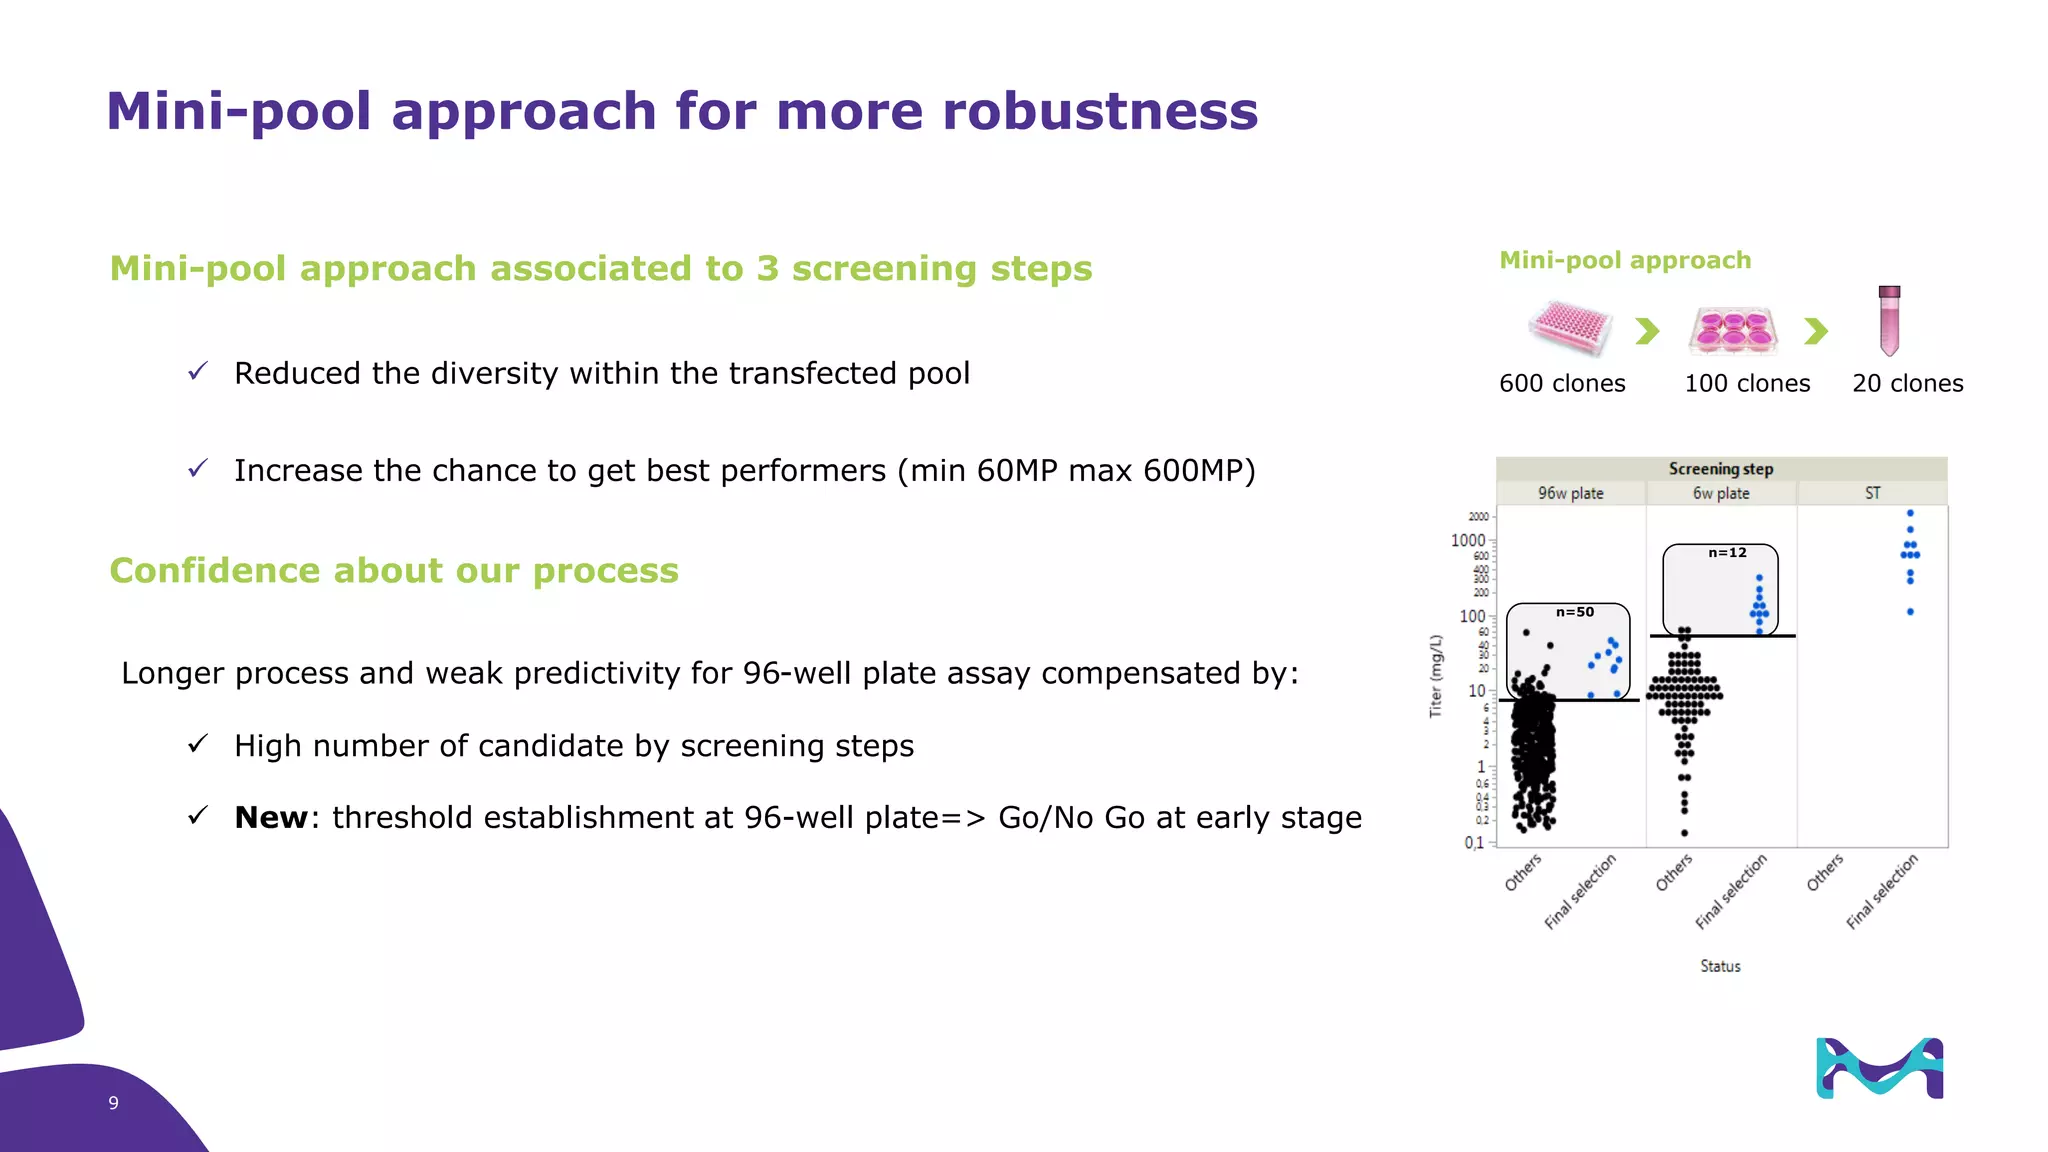
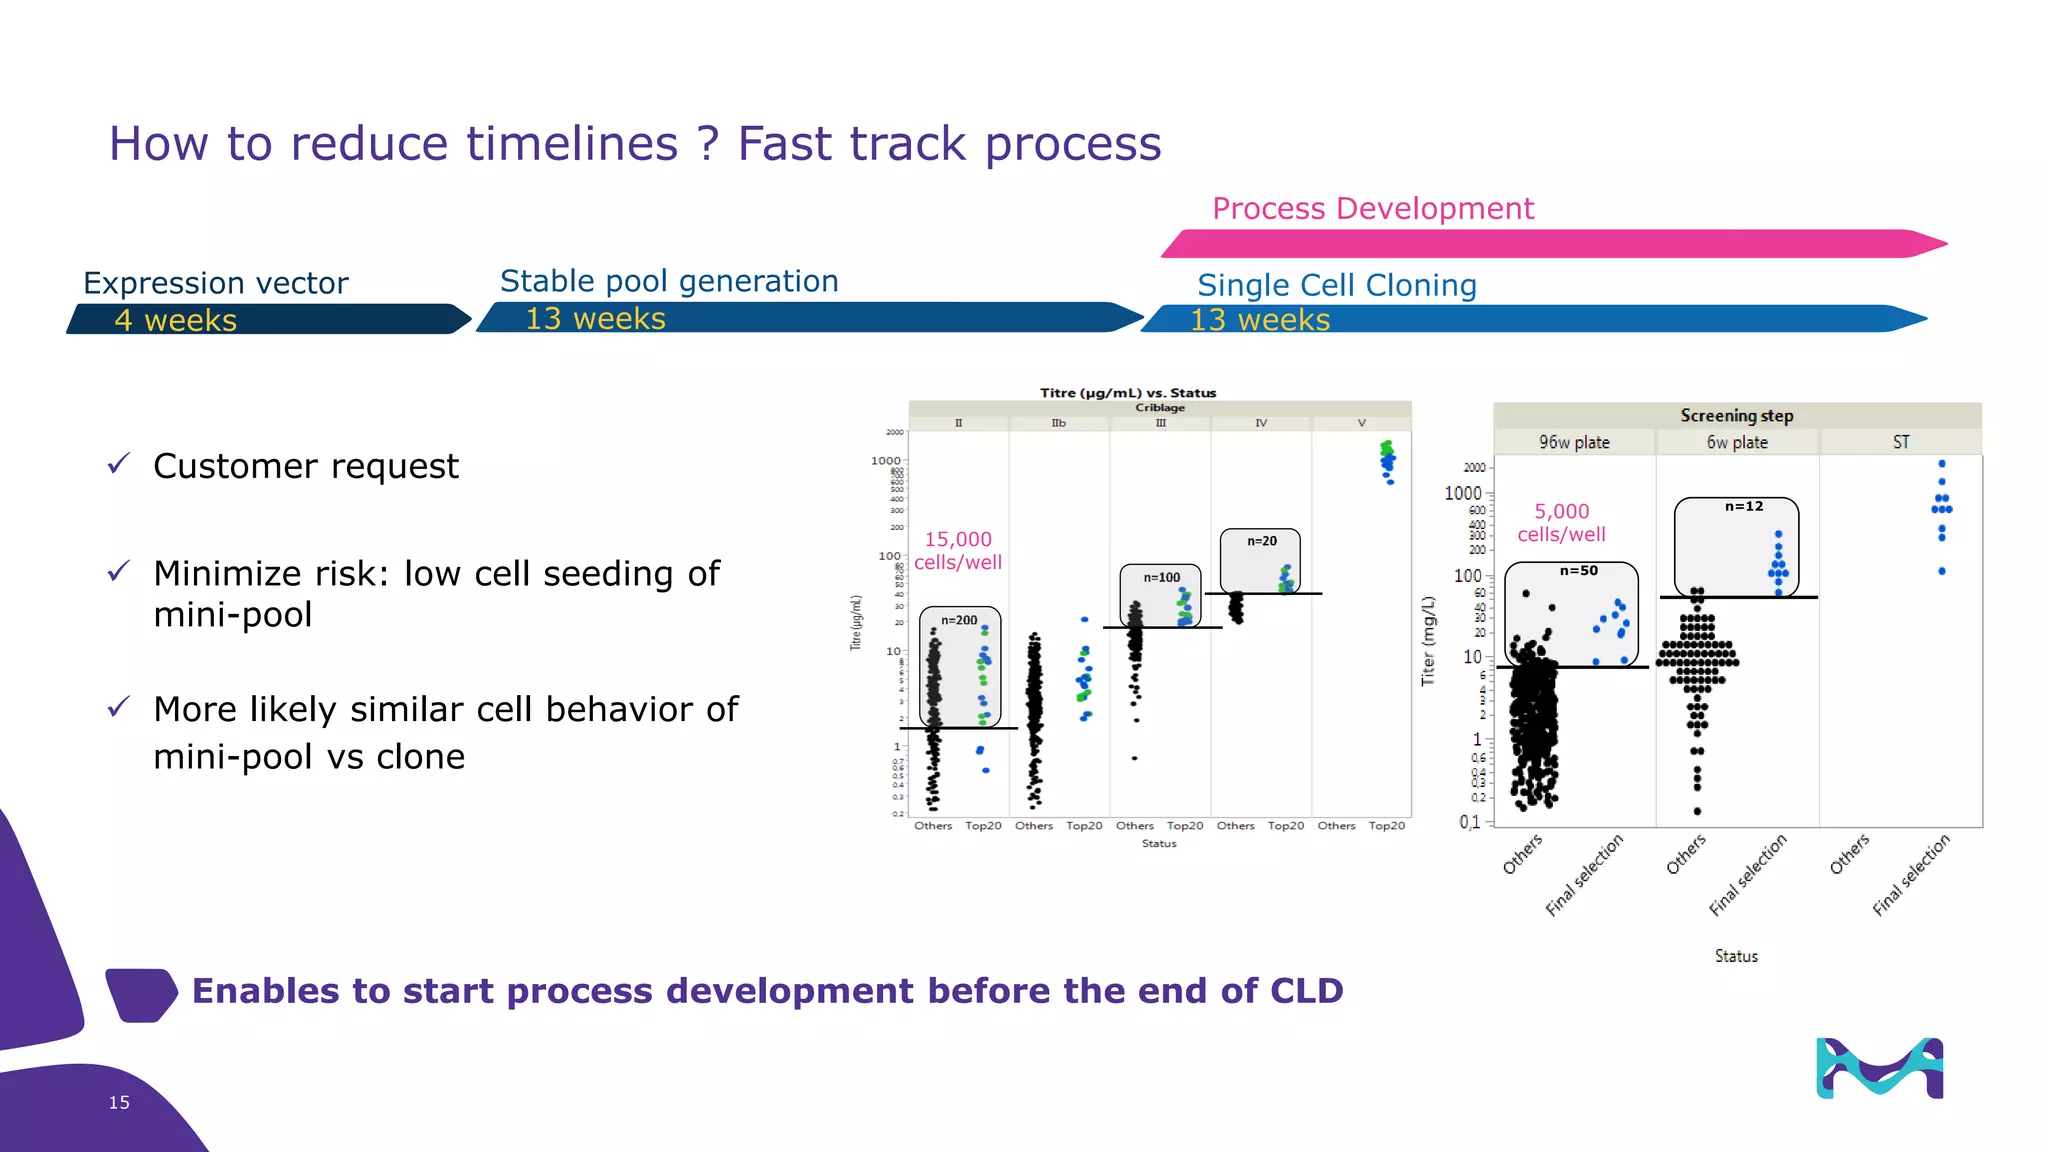
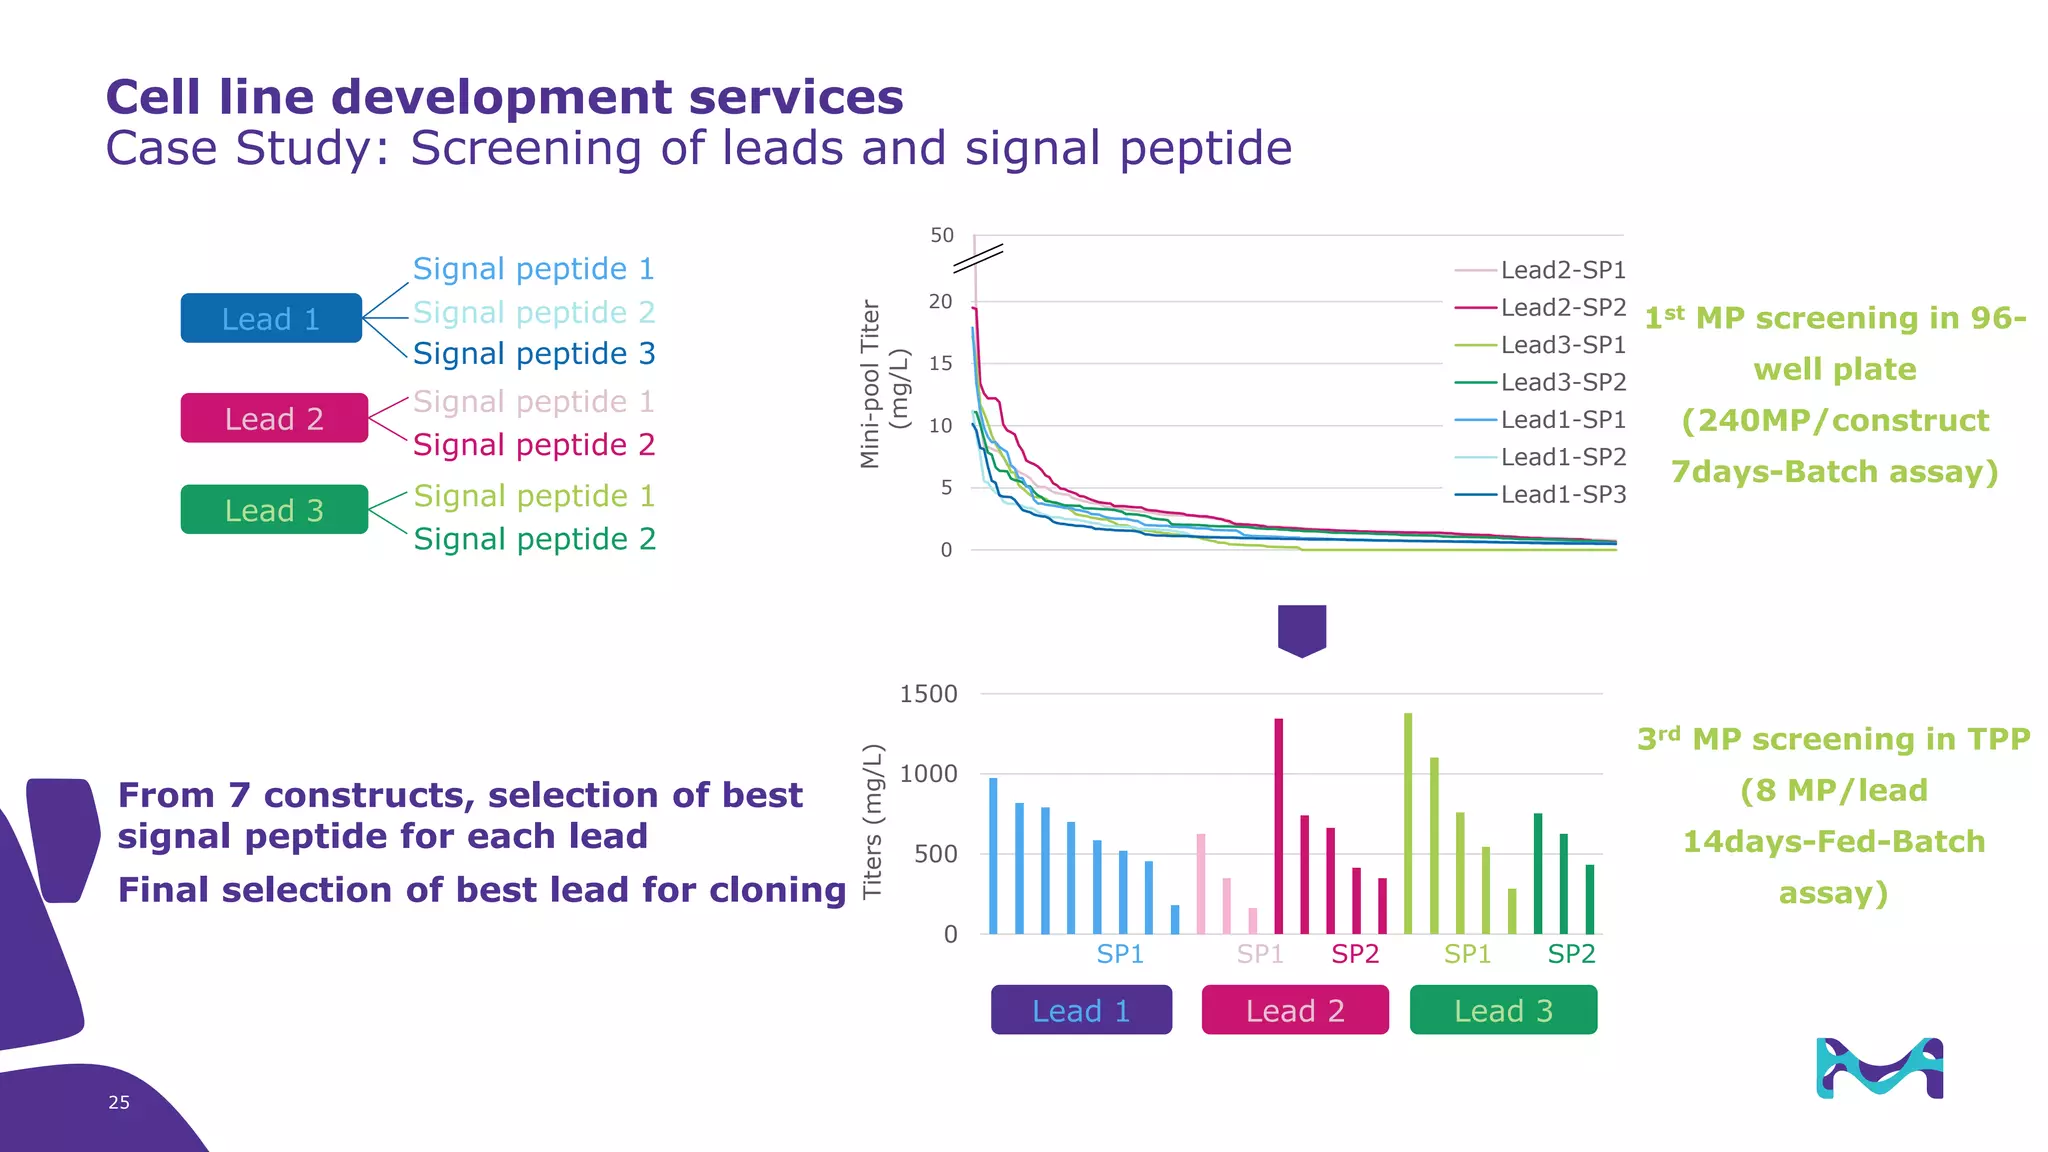
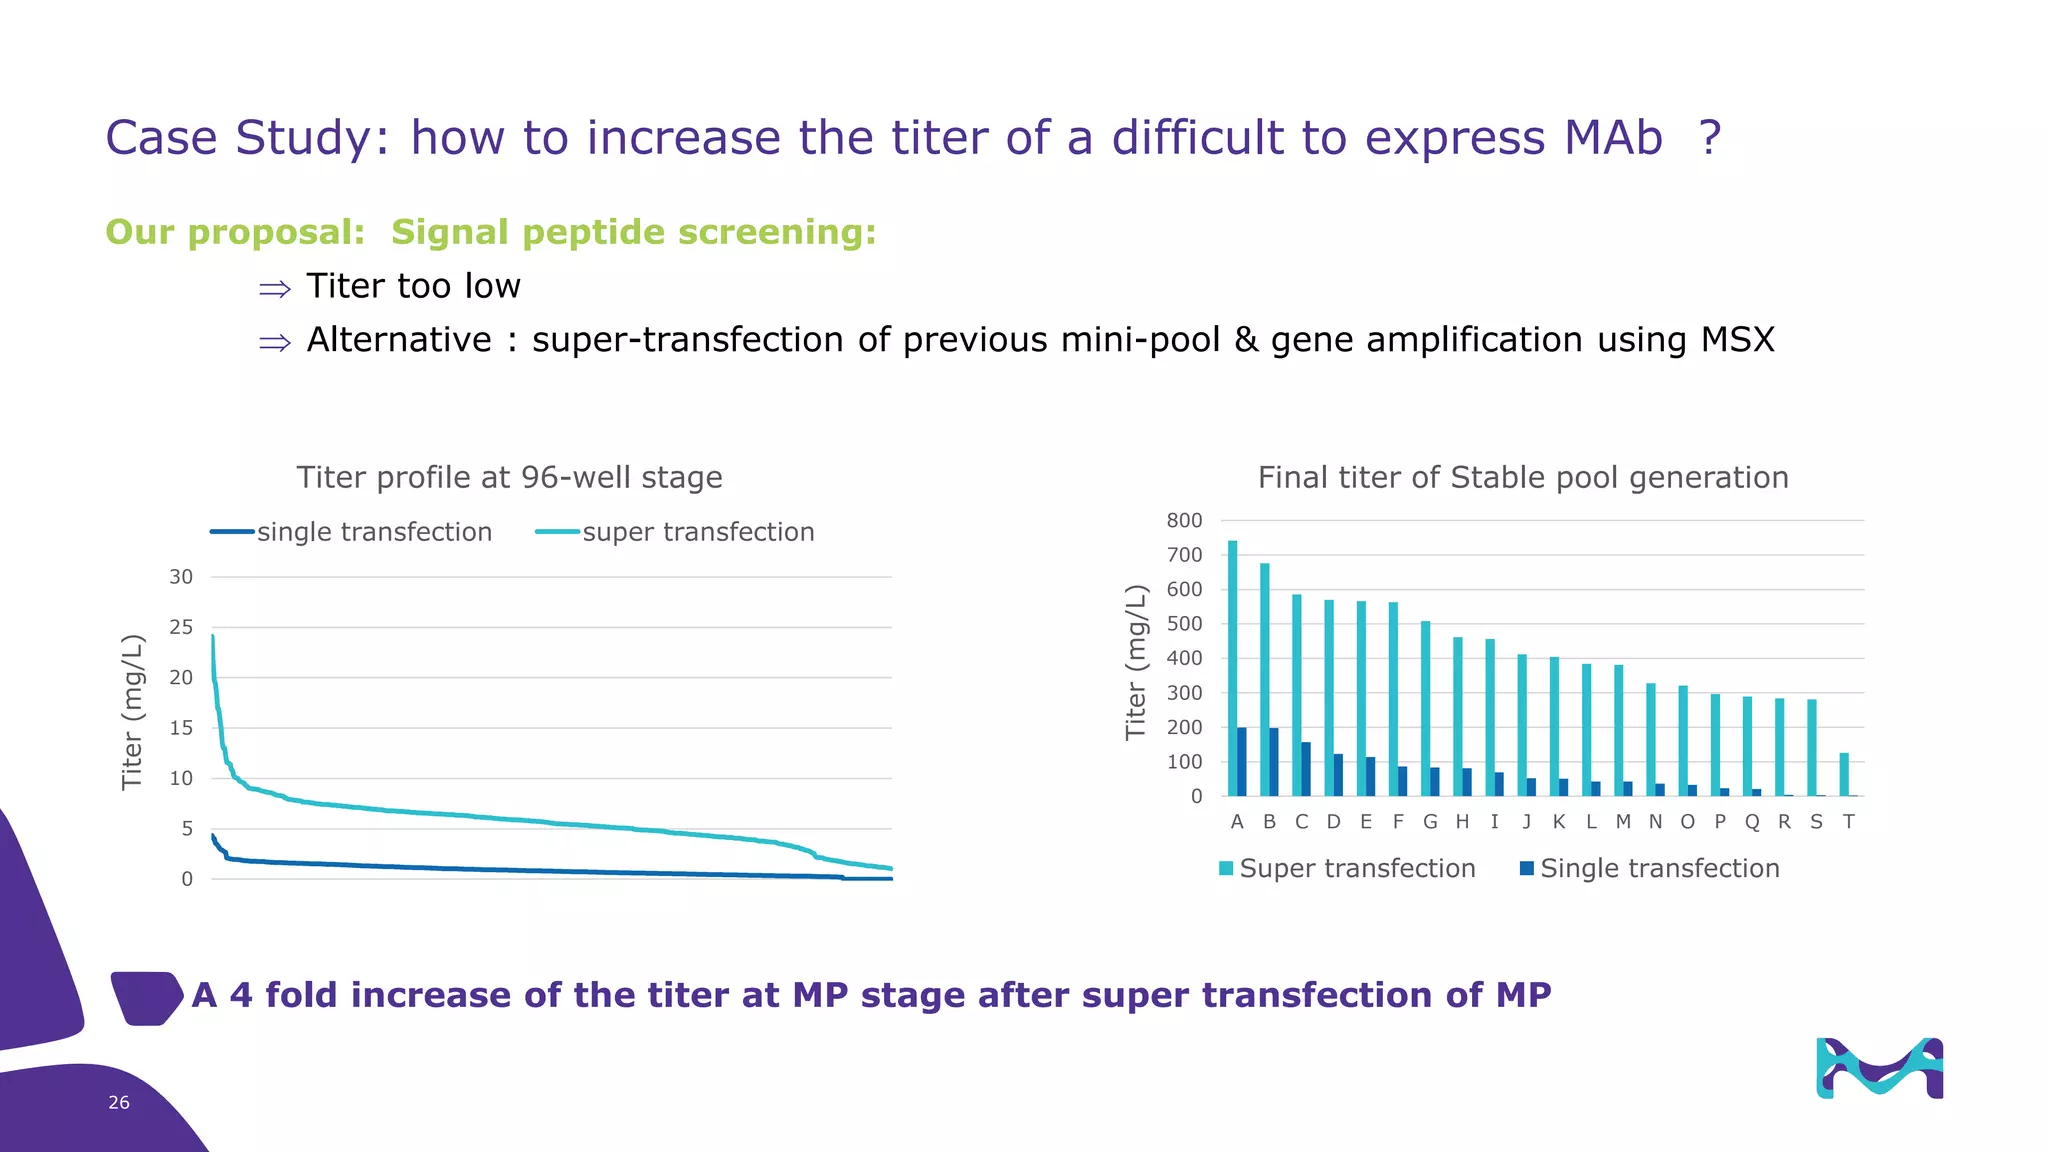
Merck KGaA
Darmstadt, Germany
Sébastien Ribault, PhD
Accelerate
Delivery of
High Producing
Cell Lines
2
The life science business of
Merck KGaA, Darmstadt, Germany
operates as MilliporeSigma
in the U.S. and Canada.
Experience
32 years in PD,
24 in GMP
250+ biologics
70+ Unique GMP
Drug Substance
batches released since
2012
Built our own Single
Use PD/GMP facility in
<1 year
Tech expertise
We are CDMO as well as a
developer & manufacturer
of process technologies
100% Scale up success rate
90% Originator, 10% Biosimilar
65% Fed batch 35% Perfusion
Project Manager
Our experience and expertise ensure quality and efficiency
3
Global resources Locally delivered
Boston, US
Shanghai, China
Bordeaux, France GMP
Wisconsin
St Louis
Glasgow, UK
Rockville
Singapore
Biodevelopment
and production
Antibody-drug conjugate
Product characterization,
Biosafety testing
Cell line development
4
Pre-clinical Phase I Phase II Phase III Commercial
Cell line development
Any mammalian cells
Analytical development
Process development
Templated or customized
GMP Clinical Manufacturing
Single-Use 50 to 2,000 L scale
Facility design, equipment commissioning
Process validation, scale up, TT
Cell banking
Characterization testing Lot Release testing
We are your process development and manufacturing
partner
5
Pre-clinical Phase I Phase II Phase III Commercial
Cell line development
Any mammalian cells
Cell banking
We are your process development and manufacturing
partner
DNA
Construction
Pre MCB Generation Clone Testing MCB
MCB Generation
Characterization
Genetic
Stability Study
Single Cell Cloning and CharacterizationMinipool strategy
Expression
Vector
Construction
4 weeks 13 weeks 13 weeks 13 weeks 27 weeks
✓ Codon
optimization
✓ Cell thawing and
expansion of
Parental cell line
600MP 100MP 20MP 20MP 1000 clones 100 clones 20 clones 20MP
✓ 300 vials
✓ Full characterization
✓ Spin tube
✓ In duplicate
✓ Eq.to 60 PDL
6
Parental Cell
Line
Media and
Feeds
Expression
Vector
Cell Line
Traceability
Protocols
7
CHOZN® GS-/- platform: depleted of GS activity
✓ Original approach of ZN finger technology
✓ No drug selection amplification needed
✓ High clone stability in production processes
CHOZN® GS-/- Program
High, Stable Expression of Therapeutic Proteins
Implemented in our Biodevelopment centers as a generic platform
Platform
improvments
Mini-pool approach for more robustness
9
n=50
n=12
Mini-pool approach associated to 3 screening steps
✓ Reduced the diversity within the transfected pool
✓ Increase the chance to get best performers (min 60MP max 600MP)
Confidence about our process
Longer process and weak predictivity for 96-well plate assay compensated by:
✓ High number of candidate by screening steps
✓ New: threshold establishment at 96-well plate=> Go/No Go at early stage
Mini-pool approach
600 clones 100 clones 20 clones
9
Average Titer
Data compilation based
on 21 MABs CLD project
14
24
62
Lead Pool by titer level (%)
<0,5g/L
0,5<Titer<1g/L
>1g/L
14
71
14
Lead Clone by titer level (%)
<2g/L
2<Titer<4g/L
>4g/L
Robustness: 85% of clone > 2g/L whose 14% > 4g/L
Different projects : standard CLD or coupled with signal peptide screening,
cell type screening, humanization, etc…
12 or 14-days Fed batch assays. 12 or 14-days Fed batch assays.
10
Ensure systematic success?
4 weeks 11 weeks 13 weeks
Expression vector Stable pool generation Single Cell Cloning
4 weeks 2 weeks 7 weeks
Expression vector Stable pool generation Single Cell Cloning
Automation
Process Development
FAST
TRACK
Process Development
12
Automation
 Mab difficult to produce: more plates, while maintaining processing capabilities
 Fast Track: high yield, acceptable reliability
 Speed up cell line construction
High
throughput
technologies
IgG
quantification
Cell sorter
Cell seeder
Multi-culture
system
Cell counter
✓ Incoming assays at 96-well plate stage
✓ Saving time: 13 weeks
✓ Manually impossible
✓ Predictivity improved
✓ Mandatory for HT process
✓ Saving time
✓ Predictivity improved
✓ Set up on going
13
Automation
IncubatorCell Imager
Automatized-
Arm
▪ Semi-automatized process: cell growth monitoring and cell cloning step
▪ Remaining manual handling steps: cell seeding, medium change, productivity assessment
14
How to reduce timelines ? Fast track process
Process Development
✓ Customer request
✓ Minimize risk: low cell seeding of
mini-pool
✓ More likely similar cell behavior of
mini-pool vs clone
15,000
cells/well n=50
n=12
5,000
cells/well
4 weeks 13 weeks 13 weeks
Expression vector Stable pool generation Single Cell Cloning
Enables to start process development before the end of CLD
15
Improvment using molecular tools
Single expression vector for LC and HC integration improved for the cell line
 Screening of endogenous regulatory elements of CHO cells: IL33, DRC7, Ras, H2AJ promoters
 Task force to identify sources of improvements :
cell
protein
vector
Targeted integration
Enhancement of crucial metabolic pathways
Improved media and feeds
16
New Cell Line development platform
Goals :
• Platform Development for recombinant proteins production at lower cost
• IP
Constructs :
CHOZN-K1
17
Objectives: Screening of promoter and enhancer candidates – transient expression/GFP
• 3 CMV enhancers were combined with 7 promoters
• 4 promoters are specific to CHO cell and are temperature inducible
Positive control Negative control
75% of cells remaining
25% of cells with highest GFP expression level
0
0,5
1
1,5
2
2,5
3
3,5
4
4,5
5
GFPexpressionlevel(log)
cell repartition within GFP level expression
Positive response to temperature shift
 Selection of two endogenous promoters responding positively to temperature shift: mRAS and mH2AJ
 Selection of the best viral promoter and enhancer, murine and human origin: IE1
→ Generation of 16 constructs for expression of a Mab
→ Combination of promoters to assess HC and LC expression modulation
Cell repartition within GFP level expression
25% of cells with highest GFP expression level
75% of cells remaining
New Cell Line development platform
hCMV hCMV
hIE1 hIE1
mIE1 mIE1
hCMV Ras
hIE1 Ras
mIE1 Ras
hIE1 H2AJ
mIE1 H2AJ
enhancerpromoter
18
hCMV hCMV
hIE1 hIE1
mIE1 mIE1
hCMV Ras
hIE1 Ras
mIE1 Ras
hIE1 H2AJ
mIE1 H2AJ
Selection of
combinations
for both
expression
cassettes
enhancer promoter
PL62 hIE1 hIE1 HC mIE1 mIE1 LC
PL63 mIE1 mIE1 HC hIE1 hIE1 LC
PL64 hIE1 hIE1 HC mIE1 Ras LC
PL65 mIE1 Ras HC hIE1 hIE1 LC
PL66 hIE1 hIE1 HC mIE1 H2AJ LC
PL67 mIE1 H2AJ HC hIE1 hIE1 LC
PL68 mIE1 H2AJ HC hIE1 Ras LC
PL69 hCMV Ras HC mIE1 H2AJ LC
PL70 mIE1 H2AJ HC hCMV Ras LC
PL71 hIE1 H2AJ HC mIE1 mIE1 LC
PL72 mIE1 mIE1 HC hIE1 H2AJ LC
PL73 mIE1 mIE1 HC hCMV Ras LC
PL74 hCMV Ras HC mIE1 mIE1 LC
PL75 mIE1 Ras HC mIE1 Ras LC
PUROMYCINER 1ST CASSETTE 2ND CASSETTE
Objectives: Screening and selection of the top promoting cassette combination– transient expression/Mab
New Cell Line development platform
19
Objectives: Screening and selection of the top promoting cassette combination – transient expression/Mab
• Assessment in transient expression
• Analysis of Mab expression by cell cytometry (Guava) and by Mab titration (Octet) at 2 time points ( 2 & 6 days)
 The top 4 constructs are confirmed by Guava analysis except for PL67 & PL71
 The best performance (PL75) is obtained with RAS promoter driving both HC and LC expression
 The two challengers combine mIE1 and hIE1
 PL65 combines RAS and IE1
 Expression is improved when a stronger promoter drives LC expression
Negative control
0
1
2
3
4
5
6
0
1
2
3
4
5
6
7
8
9
10
PL75 PL62 PL63 PL65 PL70 PL64 PL68 PL74 PL69 PL66 PL67 PL71 PL72 PL73 PL38 NE
Qp(pg/cell/day)
Titers(mg/L)
Mab expression 48h post electroporation
New Cell Line development platform
20
Objective 1: Assessment of LC and HC positioning in regards of puromycin resistance gene – stable expression Mab
• Assessment by generation of mini-pool using two different MAbs – an easy and a difficult to express
• Test of 16 constructs (8 constructs/molecule)
Objective 2: Endogenous promoter optimization
• Generation of truncated promoter by deletion of 5’ terminal
• Selection based on GFP expression
New Cell Line development platform
21
Screening using 6 days batch culture in 96-well plate at 37°C (results for one of the Mabs)
– stable expression of Mab
0
5
10
15
20
Titre(mg/L)
S210*vHC_vLC
0
5
10
15
20
Titre(mg/L)
S210*eHC_vLC
0
5
10
15
20
Titre(mg/L)
S210*eHC_eLC
0
5
10
15
20
Titre(mg/L)
S210*əHC_eLC
0
5
10
15
20
Titre(mg/L)
S210*vLC_vHC
0
5
10
15
20
Titre(mg/L)
S210*vLC_eHC
0
5
10
15
20
Titre(mg/L)
S210*eLC_eHC
0
5
10
15
20
Titre(mg/L)
S210*eLC_əHC
➢ 80 mini-pools/construct : viral promoter allowed best producers mini-pools
➢ Expression level differed transient expression & stable expression
➢ Very low range of titers for constructs harboring endogenous promoters => eliminated
➢ Selection of 15-20 best mini-pools/construct => 240 mini-pools
New Cell Line development platform
22
➢ Endogenous promoters combinations below viral promoters:
0,70g/L with temperature shift (non optimum process) for S210 Mab
Candidate
New cell line
mini-pool
Competitive CHO
Mab 1 1,7 g/L
Mini-pool:1,51 g/L
Clone: 2,4 g/L
Mab 2 0,6 g/L Pool : 0,076 g/L
✓ Viral promoter based vector
✓ Endogenous promoter vector
➢ Best construct: phIE1*HC_pmIE1*LC
New Cell Line development platform
23
Case studies
Case Study: Screening of leads and signal peptide
Cell line development services
Lead 1
Lead 2
Lead 3
Signal peptide 1
Signal peptide 2
Signal peptide 3
Signal peptide 1
Signal peptide 2
Signal peptide 1
Signal peptide 2
From 7 constructs, selection of best
signal peptide for each lead
Final selection of best lead for cloning
0
500
1000
1500
Titers(mg/L)
SP1 SP1 SP2 SP1 SP2
Lead 1 Lead 2 Lead 3
0
10
20
30
40
50
Mini-poolTiter(mg/L)
Lead2-SP1 Lead2-SP2 Lead3-SP1
Lead3-SP2 Lead1-SP1 Lead1-SP2
0
5
10
15
20
Mini-poolTiter
(mg/L)
Lead2-SP1
Lead2-SP2
Lead3-SP1
Lead3-SP2
Lead1-SP1
Lead1-SP2
Lead1-SP3
3rd MP screening in TPP
(8 MP/lead
14days-Fed-Batch
assay)
1st MP screening in 96-
well plate
(240MP/construct
7days-Batch assay)
25
Case Study: how to increase the titer of a difficult to express MAb ?
Our proposal: Signal peptide screening:
 Titer too low
 Alternative : super-transfection of previous mini-pool & gene amplification using MSX
0
5
10
15
20
25
30
Titer(mg/L)
Titer profile at 96-well stage
single transfection super transfection
0
100
200
300
400
500
600
700
800
A B C D E F G H I J K L M N O P Q R S T
Titer(mg/L)
Final titer of Stable pool generation
Super transfection Single transfection
A 4 fold increase of the titer at MP stage after super transfection of MP
26
oftware
ual
bove predicted value
elow predicted value
0.00031
0.000568
0.000826
0.001084
0.001342
0.0016
1
4.8
8.6
12.4
16.2
20
0
5
10
15
20
25
KLa(hr-1)
A: P/V (W/M3)
B: Vs (m/s)
Design-Expert® Software
Factor Coding: Actual
KLa (hr-1)
Design points above predicted value
Design points below predicted value
34.71
4.07
X1 = A: P/V
X2 = B: Vs
0.000145546
0.000291093
0.000436639
0.000582185
0.000727732
1
4.8
8.6
12.4
16.2
20
0
10
20
30
40
KLa(hr-1)
A: P/V (W/m3)
B: Vs (m/s)
rt® Software
g: Actual
oints above predicted value
oints below predicted value
9.17849E-005
0.00018357
0.000275355
0.000367139
0.000458924
1
4.8
8.6
12.4
16.2
20
0
5
10
15
20
25
30
KLa(hr-1)
A: P/V (W/m3)B: Vs (m/s)
Design-Expert® Software
Factor Coding: Actual
KLa (hr-1)
Design points above predicted value
Design points below predicted value
7.81
2
X1 = A: P/V
X2 = B: Vs
2.26125E-005
3.95718E-005
5.65311E-005
7.34905E-005
9.04498E-005
1
4.8
8.6
12.4
16.2
20
2
3
4
5
6
7
8
9
KLa(hr-1)
A: P/V (W/m3)B: Vs (m/s)
2KL 200L
50L 3L
%CV = 2 – 10,3%
P Value < 0,05
R² in the spécification
KLa = f (P/V ; Vs)
ANOVA
Validation
Sparging and stirring at 2000L scale
Scale-up strategy
27
2
8
SU scale up process performance
0
10
20
30
40
50
0 2 4 6 8 10 12 14 16
VCD(x106cells/mL)
Production Days
VCD
3L (DEVT) 2KL (PROD) 200L (PILOT)
0 2 4 6 8 10 12 14 16
Biacore(g/L)
Production Days
TITER
3L (DEVT) 2KL (PROD) 200L (PILOT)
28
Title of Presentation | DD.MM.YYYY29
Conclusions
30
THANKS
BioReliance® End-to-End Solutions Team
DEVTLS
LAHILLE Aurore
RAYMOND Céline
CORBIN Cyrielle
DEVTLS-BDS Team
AMOURIQ Marine
DREAN Raphaelle
FRANCOIS Charlène
GRINDES Lucie
JUSTINE Clémence
PHILIPPAT Amandine
Merck, BioReliance®, CHOZN and the vibrant M are trademarks of Merck KGaA, Darmstadt, Germany or its affiliates. All other trademarks are the property of
their respective owners. Detailed information on trademarks is available via publicly accessible resources.
© 2018 Merck KGaA, Darmstadt, Germany and/or its affiliates. All Rights Reserved.
ANY QUESTION ?

Accelerate Delivery of High Producing Cell Lines

  • 1.
    Merck KGaA Darmstadt, Germany SébastienRibault, PhD Accelerate Delivery of High Producing Cell Lines
  • 2.
    2 The life sciencebusiness of Merck KGaA, Darmstadt, Germany operates as MilliporeSigma in the U.S. and Canada.
  • 3.
    Experience 32 years inPD, 24 in GMP 250+ biologics 70+ Unique GMP Drug Substance batches released since 2012 Built our own Single Use PD/GMP facility in <1 year Tech expertise We are CDMO as well as a developer & manufacturer of process technologies 100% Scale up success rate 90% Originator, 10% Biosimilar 65% Fed batch 35% Perfusion Project Manager Our experience and expertise ensure quality and efficiency 3
  • 4.
    Global resources Locallydelivered Boston, US Shanghai, China Bordeaux, France GMP Wisconsin St Louis Glasgow, UK Rockville Singapore Biodevelopment and production Antibody-drug conjugate Product characterization, Biosafety testing Cell line development 4
  • 5.
    Pre-clinical Phase IPhase II Phase III Commercial Cell line development Any mammalian cells Analytical development Process development Templated or customized GMP Clinical Manufacturing Single-Use 50 to 2,000 L scale Facility design, equipment commissioning Process validation, scale up, TT Cell banking Characterization testing Lot Release testing We are your process development and manufacturing partner 5
  • 6.
    Pre-clinical Phase IPhase II Phase III Commercial Cell line development Any mammalian cells Cell banking We are your process development and manufacturing partner DNA Construction Pre MCB Generation Clone Testing MCB MCB Generation Characterization Genetic Stability Study Single Cell Cloning and CharacterizationMinipool strategy Expression Vector Construction 4 weeks 13 weeks 13 weeks 13 weeks 27 weeks ✓ Codon optimization ✓ Cell thawing and expansion of Parental cell line 600MP 100MP 20MP 20MP 1000 clones 100 clones 20 clones 20MP ✓ 300 vials ✓ Full characterization ✓ Spin tube ✓ In duplicate ✓ Eq.to 60 PDL 6
  • 7.
    Parental Cell Line Media and Feeds Expression Vector CellLine Traceability Protocols 7 CHOZN® GS-/- platform: depleted of GS activity ✓ Original approach of ZN finger technology ✓ No drug selection amplification needed ✓ High clone stability in production processes CHOZN® GS-/- Program High, Stable Expression of Therapeutic Proteins Implemented in our Biodevelopment centers as a generic platform
  • 8.
  • 9.
    Mini-pool approach formore robustness 9 n=50 n=12 Mini-pool approach associated to 3 screening steps ✓ Reduced the diversity within the transfected pool ✓ Increase the chance to get best performers (min 60MP max 600MP) Confidence about our process Longer process and weak predictivity for 96-well plate assay compensated by: ✓ High number of candidate by screening steps ✓ New: threshold establishment at 96-well plate=> Go/No Go at early stage Mini-pool approach 600 clones 100 clones 20 clones 9
  • 10.
    Average Titer Data compilationbased on 21 MABs CLD project 14 24 62 Lead Pool by titer level (%) <0,5g/L 0,5<Titer<1g/L >1g/L 14 71 14 Lead Clone by titer level (%) <2g/L 2<Titer<4g/L >4g/L Robustness: 85% of clone > 2g/L whose 14% > 4g/L Different projects : standard CLD or coupled with signal peptide screening, cell type screening, humanization, etc… 12 or 14-days Fed batch assays. 12 or 14-days Fed batch assays. 10
  • 11.
  • 12.
    4 weeks 11weeks 13 weeks Expression vector Stable pool generation Single Cell Cloning 4 weeks 2 weeks 7 weeks Expression vector Stable pool generation Single Cell Cloning Automation Process Development FAST TRACK Process Development 12
  • 13.
    Automation  Mab difficultto produce: more plates, while maintaining processing capabilities  Fast Track: high yield, acceptable reliability  Speed up cell line construction High throughput technologies IgG quantification Cell sorter Cell seeder Multi-culture system Cell counter ✓ Incoming assays at 96-well plate stage ✓ Saving time: 13 weeks ✓ Manually impossible ✓ Predictivity improved ✓ Mandatory for HT process ✓ Saving time ✓ Predictivity improved ✓ Set up on going 13
  • 14.
    Automation IncubatorCell Imager Automatized- Arm ▪ Semi-automatizedprocess: cell growth monitoring and cell cloning step ▪ Remaining manual handling steps: cell seeding, medium change, productivity assessment 14
  • 15.
    How to reducetimelines ? Fast track process Process Development ✓ Customer request ✓ Minimize risk: low cell seeding of mini-pool ✓ More likely similar cell behavior of mini-pool vs clone 15,000 cells/well n=50 n=12 5,000 cells/well 4 weeks 13 weeks 13 weeks Expression vector Stable pool generation Single Cell Cloning Enables to start process development before the end of CLD 15
  • 16.
    Improvment using moleculartools Single expression vector for LC and HC integration improved for the cell line  Screening of endogenous regulatory elements of CHO cells: IL33, DRC7, Ras, H2AJ promoters  Task force to identify sources of improvements : cell protein vector Targeted integration Enhancement of crucial metabolic pathways Improved media and feeds 16
  • 17.
    New Cell Linedevelopment platform Goals : • Platform Development for recombinant proteins production at lower cost • IP Constructs : CHOZN-K1 17
  • 18.
    Objectives: Screening ofpromoter and enhancer candidates – transient expression/GFP • 3 CMV enhancers were combined with 7 promoters • 4 promoters are specific to CHO cell and are temperature inducible Positive control Negative control 75% of cells remaining 25% of cells with highest GFP expression level 0 0,5 1 1,5 2 2,5 3 3,5 4 4,5 5 GFPexpressionlevel(log) cell repartition within GFP level expression Positive response to temperature shift  Selection of two endogenous promoters responding positively to temperature shift: mRAS and mH2AJ  Selection of the best viral promoter and enhancer, murine and human origin: IE1 → Generation of 16 constructs for expression of a Mab → Combination of promoters to assess HC and LC expression modulation Cell repartition within GFP level expression 25% of cells with highest GFP expression level 75% of cells remaining New Cell Line development platform hCMV hCMV hIE1 hIE1 mIE1 mIE1 hCMV Ras hIE1 Ras mIE1 Ras hIE1 H2AJ mIE1 H2AJ enhancerpromoter 18
  • 19.
    hCMV hCMV hIE1 hIE1 mIE1mIE1 hCMV Ras hIE1 Ras mIE1 Ras hIE1 H2AJ mIE1 H2AJ Selection of combinations for both expression cassettes enhancer promoter PL62 hIE1 hIE1 HC mIE1 mIE1 LC PL63 mIE1 mIE1 HC hIE1 hIE1 LC PL64 hIE1 hIE1 HC mIE1 Ras LC PL65 mIE1 Ras HC hIE1 hIE1 LC PL66 hIE1 hIE1 HC mIE1 H2AJ LC PL67 mIE1 H2AJ HC hIE1 hIE1 LC PL68 mIE1 H2AJ HC hIE1 Ras LC PL69 hCMV Ras HC mIE1 H2AJ LC PL70 mIE1 H2AJ HC hCMV Ras LC PL71 hIE1 H2AJ HC mIE1 mIE1 LC PL72 mIE1 mIE1 HC hIE1 H2AJ LC PL73 mIE1 mIE1 HC hCMV Ras LC PL74 hCMV Ras HC mIE1 mIE1 LC PL75 mIE1 Ras HC mIE1 Ras LC PUROMYCINER 1ST CASSETTE 2ND CASSETTE Objectives: Screening and selection of the top promoting cassette combination– transient expression/Mab New Cell Line development platform 19
  • 20.
    Objectives: Screening andselection of the top promoting cassette combination – transient expression/Mab • Assessment in transient expression • Analysis of Mab expression by cell cytometry (Guava) and by Mab titration (Octet) at 2 time points ( 2 & 6 days)  The top 4 constructs are confirmed by Guava analysis except for PL67 & PL71  The best performance (PL75) is obtained with RAS promoter driving both HC and LC expression  The two challengers combine mIE1 and hIE1  PL65 combines RAS and IE1  Expression is improved when a stronger promoter drives LC expression Negative control 0 1 2 3 4 5 6 0 1 2 3 4 5 6 7 8 9 10 PL75 PL62 PL63 PL65 PL70 PL64 PL68 PL74 PL69 PL66 PL67 PL71 PL72 PL73 PL38 NE Qp(pg/cell/day) Titers(mg/L) Mab expression 48h post electroporation New Cell Line development platform 20
  • 21.
    Objective 1: Assessmentof LC and HC positioning in regards of puromycin resistance gene – stable expression Mab • Assessment by generation of mini-pool using two different MAbs – an easy and a difficult to express • Test of 16 constructs (8 constructs/molecule) Objective 2: Endogenous promoter optimization • Generation of truncated promoter by deletion of 5’ terminal • Selection based on GFP expression New Cell Line development platform 21
  • 22.
    Screening using 6days batch culture in 96-well plate at 37°C (results for one of the Mabs) – stable expression of Mab 0 5 10 15 20 Titre(mg/L) S210*vHC_vLC 0 5 10 15 20 Titre(mg/L) S210*eHC_vLC 0 5 10 15 20 Titre(mg/L) S210*eHC_eLC 0 5 10 15 20 Titre(mg/L) S210*əHC_eLC 0 5 10 15 20 Titre(mg/L) S210*vLC_vHC 0 5 10 15 20 Titre(mg/L) S210*vLC_eHC 0 5 10 15 20 Titre(mg/L) S210*eLC_eHC 0 5 10 15 20 Titre(mg/L) S210*eLC_əHC ➢ 80 mini-pools/construct : viral promoter allowed best producers mini-pools ➢ Expression level differed transient expression & stable expression ➢ Very low range of titers for constructs harboring endogenous promoters => eliminated ➢ Selection of 15-20 best mini-pools/construct => 240 mini-pools New Cell Line development platform 22
  • 23.
    ➢ Endogenous promoterscombinations below viral promoters: 0,70g/L with temperature shift (non optimum process) for S210 Mab Candidate New cell line mini-pool Competitive CHO Mab 1 1,7 g/L Mini-pool:1,51 g/L Clone: 2,4 g/L Mab 2 0,6 g/L Pool : 0,076 g/L ✓ Viral promoter based vector ✓ Endogenous promoter vector ➢ Best construct: phIE1*HC_pmIE1*LC New Cell Line development platform 23
  • 24.
  • 25.
    Case Study: Screeningof leads and signal peptide Cell line development services Lead 1 Lead 2 Lead 3 Signal peptide 1 Signal peptide 2 Signal peptide 3 Signal peptide 1 Signal peptide 2 Signal peptide 1 Signal peptide 2 From 7 constructs, selection of best signal peptide for each lead Final selection of best lead for cloning 0 500 1000 1500 Titers(mg/L) SP1 SP1 SP2 SP1 SP2 Lead 1 Lead 2 Lead 3 0 10 20 30 40 50 Mini-poolTiter(mg/L) Lead2-SP1 Lead2-SP2 Lead3-SP1 Lead3-SP2 Lead1-SP1 Lead1-SP2 0 5 10 15 20 Mini-poolTiter (mg/L) Lead2-SP1 Lead2-SP2 Lead3-SP1 Lead3-SP2 Lead1-SP1 Lead1-SP2 Lead1-SP3 3rd MP screening in TPP (8 MP/lead 14days-Fed-Batch assay) 1st MP screening in 96- well plate (240MP/construct 7days-Batch assay) 25
  • 26.
    Case Study: howto increase the titer of a difficult to express MAb ? Our proposal: Signal peptide screening:  Titer too low  Alternative : super-transfection of previous mini-pool & gene amplification using MSX 0 5 10 15 20 25 30 Titer(mg/L) Titer profile at 96-well stage single transfection super transfection 0 100 200 300 400 500 600 700 800 A B C D E F G H I J K L M N O P Q R S T Titer(mg/L) Final titer of Stable pool generation Super transfection Single transfection A 4 fold increase of the titer at MP stage after super transfection of MP 26
  • 27.
    oftware ual bove predicted value elowpredicted value 0.00031 0.000568 0.000826 0.001084 0.001342 0.0016 1 4.8 8.6 12.4 16.2 20 0 5 10 15 20 25 KLa(hr-1) A: P/V (W/M3) B: Vs (m/s) Design-Expert® Software Factor Coding: Actual KLa (hr-1) Design points above predicted value Design points below predicted value 34.71 4.07 X1 = A: P/V X2 = B: Vs 0.000145546 0.000291093 0.000436639 0.000582185 0.000727732 1 4.8 8.6 12.4 16.2 20 0 10 20 30 40 KLa(hr-1) A: P/V (W/m3) B: Vs (m/s) rt® Software g: Actual oints above predicted value oints below predicted value 9.17849E-005 0.00018357 0.000275355 0.000367139 0.000458924 1 4.8 8.6 12.4 16.2 20 0 5 10 15 20 25 30 KLa(hr-1) A: P/V (W/m3)B: Vs (m/s) Design-Expert® Software Factor Coding: Actual KLa (hr-1) Design points above predicted value Design points below predicted value 7.81 2 X1 = A: P/V X2 = B: Vs 2.26125E-005 3.95718E-005 5.65311E-005 7.34905E-005 9.04498E-005 1 4.8 8.6 12.4 16.2 20 2 3 4 5 6 7 8 9 KLa(hr-1) A: P/V (W/m3)B: Vs (m/s) 2KL 200L 50L 3L %CV = 2 – 10,3% P Value < 0,05 R² in the spécification KLa = f (P/V ; Vs) ANOVA Validation Sparging and stirring at 2000L scale Scale-up strategy 27
  • 28.
    2 8 SU scale upprocess performance 0 10 20 30 40 50 0 2 4 6 8 10 12 14 16 VCD(x106cells/mL) Production Days VCD 3L (DEVT) 2KL (PROD) 200L (PILOT) 0 2 4 6 8 10 12 14 16 Biacore(g/L) Production Days TITER 3L (DEVT) 2KL (PROD) 200L (PILOT) 28
  • 29.
    Title of Presentation| DD.MM.YYYY29 Conclusions
  • 30.
    30 THANKS BioReliance® End-to-End SolutionsTeam DEVTLS LAHILLE Aurore RAYMOND Céline CORBIN Cyrielle DEVTLS-BDS Team AMOURIQ Marine DREAN Raphaelle FRANCOIS Charlène GRINDES Lucie JUSTINE Clémence PHILIPPAT Amandine
  • 31.
    Merck, BioReliance®, CHOZNand the vibrant M are trademarks of Merck KGaA, Darmstadt, Germany or its affiliates. All other trademarks are the property of their respective owners. Detailed information on trademarks is available via publicly accessible resources. © 2018 Merck KGaA, Darmstadt, Germany and/or its affiliates. All Rights Reserved. ANY QUESTION ?