This document summarizes research validating that growth bands seen in deep sea black corals from the Gulf of Mexico and Southeastern United States are annual. The researchers used several methods to examine the corals including visual counts of growth bands under a scanning electron microscope, measuring iodine and backscattered electron concentrations along the corals, and radiocarbon dating. They concluded that iodine and visual counts are suitable for determining coral growth rates and lifespans, and that iodine measurements can provide a less subjective dating method than visual counts. Ongoing work aims to better understand variability in radiocarbon reservoir ages recorded by the corals.
Validation of deep-sea back (Leiopathes sp.) coral from the Gulf of Mexico and Southeastern United States.
Developed a novel dating method using a trace element (iodine) to determine the life spans and growth rates of deep-sea corals.
Calculated reservoir ages using the iodine developed chronology and radiocarbon analyses for the Gulf of Mexico and Southeastern United States.
AGU 2012 Conference, San Francisco, CA
Student Oral Presenter
• Presented at the American Geophysical Union (AGU) on “Validating Annual Growth Bands of Deep Sea
Corals from the Gulf of Mexico and Southeastern United States”.
This is a pamphlet I made for the Hui Aloha O Kiholo community group in Kona that describes the current findings of research I am conducting at Kiholo Bay.
Abi area in Nigeria borders the salinity enriched
Lower Benue Trough (LBT) and plans are currently
underway to extend large-scale irrigation facilities under
construction in the LBT to Abi area. In order to generate
baseline soil and water salinity information about Abi area
under non-irrigation condition, integrated information from
constrained analyses of vertical electrical sounding data,
two-dimensional electrical resistivity tomographies and
laboratory analyses of soil and water samples were used to
assess and map the spatial salinity distribution. Existence
of widespread heterogeneities in the distribution of soil and
water salinity between the shaly and sandy materials that
dominate the shallow geology of the area was observed.
Minimum values of water electrical conductivity (WEC)
and total dissolved solids (TDS) were observed to be 19.2
lS/cm and 13 mg/L, respectively, in the sandstone-dominated
areas. Maximum values of WEC and TDS were
observed to be 931.0 lS/cm and 624 mg/L, respectively,
within the shale-dominated areas. Soil electrical conductivity
was observed to vary from 5.0 lS/cm in the sandstone
areas to 14.0 lS/cm in the shale-dominated areas.
Minimum and maximum soil pH observations were 4.53 in
the shale-dominated area and 6.55 in the sandstone-dominated
area, respectively. These results show that the water
and soil resources in the area vary from fresh to slightly
saline and non-saline to high salinity levels, respectively.
Consequently, both resources are still good for agricultural
purposes.
Integrated Geophysical Studies Over Parts of Central Cross River State for th...iosrjce
A total of 71 Vertical Electrical Soundings were carried out using Schlumberger electrode
configuration for the evaluation of groundwater potential in parts of central Cross River State, Nigeria.
Interpretation of data showed three to six geoelectric layers. Productive shallow and deep aquifer zones were
identified at depths of 60 m and 150 m respectively, corresponding to a resistivity range of 100-500 Ωm for
shallow aquifers and 1000-2500 Ωm for deep aquifers respectively. The lithologic data of the aquifers revealed
sand/sandstone and very coarsed grained sand/fractured basement, respectively. Seismic refraction survey was
also carried out within the same study area for the foundation study of rocks. The studies revealed an average
thickness of 4.5 m (probably sand/clay) and 10.0 m (probably gravelly sand/shale) for the first and second
layers respectively. The range of velocities for the first three layers are 602 m/s to 960 m/s, 378 m/s to 2,424 m/s
and 1,587 m/s to 5,368 m/s, respectively, indicating that the soils in the area are not homogeneous. It is inferred
from the relative high values of calculated elastic constants in most of the locations, that the soils are well
consolidated and as such suitable for large engineering construction in such locations, while in the rest of the
locations the soils are considered unconsolidated and unsuitable for large construction work due to the relative
low values of the elastic constants.
Changes in game harvest composition, southeastern Cameroon: A potential indic...Fundsi88
Presentation by Hirokazu Yasuoka at the symposium, "Innovative ways for conserving the ecosystem services provided by bushmeat" in the 51th Annual Meeting ATBC 2014 in Cairns, Australia.
Eight Vertical Electrical Sounding surveys were carried out in Abua town in Rivers State, Nigeria to determine the depth to shallow aquifers suitable for borehole drilling for groundwater use in the town. The Schlumberger array method was employed with current electrode spread of 200 m to 600 m and the corresponding electric current and voltage measured. The apparent resistivity was obtained and plotted against half the current electrode spread with the aid of an IPWIN 12 software to obtain the field curves which were interpreted in terms of resistivity, thickness and depth of occurrence. The results revealed two to four geoelectric sections with resistivity values of 8.29 Ω to 777 Ω. The maximum depth penetrated was 56.5 m with the maximum current electrode spread used. A shallow aquifer close to the surface at Omelema waterside was observed with a thickness of 49 m. The abnormal resistivity value of this zone indicates that it was probably contaminated by saline water intrusion. At Abua LGA site, a shallow aquifer was also observed at a depth of 7.86 m. At the dump site, the shallow aquifer was contaminated by leachates while at Omelema primary school site the result revealed unconsolidated sediments. The results for Abua Amp site and Rghom site also revealed shallow aquifers at depths of 4 m and 6 m respectively.
Coral population dynamics across consecutive massmortality e.docxvanesaburnand
Coral population dynamics across consecutive mass
mortality events
B E R N H A R D R I E G L and SAM PURKIS
National Coral Reef Institute, Nova Southeastern University, 8000 N Ocean Drive, Dania, FL 33004, USA
Abstract
Annual coral mortality events due to increased atmospheric heat may occur regularly from the middle of the century
and are considered apocalyptic for coral reefs. In the Arabian/Persian Gulf, this situation has already occurred and
population dynamics of four widespread corals (Acropora downingi, Porites harrisoni, Dipsastrea pallida, Cyphastrea
micropthalma) were examined across the first-ever occurrence of four back-to-back mass mortality events (2009–2012).
Mortality was driven by diseases in 2009, bleaching and subsequent diseases in 2010/2011/2012. 2009 reduced P. har-
risoni cover and size, the other events increasingly reduced overall cover (2009: �10%; 2010: �20%; 2011: �20%; 2012:
�15%) and affected all examined species. Regeneration was only observed after the first disturbance. P. harrisoni and
A. downingi severely declined from 2010 due to bleaching and subsequent white syndromes, while D. pallida and
P. daedalea declined from 2011 due to bleaching and black-band disease. C. microphthalma cover was not affected. In
all species, most large corals were lost while fission due to partial tissue mortality bolstered small size classes. This
general shrinkage led to a decrease of coral cover and a dramatic reduction of fecundity. Transition matrices for dis-
turbed and undisturbed conditions were evaluated as Life Table Response Experiment and showed that C. microph-
thalma changed the least in size-class dynamics and fecundity, suggesting they were ‘winners’. In an ordered
‘degradation cascade’, impacts decreased from the most common to the least common species, leading to step-wise
removal of previously dominant species. A potentially permanent shift from high- to low-coral cover with different
coral community and size structure can be expected due to the demographic dynamics resultant from the distur-
bances. Similarities to degradation of other Caribbean and Pacific reefs are discussed. As comparable environmental
conditions and mortality patterns must be expected worldwide, demographic collapse of many other coral popula-
tions may soon be widespread.
Keywords: climate change, coral reef, demographics, mass mortality, population dynamics
Received 13 March 2015; revised version received 26 May 2015 and accepted 29 May 2015
Introduction
Coral reefs are among the most sensitive ecosystems to
excursions from mean environmental conditions, such
as temperature, UV irradiation, and nutrient levels and
suffer heavy mortality from consequent bleaching and
diseases (Hoegh-Guldberg et al., 2007; Selig et al., 2010;
Wiedenmann et al., 2013; D’Angelo & Wiedenmann,
2014; Riegl et al., 2015). Rising global temperatures and
alterations in nutrient dynamics are predicted to fur-
ther increase the frequenc.
AGU 2012 Conference, San Francisco, CA
Student Oral Presenter
• Presented at the American Geophysical Union (AGU) on “Validating Annual Growth Bands of Deep Sea
Corals from the Gulf of Mexico and Southeastern United States”.
AAG 2013 Conference, Los Angeles, CA
Student Poster Presenter
• Presented research findings at the Association of American Geographers (AAG) on “Validating Annual
Growth Bands of Deep Sea Corals from the Gulf of Mexico and Southeastern United States”.
Auckland Volcanic Field Olivine Research Poster for AGU Fall 2013_Smidelainesmid
This poster was presented at the American Geophysical Union's Fall 2013 scientific conference. It describes research results from chemical analyses of olivine minerals found in the deposits of the Auckland Volcanic Field, New Zealand. This research is a part of the publicly-funded DEtermining VOlcanic Risk in Auckland project.
Considering the importance of the healthy coral reef ecosystems to Langkawi’s economy as well as to the global coral reef biodiversity, the present study provided the baseline database regarding on distribution of heavy metals concentration (Cd, Cu, Pb) and the trend of heavy metals accumulation in Diploria Labyrinthiformis and Favia Pallida corals at Pulau Langkawi region. This report showed the level of heavy metal contamination in each of 5 years growth rate bands in both coral specie susing AAS. The averages of heavy metals concentration in Diploria Labyrinthiformis were 0.018±0.002 mg/L, 0.044±0.11 mg/L, and 0.120±0.01 mg/L for Cd, Cu, and Pb respectively. Meanwhile the concentrations of heavy metals for Favia Pallida were 0.017±0.02 mg/L, 0.088±0.004 mg/L, and 0.218±0.14 mg/L for Cd, Cu, and Pb respectively. Both species showed the low concentration and not exceeding the MPI safety level that indicated that the corals were not impacted by pollution. The trend and correlationships of the Cd, Cu, and Pb in the bands coral slab showed the increasing trend of concentration which were increased gradually from the surface (youngest) to bottom (oldest) layer for the samples.
Geological interpretation of a low-backscatter anomaly found on the New Jerse...Larry Mayer
An enigmatic low-backscatter, acoustic anomaly occurs on the New Jersey continental margin between Hudson and Wilmington Canyon channels. The presence of the low-backscatter anomaly, as seen with 6.5- and 12-kHz data, indicates a change in the physical properties of the seafloor or near sub-surface. Analyses of seafloor and sub-surface acoustic data with previously collected sediment cores suggest the low-backscatter feature corresponds to an outcrop of older strata uncovered by erosion and non-deposition by the Western Boundary Undercurrent (WBUC). The decrease in backscatter strength is enhanced by the presence of gas in the sub-surface sediments found in the buried Chesapeake Drift.
1.
Validating Annual Growth Bands of Deep Sea Black Corals from the
Gulf of Mexico and Southeastern United States
Leslye Mohon (lmohon@neo.tamu.edu)1, E. Brendan Roark1, Renald Guillemetter2, Nancy Prouty3, Steve Ross4
Deep-‐sea
black
corals
have
the
poten2al
to
be
u2lized
as
a
proxy
record
of
historical
and
biogeochemical
changes
in
worlds
oceans
(Williams
et
al.
2006).
These
black
corals
(Leiopathes
sp.)
grow
in
a
tree
like
fashion
by
deposi2ng
poten2al
annual
growth
bands.
By
valida2ng
that
growth
bands
are
in
fact
annual,
the
ages
and
growth
rates
of
black
corals
from
the
Gulf
of
Mexico
and
Southeastern
United
Stated
(SEUS)
can
be
determined.
Iodine
concentra2on
in
black
corals
also
have
the
poten2al
to
be
used
as
a
new
da2ng
method
to
determine
the
lifespan
and
growth
rates
of
black
corals.
When
the
iodine
chronology
is
combined
with
radiocarbon
measurements,
con2nuous
records
of
ocean
ven2la2on
changes
are
possible.
Introduc)on
Visual
Counts
• Scanning
electron
microscope
(SEM)
was
used
to
develop
images
(900x)
that
shows
growth
bands.
Iodine
and
BSE
Counts
• The
number
of
backscaPer
electrons
(BSE)
reaching
the
detector
is
propor2onal
to
the
mean
atomic
number
of
the
sample.
• Iodine
and
BSE
were
measured
along
radial
transects
using
the
SEM
at
1
µm
spot
intervals.
Figure
2.
Prouty
et
al.,
(2011)
analyzed
black
corals
(GOM-‐JSL04-‐4734-‐BC1)
by
o b s e r v i n g
s c a n n i n g
e l e c t r o n
microscope
(SEM)
40x
images
and
counted
an
average
age
of
576
bands
c o m p a r e d
t o
t h e
c a l c u l a t e d
radiocarbon
derived
life
span
of
670
±40
yrs.
The
USGS
Terrestrial,
Marine,
and
Freshwater
Environments-‐Outer
Con2nental
Shelf
Ecosystem
Program
and
USGS
Coastal
and
Marine
Geology
Program
and
a
grant
to
EBR
from
The
Norman
Hackerman
Advanced
Research
Program
supported
this
work.
Acknowledgments
§ Confident
that
the
growth
bands
in
black
corals
are
indeed
annual.
§ Iodine
and
visual
counts
along
with
BSE
are
suitable
methods
to
calculate
growth
rates
and
life
spans
of
black
corals
§ Ongoing
research
will
replicate
and
validate
reservoir
ages
to
account
for
the
variability
in
ocean
circula2on.
Conclusions
Figure
4.
This
is
an
SEM
image
of
a
black
coral
with
iodine
and
BSE
counts
overlaid
on
top.
This
shows
that
Iodine
along
with
BSE
match
the
visual
growth
bands.
When
conduc2ng
visual
counts,
different
observers
will
have
different
defini2on
of
what
is
a
growth
band
so
iodine
may
serve
as
a
less
subjec2ve
da2ng
method.
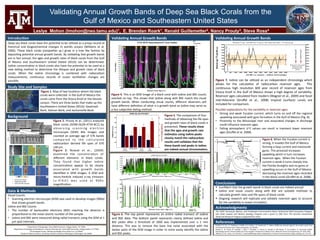
Figure
6.
The
top
panel
represents
an
en2re
radial
transect
of
iodine
and
BSE
data.
The
boPom
panel
represents
clearly
defined
iodine
and
BSE
peaks
ader
a
threshold
of
1000
was
implemented
over
a
1
mm
distance.
This
was
to
remove
the
base
line
noise
associated
with
the
darker
parts
of
the
SEM
image
in
order
to
more
easily
iden2fy
the
iodine
and
BSE
peaks.
Study
Site
and
Samples
Figure
7.
Iodine
can
be
u2lized
as
an
independent
chronology
which
allows
for
the
calcula2on
of
radiocarbon
reservoir
ages.
This
con2nuous
high
resolu2on
600
year
record
of
reservoir
ages
from
Viosca
Knoll
in
the
Gulf
of
Mexico
shows
a
high
degree
of
variability.
Reservoir
ages
calculated
from
modern
(Wagner
et
al.,
2009)
and
fossil
mid-‐Holocene
(Druffel
et
al.,
2008)
tropical
(surface)
corals
are
included
for
comparison.
Possible
explana2ons
for
the
variability
in
reservoir
ages:
• Strong
and
weak
Yucatan
current,
which
turns
on
and
off
the
regional
upwelling
associated
with
gyre
forma2on
in
the
Gulf
of
Mexico
(Fig.
8).
• Proximity
to
the
Mississippi
river
and
associated
changes
in
discharge
could
influence
reservoir
ages.
• Falling
atmospheric
∆14C
values
can
result
in
transient
lower
reservoir
ages
(Druffel
et
al.
2008).
• 250
µm
by
250
µm
• Magnified
by
900x
• SEM
and
PIXIE
analyses
Figure
3.
Nowak
et
al.,
(2009)
examined
the
concentra2on
of
different
elements
in
black
corals.
They
found
that
higher
iodine
concentra2ons
appear
to
be
closely
associated
with
growth
bands
iden2fied
in
SEM
images.
A
SEM
and
micro-‐Par2cle
induced
x-‐ray
Emission
( u -‐ P I X I E )
w a s
u s e d
a t
9 0 0 x
magnifica2on.
Figure
1.
Map
of
two
loca2ons
where
the
black
corals
were
collected.
In
the
Gulf
of
Mexico
the
corals
came
from
the
Viosca
Knoll
or
the
Desoto
canyon.
There
are
three
banks
that
make
up
the
Southeastern
United
States
(SEUS):
Savannah
Bank,
Stetson
Bank,
and
Jacksonville
Bank.
Valida)ng
Annual
Growth
Bands
Data
&
Methods
Figure
5.
The
comparison
of
four
methods
of
obtaining
the
life
span
and
growth
rates
of
black
corals
is
presented.
These
results
show
that
the
ages
and
growth
rate
es)mates
using
iodine
peaks
closely
match
the
radiocarbon
results
and
validates
that
the
these
bands
and
peaks
in
iodine
are
indeed
annual
chronometers.
GOM-JSL04-4734-BC1
1
Department
of
Geography,
Texas
A&M
University,
College
Sta2on,
TX
77840
2Department
of
Geology
and
Geophysics,
Electron
Microbe
Lab,
Texas
A&M
University,
College
Sta2on,
TX
77840
3US
Geological
Survey,
400
Natural
Bridges
Drive
Santa
Cruz,
CA
95060
4Center
for
Marine
Science,
University
of
North
Carolina
at
Wilmington,
Wilmington,
NC
28409
Figure
8.
When
the
Yucatan
current
is
strong,
it
invades
the
Gulf
of
Mexico
forming
a
loop
current
and
mesoscale
gyres.
This
process0
increases
upwelling
which
in
turn
increases
reservoir
ages.
When
the
Yucatan
current
is
weak
it
turns
sharply
into
the
Florida
Straights
and
no
gyres
or
upwelling
occurs
in
the
Gulf
of
Mexico
decreasing
the
reservoir
ages
recorded
in
the
black
corals
(Druffel
et
al.
2008).
Druffel,
E.
R.
M.,
L.
F.
Robinson,
S.
Griffin,
R.
B.
Halley,
J.
R.
Southon
&
J.
F.
Adkins
(2008)
Low
reservoir
ages
for
the
surface
ocean
from
mid-‐Holocene
Florida
corals.
Paleoceanography,
23,
PA2209.
Nowak,
D.,
M.
Florek,
W.
Kwiatek,
J.
Lekki,
P.
Chevallier,
A.
Hacura,
R.
Wrzalik,
B.
Ben-‐Nissan,
R.
Van
Grieken,
A.
Kuczumow
(2009).
Morphology
and
the
Chemical
Make-‐Up
of
the
Inorganic
Components
of
Black
Corals.
Materials
Science
and
Engineering,
29,
1029-‐1038.
Williams,
B.,
M.
J.
Risk,
S.
W.
Ross
&
K.
J.
Sulak
(2006)
Deep-‐water
an2patharians:
Proxies
of
environmental
change.
Geology,
34,
773-‐776
References
Measured 14C age – IntCal09 Atm 14C age (yrs. BP –Iodine age model) = 14C reservoir age
Background
Valida)ng
Annual
Growth
Bands