Swan(sea) Song – personal research during my six years at Swansea ... and bey...
Aa19213 12
1. A&A 541, L9 (2012) Astronomy
DOI: 10.1051/0004-6361/201219213 &
c ESO 2012 Astrophysics
Letter to the Editor
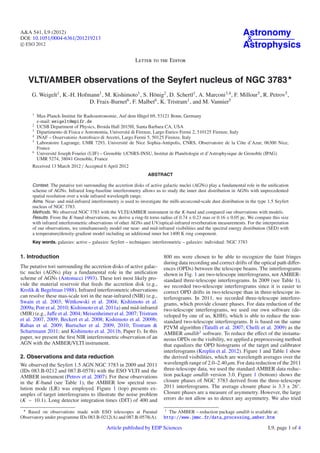
VLTI/AMBER observations of the Seyfert nucleus of NGC 3783
G. Weigelt1 , K.-H. Hofmann1 , M. Kishimoto1 , S. Hönig2 , D. Schertl1 , A. Marconi3,4 , F. Millour5 , R. Petrov5 ,
D. Fraix-Burnet6 , F. Malbet6 , K. Tristram1 , and M. Vannier5
1
Max-Planck-Institut für Radioastronomie, Auf dem Hügel 69, 53121 Bonn, Germany
e-mail: weigelt@mpifr.de
2
UCSB Department of Physics, Broida Hall 2015H, Santa Barbara CA, USA
3
Dipartimento di Fisica e Astronomia, Universitá di Firenze, Largo Enrico Fermi 2, 510125 Firenze, Italy
4
INAF – Osservatorio Astrofisico di Arcetri, Largo Fermi 5, 50125 Firenze, Italy
5
Laboratoire Lagrange, UMR 7293, Université de Nice Sophia-Antipolis, CNRS, Observatoire de la Côte d’Azur, 06300 Nice,
France
6
Université Joseph Fourier (UJF) – Grenoble 1/CNRS-INSU, Institut de Planétologie et d’Astrophysique de Grenoble (IPAG)
UMR 5274, 38041 Grenoble, France
Received 13 March 2012 / Accepted 6 April 2012
ABSTRACT
Context. The putative tori surrounding the accretion disks of active galactic nuclei (AGNs) play a fundamental role in the unification
scheme of AGNs. Infrared long-baseline interferometry allows us to study the inner dust distribution in AGNs with unprecedented
spatial resolution over a wide infrared wavelength range.
Aims. Near- and mid-infrared interferometry is used to investigate the milli-arcsecond-scale dust distribution in the type 1.5 Seyfert
nucleus of NGC 3783.
Methods. We observed NGC 3783 with the VLTI/AMBER instrument in the K-band and compared our observations with models.
Results. From the K-band observations, we derive a ring-fit torus radius of 0.74 ± 0.23 mas or 0.16 ± 0.05 pc. We compare this size
with infrared interferometric observations of other AGNs and UV/optical-infrared reverberation measurements. For the interpretation
of our observations, we simultaneously model our near- and mid-infrared visibilities and the spectral energy distribution (SED) with
a temperature/density-gradient model including an additional inner hot 1400 K ring component.
Key words. galaxies: active – galaxies: Seyfert – techniques: interferometric – galaxies: individual: NGC 3783
1. Introduction 800 ms were chosen to be able to recognize the faint fringes
during data recording and correct drifts of the optical path differ-
The putative tori surrounding the accretion disks of active galac- ences (OPDs) between the telescope beams. The interferograms
tic nuclei (AGNs) play a fundamental role in the unification shown in Fig. 1 are two-telescope interferograms, not AMBER-
scheme of AGNs (Antonucci 1993). These tori most likely pro- standard three-telescope interferograms. In 2009 (see Table 1),
vide the material reservoir that feeds the accretion disk (e.g., we recorded two-telescope interferograms since it is easier to
Krolik & Begelman 1988). Infrared interferometric observations correct OPD drifts in two-telescope than in three-telescope in-
can resolve these mas-scale tori in the near-infrared (NIR) (e.g., terferograms. In 2011, we recorded three-telescope interfero-
Swain et al. 2003; Wittkowski et al. 2004; Kishimoto et al. grams, which provide closure phases. For data reduction of the
2009a; Pott et al. 2010; Kishimoto et al. 2011a) and mid-infrared two-telescope interferograms, we used our own software (de-
(MIR) (e.g., Jaffe et al. 2004; Meisenheimer et al. 2007; Tristram veloped by one of us, KHH), which is able to reduce the non-
et al. 2007, 2009; Beckert et al. 2008; Kishimoto et al. 2009b; standard two-telescope interferograms. It is based on the same
Raban et al. 2009; Burtscher et al. 2009, 2010; Tristram & P2VM algorithm (Tatulli et al. 2007; Chelli et al. 2009) as the
Schartmann 2011; and Kishimoto et al. 2011b, Paper I). In this AMBER amdlib1 software. To reduce the effect of the instanta-
paper, we present the first NIR interferometric observation of an neous OPDs on the visibility, we applied a preprocessing method
AGN with the AMBER/VLTI instrument. that equalizes the OPD histograms of the target and calibrator
interferograms (Kreplin et al. 2012). Figure 1 and Table 1 show
2. Observations and data reduction the derived visibilities, which are wavelength averages over the
We observed the Seyfert 1.5 AGN NGC 3783 in 2009 and 2011 wavelength range of 2.0–2.40 μm. For data reduction of the 2011
(IDs 083.B-0212 and 087.B-0578) with the ESO VLTI and the three-telescope data, we used the standard AMBER data reduc-
AMBER instrument (Petrov et al. 2007). For these observations tion package amdlib version 3.0. Figure 1 (bottom) shows the
in the K-band (see Table 1), the AMBER low spectral reso- closure phases of NGC 3783 derived from the three-telescope
lution mode (LR) was employed. Figure 1 (top) presents ex- 2011 interferograms. The average closure phase is 3.3 ± 26◦ .
amples of target interferograms to illustrate the noise problem Closure phases are a measure of asymmetry. However, the large
(K ∼ 10.1). Long detector integration times (DIT) of 400 and errors do not allow us to detect any asymmetry. We also tried
1
Based on observations made with ESO telescopes at Paranal The AMBER – reduction package amdlib is available at:
Observatory under programme IDs 083.B-0212(A) and 087.B-0578(A). http://www.jmmc.fr/data_processing_amber.htm
Article published by EDP Sciences L9, page 1 of 4
2. A&A 541, L9 (2012)
Table 1. Observation log of our AMBER LR observations of NGC 3783 and its calibrator CD-37 7391.
Name Date Time of Telescopes/ PA DIT Seeing Number Target
observation proj. baseline (◦ ) (ms) (arcsec) of frames visibility
(UTC) lengths (m)
NGC 3783 09/04/14 01:19–01:31 UT2-3/46.6 28.8 800 0.93 11 × 70 0.89
CD-37 7391 09/04/14 01:45–01:55 UT2-3 800 0.84 10
NGC 3783 09/04/14 03:16–03:29 UT2-3/45.2 44.8 800 0.82 11 × 70 0.96
NGC 3783 09/04/14 03:32–03:41 UT2-3/44.8 46.3 400 0.79 10 × 70 0.93
CD-37 7391 09/04/14 04:31–04:34 UT2-3 400 0.78 4 × 120
NGC 3783 09/04/14 03:52–04:03 UT3-4/62.0 120.9 800 0.68 10 × 70 0.97
CD-37 7391 09/04/14 02:11–02:16 UT3-4 800 1.45 5 × 70
CD-37 7391 09/04/14 02:00–02:05 UT2-4 800 0.99 5 × 120
NGC 3783 09/04/14 03:44–03:49 UT2-4/87.1 90.0 800 0.72 5 × 70 0.86
NGC 3783 09/04/14 04:12–04:20 UT2-4/84.6 94.7 800 0.81 8 × 70 0.85
CD-37 7391 09/04/14 04:41–04:45 UT2-4 800 0.87 3 × 120
NGC 3783 11/05/18 02:39–02:44 UT1-2-4/51.2/113.8/80.3 38.8/77.3/100.7 400 0.63 7 × 120
NGC 3783 11/05/18 02:50–02:55 UT1-2-4/50.6/111.2/78.7 39.8/78.9/102.8 400 0.68 7 × 120
CD-37 7391 11/05/18 02:00–02:06 UT1-2-4/ 400 0.75 7 × 120
CD-37 7391 11/05/18 02:09–02:17 UT1-2-4/ 400 0.63 7 × 120
Notes. The data in the first 11 lines were observed in the two-telescope mode and the data in the last 4 lines in the three-telescope mode. The
table lists the names, times of observations, projected baseline lengths, position angles PA, detector integration times DIT, seeing, number of
interferograms, and derived target visibilities (errors ±0.09).
Table 2. NGC 3783 torus radius Rtorus , 2MASS fluxes of the nuclear core, and flux contributions of the host galaxy and the AD.
J flux H flux K flux J H K Host AD Rtorus Rtorus RτK c
(mJy) (mJy) (mJy) (mag) (mag) (mag) fractiona fractionb (mas) (pc) (pc)
18.8 34.2 61.8 12.3 11.2 10.1 0.005 ± 0.002 0.21 ± 0.07 0.74 ± 0.23 0.16 ± 0.05 0.071 ± 0.025
Notes. (a) K-band flux contribution in the AMBER FOV. (b)
AD flux contribution to the point-like core in the 2MASS K-band image.
(c)
Reverberation radius RτK (Glass 1992).
to derive calibrated visibilities from the 2011 data, but without AD flux fraction in the K-band was estimated to be as small as
success since the transfer function was unstable. 21 ± 7%, which is similar to the values of several other AGNs
reported by Kishimoto et al. (2007, 2009a). If we now take into
account these estimated flux contributions of ∼21% from the un-
3. Geometric model fits resolved AD and of ∼0.5% from the host galaxy, we can derive
To interpret our K-band visibilities (Fig. 1 middle), we first fit- the visibilities of the torus itself and can fit the radius of the torus
ted a geometric thin-ring model (i.e., ring width = outer radius (i.e., this radius is the only fit parameter; the AD contributes just
minus inner radius = 0) to the visibilities and derived a ring-fit a constant of 0.21 to the total visibilities). We derive a torus ra-
radius of ∼0.67 mas. This is only a very rough estimate of the dius Rtorus of 0.74 ± 0.23 mas or 0.16 ± 0.05 pc (thin-ring fit; see
torus size since the observed visibilities may not only depend Fig. 1 middle, red curve).
on the torus but also on the underlying galaxy within the 60 mas
field-of-view (FOV) of AMBER and on the accretion disk (AD), 4. Interpretation and discussion
which is thought to remain unresolved (Kishimoto et al. 2007,
2009a,b). Therefore, we have to estimate the flux contributions 4.1. NIR interferometric and reverberation radii
from the host galaxy and the AD point source and take these Figure 2 compares the derived ring-fit radius Rtorus ∼ 0.16 pc of
contributions into account when fitting the visibilities. NGC 3783 (red) with eight interferometric K-band radii (blue)
From the K-band image of NGC 3783 in the 2MASS cata- reported by Kishimoto et al. (2009a, 2011a). These radii are plot-
log, we estimated the flux contribution of the host galaxy within ted against the UV luminosity L, defined as a scaled V-band lu-
the 60 mas AMBER FOV to 0.5 ± 0.2%. To obtain the NIR flux minosity of 6 ν fν (V), with the V flux extrapolated from the flux
from the torus and the AD, we used two-dimensional fits to sep- at 1.2 μm (Kishimoto et al. 2007). We can compare these torus
arate the point-like core component in the 2MASS J-, H-, and radii with reverberation radii RτK (black) derived from the light
K-band images from the underlying host galaxy (see Table 2), traveling distances corresponding to the time lag between the
following the same procedure as described by Kishimoto et al. K-band and the UV/optical (Suganuma et al. 2006). They are
(2009a). Using the derived NIR core fluxes, we can estimate the known to be proportional to ∼L1/2 and are likely probing the
flux contribution of the AD component in the K band. We as- dust sublimation radius. The dotted line is the fit curve of the
sume here that the core component flux originates from the hot reverberation radii (different luminosity values are obtained for
dust and from the AD. Therefore, we fitted a power-law spec- the same object because of variability and uncertainties of the
trum for the AD and a blackbody for the dust emission, as de- luminosity derivation). The reverberation radius of NGC 3783 is
scribed in Kishimoto et al. (2009a). We also applied a small cor- ∼0.071 pc, which is smaller than the interferometric torus radius
rection for Galactic reddening with E B−V = 0.119. By assigning Rtorus ∼ 0.16 pc (Sect. 3). Figure 2 shows that several interfer-
an uncertainty of the NIR AD spectral index of 0.3, we also ob- ometric torus radii are larger than the reverberation radii. Our
tained the uncertainty of the K-band AD flux contribution. The interpretation is that the interferometric torus radii are averages
L9, page 2 of 4
3. G. Weigelt et al.: VLTI/AMBER observations of the Seyfert AGN NGC 3783
Torus radius = 0.74 mas (21% AD flux, 0.5% host galaxy)
1.1
1.0
visibility
0.9
0.8
0.7
0 20 40 60 80 100
projected baseline length [m]
80
60
closure phase [deg]
40
20
0
-20
-40
-60
-80
2 2.05 2.1 2.15 2.2 2.25 2.3 2.35 2.4
lambda [micron]
Fig. 1. Top: examples of LR K-band AMBER interferograms of
NGC 3783 (∼2.0–2.4 μm from bottom to top), which illustrate the
noise problem. From left to right, the first and second interfero-
gram are recorded with UT2–UT3 (46.6 m projected baseline) with
DIT = 800 ms and 400 ms, respectively, the third one with UT3–UT4
(62.5 m, 800 ms), and the last one with UT2–UT4 (89.4 m, 800 ms).
Middle: calibrated visibilities of NGC 3783 and geometric ring-model
fit (red). We derive a ring-fit torus radius of 0.74 ± 0.23 mas or
0.16 ± 0.05 pc. Bottom: closure phases plotted versus wavelength.
Fig. 3. Temperature/density-gradient model including an additional in-
ner hot 1400 K ring component. Top: SED observations (black and gray
symbols), model SEDs (black solid line: model including the 1400 K
ring component; black dotted line: model without the 1400 K compo-
nent), and correlated fluxes (yellow, green, and blue; see Paper I for
more details). The different colors (see top color bar) correspond to dif-
ferent spatial wavelengths measured in units of the dust sublimation
radius Rin . Bottom: new NIR visibilities (purple symbols) and our MIR
visibilities from Paper I (the symbols with colors from green to red
correspond to 8.5 to 13 μm; see color-coding bar; note that the spatial
frequency is given in units of cycles per Rin ). The solid and dashed lines
are the visibilities of the temperature/density-gradient model including
an additional inner 1400 K ring. The red, green, and purple lines are the
model visibilities at 13, 8.5, and 2.2 μm, respectively (solid lines: model
curves for the PA along the equatorial axis; dashed line: along the polar
direction; see Paper I). The dotted lines are the visibilities and SED of
the same temperature/density-gradient model, but without an inner hot
Fig. 2. K-band torus radii of NGC 3783 (red dot) and eight other AGNs 1400 K ring component.
(blue; from Kishimoto et al. 2011a) versus their UV luminosities. The
black symbols and the dotted line are the reverberation radii RτK (Glass
1992; Suganuma et al. 2006) and their fit curve, respectively.
4.2. Simultaneous modeling of the NIR AMBER visibilities,
the MIR MIDI visibilities, and the SED
over the radial dust distribution that emits the K-band light,
whereas the reverberation radii probably trace the dust closer Mid-infrared (MIR) MIDI interferometry of NGC 3783 was
to the inner dust torus boundary radius (Kishimoto et al. 2009a). reported by Beckert et al. (2008), Kishimoto et al. (2009b),
Furthermore, we note that Rtorus ∼ 0.16 pc is a fit radius calcu- and Kishimoto et al. (2011b) (=Paper I). For the interpretation
lated with a thin-ring model (i.e., ring width = outer radius minus of these observations, we used a temperature/density-gradient
inner radius = 0). If a dust distribution with a certain thin-ring fit model including an additional hot inner ring component with a
radius is ring-like and has a ring width larger than zero, then the temperature of 1400 K (Paper I). This simple model assumes that
inner ring radius would be smaller than the thin-ring fit radius. the face-on surface brightness distribution of the torus is domi-
We have not fitted a ring model with a larger ring width, since the nated by the IR radiation from dust clouds directly illuminated
ring width cannot be constrained with the available visibilities. and heated by the AD. These dust clouds are probably located
L9, page 3 of 4
4. A&A 541, L9 (2012)
near the torus surface since clouds deep inside the torus are not of an extended ring (see discussion in Sect. 4.1). This large ra-
directly illuminated. dius probably indicates a relatively shallow, extended innermost
The surface brightness distribution of this temperature/ dusty structure (Paper I) in NGC 3783.
density-gradient model depends on two distributions, namely a
radial temperature and a radial surface density distribution (see 5. Conclusion
Eq. (8) in Paper I). The maximum dust temperature T max (r) at
We have derived a torus radius of 0.74 ± 0.23 mas or 0.16 ±
distance r is assumed to be proportional to (r/Rin )β , where r
0.05 pc (thin-ring fit). To derive this NGC 3783 torus ra-
is the radial distance, β is the power-law index, and Rin is the
dius, we took into account an estimated relative flux contribu-
dust sublimation radius empirically given by the NIR reverbera-
tion of 0.5% from the underlying host galaxy in the 60 mas
tion radius RτK (Glass 1992), i.e., we define Rin = RτK (Paper I,
AMBER FOV and 21% from the unresolved accretion disk.
Eq. (1)).
This torus radius is approximately 2.3 times larger than the
Furthermore, the surface brightness distribution depends on K-band reverberation radius RτK ∼ 0.071 pc (see discussion
the surface density function f (r) = f0 (r/Rin )α of the heated dust in Sect. 4.1). For the interpretation of the observations, we em-
clouds near the surface (power law with index α). The emissivity ployed a temperature/density-gradient model including a hot in-
factor f0 is equal to f (r) at r equal to the sublimation radius Rin . ner 1400 K ring. We simultaneously fitted our new NIR AMBER
Our IR observations are only sensitive to the dust clouds near the visibilities, the MIR MIDI visibilities from Paper I, and the SED
surface, which have the temperature T max (r), and not to the cold to constrain physical parameters of the dust distribution. For
dust inside the torus. f (r) can be regarded as a surface filling the power-law component of the model, we derived a temper-
factor multiplied by the emissivity (Paper I). If the emissivity of ature power-law index β ∼ −0.37 and a surface density index
optically thick illuminated clouds does not depend sensitively on α ∼ 0.07. For the required 1400 K ring component, a radius of
the radial distance from the illuminating source or the observing ∼2.3 reverberation radii or ∼0.16 pc was found, whereas in the
wavelength (e.g., see Fig. 3 of Hönig & Kishimoto 2010), the modeling in Paper I, the 1400 K ring radius was assumed to be
factor f (r) is roughly proportional to the radial surface density one reverberation radius. This 1400 K ring radius of ∼0.16 pc,
distribution of the heated dust. which is relatively large compared to the reverberation radius, is
Interestingly, the application of this temperature/density- a representative thin-ring radius and not the inner radius of an ex-
gradient model to several AGNs in Paper I and to the NGC 3783 tended ring. This radius probably indicates a relatively shallow,
observations reported in this paper (see Fig. 3) has shown that extended inner dusty structure. Our study of NGC 3783 and the
an additional inner hot model component is required with a tem- results in Paper I show that the simultaneous modeling of both
perature of 1400 K and a radius of one or a few dust sublimation NIR and MIR interferometric observations is a powerful tool for
radii in order to explain all observations. This hot component future detailed studies of AGN tori.
might play a similar role as the puffed-up inner rim discovered
in several young stellar objects near the dust sublimation radius. Acknowledgements. We thank the ESO VLTI team on Paranal for the excellent
We simultaneously fitted this temperature/density-gradient collaboration and the referee for his valuable comments. This publication makes
model including an inner 1400 K ring to our new K-band data as use of the SIMBAD database operated at CDS, Strasbourg, France. Some of
the data presented here were reduced using the publicly available data-reduction
well as the MIR data and the SED from Paper I. The goal of this software package amdlib kindly provided by the Jean-Marie Mariotti Center
modeling is to further constrain physical parameters of the dust (http://www.jmmc.fr/data_processing_amber.htm).
distribution. Figure 3 shows that this model is able to simultane-
ously reproduce all NIR and MIR visibilities as well as the SED.
In Fig. 3 (bottom), the NIR visibilities (purple) and the MIR vis- References
ibilities are shown (from green to red, wavelengths 8.5 to 13 μm; Antonucci, R. 1993, ARA&A, 31, 473
see color-coding bar). The purple, red, and green curves are the Beckert, T., Driebe, T., Hönig, S. F., & Weigelt, G. 2008, A&A, 486, L17
model visibilities at 2.2, 13, and 8.5 μm, respectively. The solid Burtscher, L., Jaffe, W., Raban, D., et al. 2009, ApJ, 705, L53
lines are the model curves along the PA of the equatorial axis, Burtscher, L., Meisenheimer, K., Jaffe, W., Tristram, K. R. W., & Röttgering,
H. J. A. 2010, PASA, 27, 490
the dashed line along the polar direction, as defined by optical Chelli, A., Utrera, O. H., & Duvert, G. 2009, A&A, 502, 705
polarization measurements (see Paper I, where this elliptical and Glass, I. S. 1992, MNRAS, 256, 23
a circular symmetric model are presented). Hönig, S. F., & Kishimoto, M. 2010, A&A, 523, A27
If there is no hot inner ring component added to the above Jaffe, W., Meisenheimer, K., Röttgering, H. J. A., et al. 2004, Nature, 429, 47
Kishimoto, M., Hönig, S. F., Beckert, T., & Weigelt, G. 2007, A&A, 476, 713
temperature/density-gradient model, then the K-band model vis- Kishimoto, M., Hönig, S. F., Antonucci, R., et al. 2009a, A&A, 507, L57
ibilities (blue dotted line in Fig. 3, bottom) are systematically Kishimoto, M., Hönig, S. F., Tristram, K. R. W., & Weigelt, G. 2009b, A&A,
higher than observed and the model SED (black dotted line in 493, L57
Fig. 3, top) has a deficiency in the NIR. Therefore, the above Kishimoto, M., Hönig, S. F., Antonucci, R., et al. 2011a, A&A, 527, A121
inner 1400 K ring component is required to explain the data. Kishimoto, M., Hönig, S. F., Antonucci, R., et al. 2011b, A&A, 536, A78
(Paper I)
This new modeling including K-band visibilities (Fig. 3) is Kreplin, A., Kraus, S., Hofmann, K.-H., et al. 2012, A&A, 537, A103
more detailed than that in Paper I. Some of the parameters are Krolik, J. H., & Begelman, M. C. 1988, ApJ, 329, 702
similar as in Paper I; a temperature power-law index β = −0.37, Meisenheimer, K., Tristram, K. R. W., Jaffe, W., et al. 2007, A&A, 471, 453
density index α = 0.07, and emissivity factor f0 = 0.12 for the Petrov, R. G., Malbet, F., Weigelt, G., et al. 2007, A&A, 464, 1
Pott, J.-U., Malkan, M. A., Elitzur, M., et al. 2010, ApJ, 715, 736
power-law component of the elliptical model with an inner tem- Raban, D., Jaffe, W., Röttgering, H., Meisenheimer, K., & Tristram, K. R. W.
perature of 700 K (Paper I, Table 8). However, in our new model- 2009, MNRAS, 394, 1325
ing, the emissivity factor of the inner 1400 K ring is 0.038±0.016 Suganuma, M., Yoshii, Y., Kobayashi, Y., et al. 2006, ApJ, 639, 46
and the radius of the hot 1400 K ring is 2.29 ± 0.47 RτK or Swain, M., Vasisht, G., Akeson, R., et al. 2003, ApJ, 596, L163
Tatulli, E., Millour, F., Chelli, A., et al. 2007, A&A, 464, 29
∼0.16 pc (with the above RτK = 0.071 pc), which is no longer Tristram, K. R. W., & Schartmann, M. 2011, A&A, 531, A99
fixed to 1 RτK as in Paper I. This 1400 K ring radius of ∼2.29 RτK , Tristram, K. R. W., Meisenheimer, K., Jaffe, W., et al. 2007, A&A, 474, 837
which is relatively large compared to the reverberation radius Tristram, K. R. W., Raban, D., Meisenheimer, K., et al. 2009, A&A, 502, 67
RτK , is a representative thin-ring radius and not the inner radius Wittkowski, M., Kervella, P., Arsenault, R., et al. 2004, A&A, 418, L39
L9, page 4 of 4