
More Related Content
Similar to A.2011 Portal annual budget_汽车游戏频道 _COR_final0
Similar to A.2011 Portal annual budget_汽车游戏频道 _COR_final0 (20)
A.2011 Portal annual budget_汽车游戏频道 _COR_final0
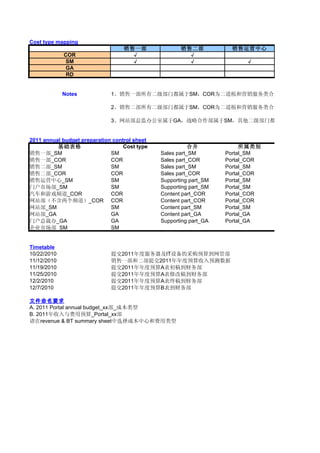
- 1. Annual Budget Overview Budget Totals Estimated Actual Difference Total Income $520,491 $555,401 $34,910 Total Expenses $551,328 $543,584 $7,744 Difference ($30,837) $11,817 $42,654
- 2. Annual Expense Report Estimated Annual Expenses $551,328 Actual Annual Expenses $543,584 Difference $7,744 Month (All) Qtr (All) Values Row Labels Estimated Total Actual Total Variance Total Personnel $177,946 $174,534 $3,412 Office $90,128 $84,812 $5,316 Salespeople $87,818 $89,722 ($1,904) Operating $373,382 $369,050 $4,332 Advertising $87,259 $91,738 ($4,479) Delivery Costs $96,141 $81,995 $14,146 Legal and Auditing $82,747 $93,837 ($11,090) Office supplies $98,722 $95,877 $2,845 Utilities $8,513 $5,603 $2,910 Totals $551,328 $543,584 $7,744
- 3. Prior Year Total Prior Year Variance Total $181,136 $6,602 $87,431 $2,619 $93,705 $3,983 $347,452 ($21,598) $95,865 $4,127 $80,426 ($1,569) $85,083 ($8,754) $77,345 ($18,532) $8,733 $3,130 $528,588 ($14,996)
- 4. Monthly Budget - Detail 9/12/2011Page 4 of 11 Month Qtr Category Line Item Estimated Actual January Qtr 1 Personnel Office $8,000 $9,000 January Qtr 1 Personnel Salespeople $8,212 $6,454 January Qtr 1 Operating Advertising $9,000 $9,000 January Qtr 1 Operating Delivery Costs $9,736 $5,336 January Qtr 1 Operating Legal and Auditing $6,169 $6,773 January Qtr 1 Operating Office supplies $7,185 $7,638 February Qtr 1 Personnel Office $8,657 $8,493 February Qtr 1 Personnel Salespeople $5,277 $5,686 February Qtr 1 Operating Advertising $7,097 $5,237 February Qtr 1 Operating Delivery Costs $5,455 $7,426 February Qtr 1 Operating Legal and Auditing $6,216 $5,249 February Qtr 1 Operating Office supplies $8,421 $8,393 March Qtr 1 Personnel Office $6,427 $6,768 March Qtr 1 Personnel Salespeople $6,994 $9,714 March Qtr 1 Operating Advertising $6,670 $6,883 March Qtr 1 Operating Delivery Costs $9,285 $5,822 March Qtr 1 Operating Legal and Auditing $5,874 $7,548 March Qtr 1 Operating Office supplies $9,531 $8,429 April Qtr 2 Personnel Office $8,867 $6,774 April Qtr 2 Personnel Salespeople $5,689 $9,353 April Qtr 2 Operating Advertising $8,241 $6,990 April Qtr 2 Operating Delivery Costs $9,488 $6,644 April Qtr 2 Operating Legal and Auditing $5,794 $9,154 April Qtr 2 Operating Office supplies $6,711 $8,385 May Qtr 2 Personnel Office $7,453 $5,033 May Qtr 2 Personnel Salespeople $7,210 $7,544 May Qtr 2 Operating Advertising $5,693 $7,603 May Qtr 2 Operating Delivery Costs $5,286 $6,348 May Qtr 2 Operating Legal and Auditing $6,166 $6,577 May Qtr 2 Operating Office supplies $9,145 $7,637 June Qtr 2 Personnel Office $5,904 $5,835 June Qtr 2 Personnel Salespeople $9,699 $5,938 June Qtr 2 Operating Advertising $6,669 $5,849 June Qtr 2 Operating Delivery Costs $8,366 $7,508 June Qtr 2 Operating Legal and Auditing $6,106 $7,652 June Qtr 2 Operating Office supplies $6,987 $7,183 June Qtr 2 Operating Utilities $8,513 $5,603 July Qtr 3 Personnel Office $5,328 $9,556 July Qtr 3 Personnel Salespeople $8,468 $8,648 July Qtr 3 Operating Advertising $6,474 $6,881 July Qtr 3 Operating Delivery Costs $9,139 $7,446 July Qtr 3 Operating Legal and Auditing $8,359 $9,090
- 5. Monthly Budget - Detail 9/12/2011Page 5 of 11 July Qtr 3 Operating Office supplies $7,683 $8,142 August Qtr 3 Personnel Office $7,710 $5,823 August Qtr 3 Personnel Salespeople $6,061 $6,685 August Qtr 3 Operating Advertising $8,699 $8,947 August Qtr 3 Operating Delivery Costs $7,686 $6,018 August Qtr 3 Operating Legal and Auditing $8,405 $6,604 August Qtr 3 Operating Office supplies $9,820 $7,226 September Qtr 3 Personnel Office $7,026 $5,230 September Qtr 3 Personnel Salespeople $5,232 $9,454 September Qtr 3 Operating Advertising $6,528 $8,219 September Qtr 3 Operating Delivery Costs $7,953 $6,989 September Qtr 3 Operating Legal and Auditing $7,755 $8,409 September Qtr 3 Operating Office supplies $9,616 $6,711 October Qtr 4 Personnel Office $6,700 $7,050 October Qtr 4 Personnel Salespeople $9,866 $6,091 October Qtr 4 Operating Advertising $6,033 $9,097 October Qtr 4 Operating Delivery Costs $7,522 $5,149 October Qtr 4 Operating Legal and Auditing $7,067 $9,497 October Qtr 4 Operating Office supplies $6,088 $9,351 November Qtr 4 Personnel Office $8,937 $9,013 November Qtr 4 Personnel Salespeople $7,720 $7,128 November Qtr 4 Operating Advertising $9,575 $7,512 November Qtr 4 Operating Delivery Costs $7,554 $8,568 November Qtr 4 Operating Legal and Auditing $6,328 $9,091 November Qtr 4 Operating Office supplies $9,646 $9,126 December Qtr 4 Personnel Office $9,119 $6,237 December Qtr 4 Personnel Salespeople $7,390 $7,027 December Qtr 4 Operating Advertising $6,580 $9,520 December Qtr 4 Operating Delivery Costs $8,671 $8,741 December Qtr 4 Operating Legal and Auditing $8,508 $8,193 December Qtr 4 Operating Office supplies $7,889 $7,656
- 6. Monthly Budget - Detail 9/12/2011Page 6 of 11 Variance Prior Year Prior Year Variance Actual - Prior Overview ($1,000) $9,671 $671 $1,758 $9,218 $2,764 $0 $6,664 ($2,336) $4,400 $5,522 $186 ($604) $7,537 $764 ($453) $5,324 ($2,314) $164 $5,992 ($2,501) ($409) $9,623 $3,937 $1,860 $7,553 $2,316 ($1,971) $5,092 ($2,334) $967 $8,780 $3,531 $28 $5,260 ($3,133) ($341) $9,070 $2,302 ($2,720) $5,754 ($3,960) ($213) $9,899 $3,016 $3,463 $9,272 $3,450 ($1,674) $7,745 $197 $1,102 $6,139 ($2,290) $2,093 $6,267 ($507) ($3,664) $9,849 $496 $1,251 $9,603 $2,613 $2,844 $5,349 ($1,295) ($3,360) $5,235 ($3,919) ($1,674) $6,898 ($1,487) $2,420 $6,417 $1,384 ($334) $5,173 ($2,371) ($1,910) $5,830 ($1,773) ($1,062) $6,123 ($225) ($411) $9,297 $2,720 $1,508 $8,685 $1,048 $69 $5,465 ($370) $3,761 $8,134 $2,196 $820 $9,478 $3,629 $858 $5,740 ($1,768) ($1,546) $5,331 ($2,321) ($196) $7,559 $376 $2,910 $8,733 $3,130 ($4,228) $5,896 ($3,660) ($180) $9,024 $376 ($407) $9,074 $2,193 $1,693 $9,444 $1,998 ($731) $9,472 $382
- 7. Monthly Budget - Detail 9/12/2011Page 7 of 11 ($459) $5,528 ($2,614) $1,887 $8,516 $2,693 ($624) $7,331 $646 ($248) $6,664 ($2,283) $1,668 $5,873 ($145) $1,801 $5,374 ($1,230) $2,594 $5,056 ($2,170) $1,796 $5,988 $758 ($4,222) $7,813 ($1,641) ($1,691) $7,606 ($613) $964 $5,983 ($1,006) ($654) $6,859 ($1,550) $2,905 $6,428 ($283) ($350) $6,505 ($545) $3,775 $8,307 $2,216 ($3,064) $6,538 ($2,559) $2,373 $5,327 $178 ($2,430) $7,962 ($1,535) ($3,263) $8,418 ($933) ($76) $7,663 ($1,350) $592 $6,983 ($145) $2,063 $7,426 ($86) ($1,014) $9,693 $1,125 ($2,763) $6,066 ($3,025) $520 $6,764 ($2,362) $2,882 $9,981 $3,744 $363 $6,496 ($531) ($2,940) $9,530 $10 ($70) $7,008 ($1,733) $315 $5,425 ($2,768) $233 $5,286 ($2,370)
- 8. Annual Income Report Projected Annual Revenue $520,491 Actual Annual Revenue $555,401 Difference $34,910 Month (All) Qtr (All) Values Row Labels Estimated Total Actual Total Variance Total Net Sales $118,527 $115,263 $3,264 Interest Income $11,746 $10,888 $858 Sale of Assets (Gain/Loss) $3,760 $3,835 ($75) Totals $134,033 $129,986 $4,047
- 9. Prior Year Total Prior Year Variance Total $83,182 $32,081 $11,388 ($500) $3,319 $516 $97,889 $32,097
- 10. Monthly Budget - Detail 9/12/2011Page 10 of 11 Month Qtr Line Item Estimated Actual Variance Prior Year Prior Year Variance Actual - Prior Overview January Qtr 1 Net Sales $180,000 $200,000 $20,000 $96,710 $103,290 February Qtr 1 Net Sales $18,570 $18,493 ($77) $15,992 $2,501 March Qtr 1 Net Sales $16,427 $16,768 $341 $9,070 $7,698 April Qtr 2 Net Sales $18,867 $16,774 ($2,093) $16,267 $507 May Qtr 2 Net Sales $17,453 $15,033 ($2,420) $16,417 ($1,384) June Qtr 2 Net Sales $15,904 $15,835 ($69) $15,465 $370 July Qtr 3 Net Sales $15,328 $19,556 $4,228 $5,896 $13,660 August Qtr 3 Net Sales $7,710 $5,823 ($1,887) $8,516 ($2,693) September Qtr 3 Net Sales $7,026 $5,230 ($1,796) $5,988 ($758) October Qtr 4 Net Sales $6,700 $7,050 $350 $6,505 $545 November Qtr 4 Net Sales $80,000 $86,549 $6,549 $72,663 $13,886 December Qtr 4 Net Sales $120,000 $132,567 $12,567 $84,567 $48,000 January Qtr 1 Interest Income $2,000 $1,800 ($200) $1,178 $622 February Qtr 1 Interest Income $1,800 $1,930 $130 $1,942 ($12) March Qtr 1 Interest Income $810 $616 ($194) $906 ($290) April Qtr 2 Interest Income $929 $1,075 $146 $944 $131 May Qtr 2 Interest Income $862 $943 $81 $692 $251 June Qtr 2 Interest Income $1,085 $568 ($517) $888 ($320) July Qtr 3 Interest Income $1,153 $887 ($266) $1,181 ($294) August Qtr 3 Interest Income $546 $846 $300 $1,132 ($286) September Qtr 3 Interest Income $706 $720 $14 $1,073 ($353) October Qtr 4 Interest Income $923 $827 ($96) $1,056 ($229) November Qtr 4 Interest Income $793 $829 $36 $705 $124 December Qtr 4 Interest Income $1,139 $847 ($292) $691 $156 January Qtr 1 Sale of Assets (Gain/Loss) $0 $0 $0 $0 $0 February Qtr 1 Sale of Assets (Gain/Loss) $800 $930 $130 $942 ($12) March Qtr 1 Sale of Assets (Gain/Loss) $0 $0 $0 $0 $0 April Qtr 2 Sale of Assets (Gain/Loss) $929 $1,075 $146 $944 $131 May Qtr 2 Sale of Assets (Gain/Loss) $862 $943 $81 $692 $251 June Qtr 2 Sale of Assets (Gain/Loss) $0 $0 $0 $0 $0 July Qtr 3 Sale of Assets (Gain/Loss) $30 $40 $10 $50 ($10) August Qtr 3 Sale of Assets (Gain/Loss) $0 $0 $0 $0 $0 September Qtr 3 Sale of Assets (Gain/Loss) $0 $0 $0 $0 $0 October Qtr 4 Sale of Assets (Gain/Loss) $0 $0 $0 $0 $0 November Qtr 4 Sale of Assets (Gain/Loss) $0 $0 $0 $0 $0 December Qtr 4 Sale of Assets (Gain/Loss) $1,139 $847 ($292) $691 $156
- 11. Budget Line Item Lookup Budget Category Lookup Income Line Item Lookup Office Personnel Net Sales Store Operating Interest Income Salespeople Sale of Assets (Gain/Loss) Others Advertising Bad Debts Cash Discounts Delivery Costs Depreciation Dues and Subscriptions Employee Benefits Insurance Interest Legal and Auditing Maintenance and Repairs Office supplies Postage Rent or mortgage Sales expenses Shipping and storage Supplies Taxes Telephone Utilities