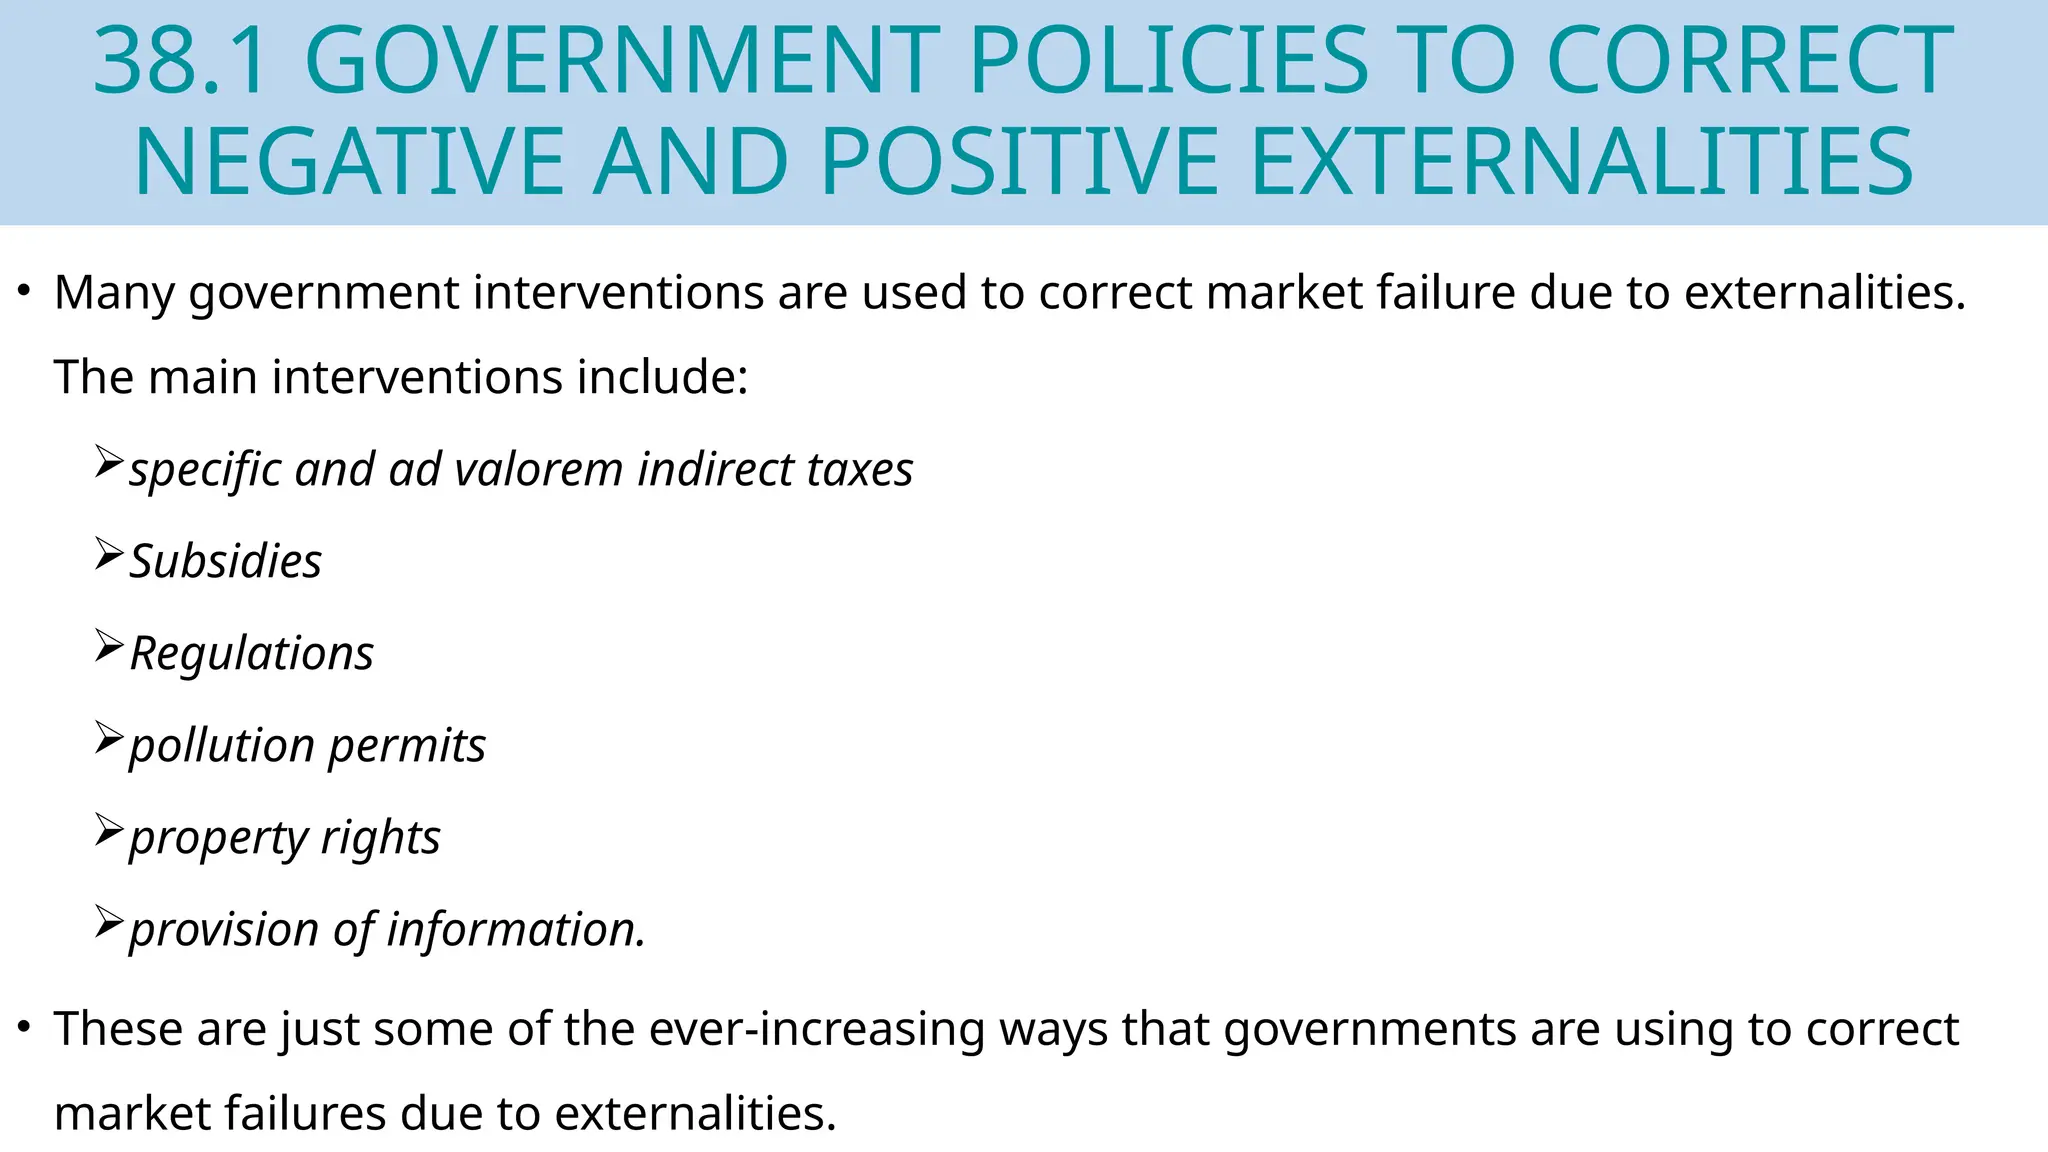
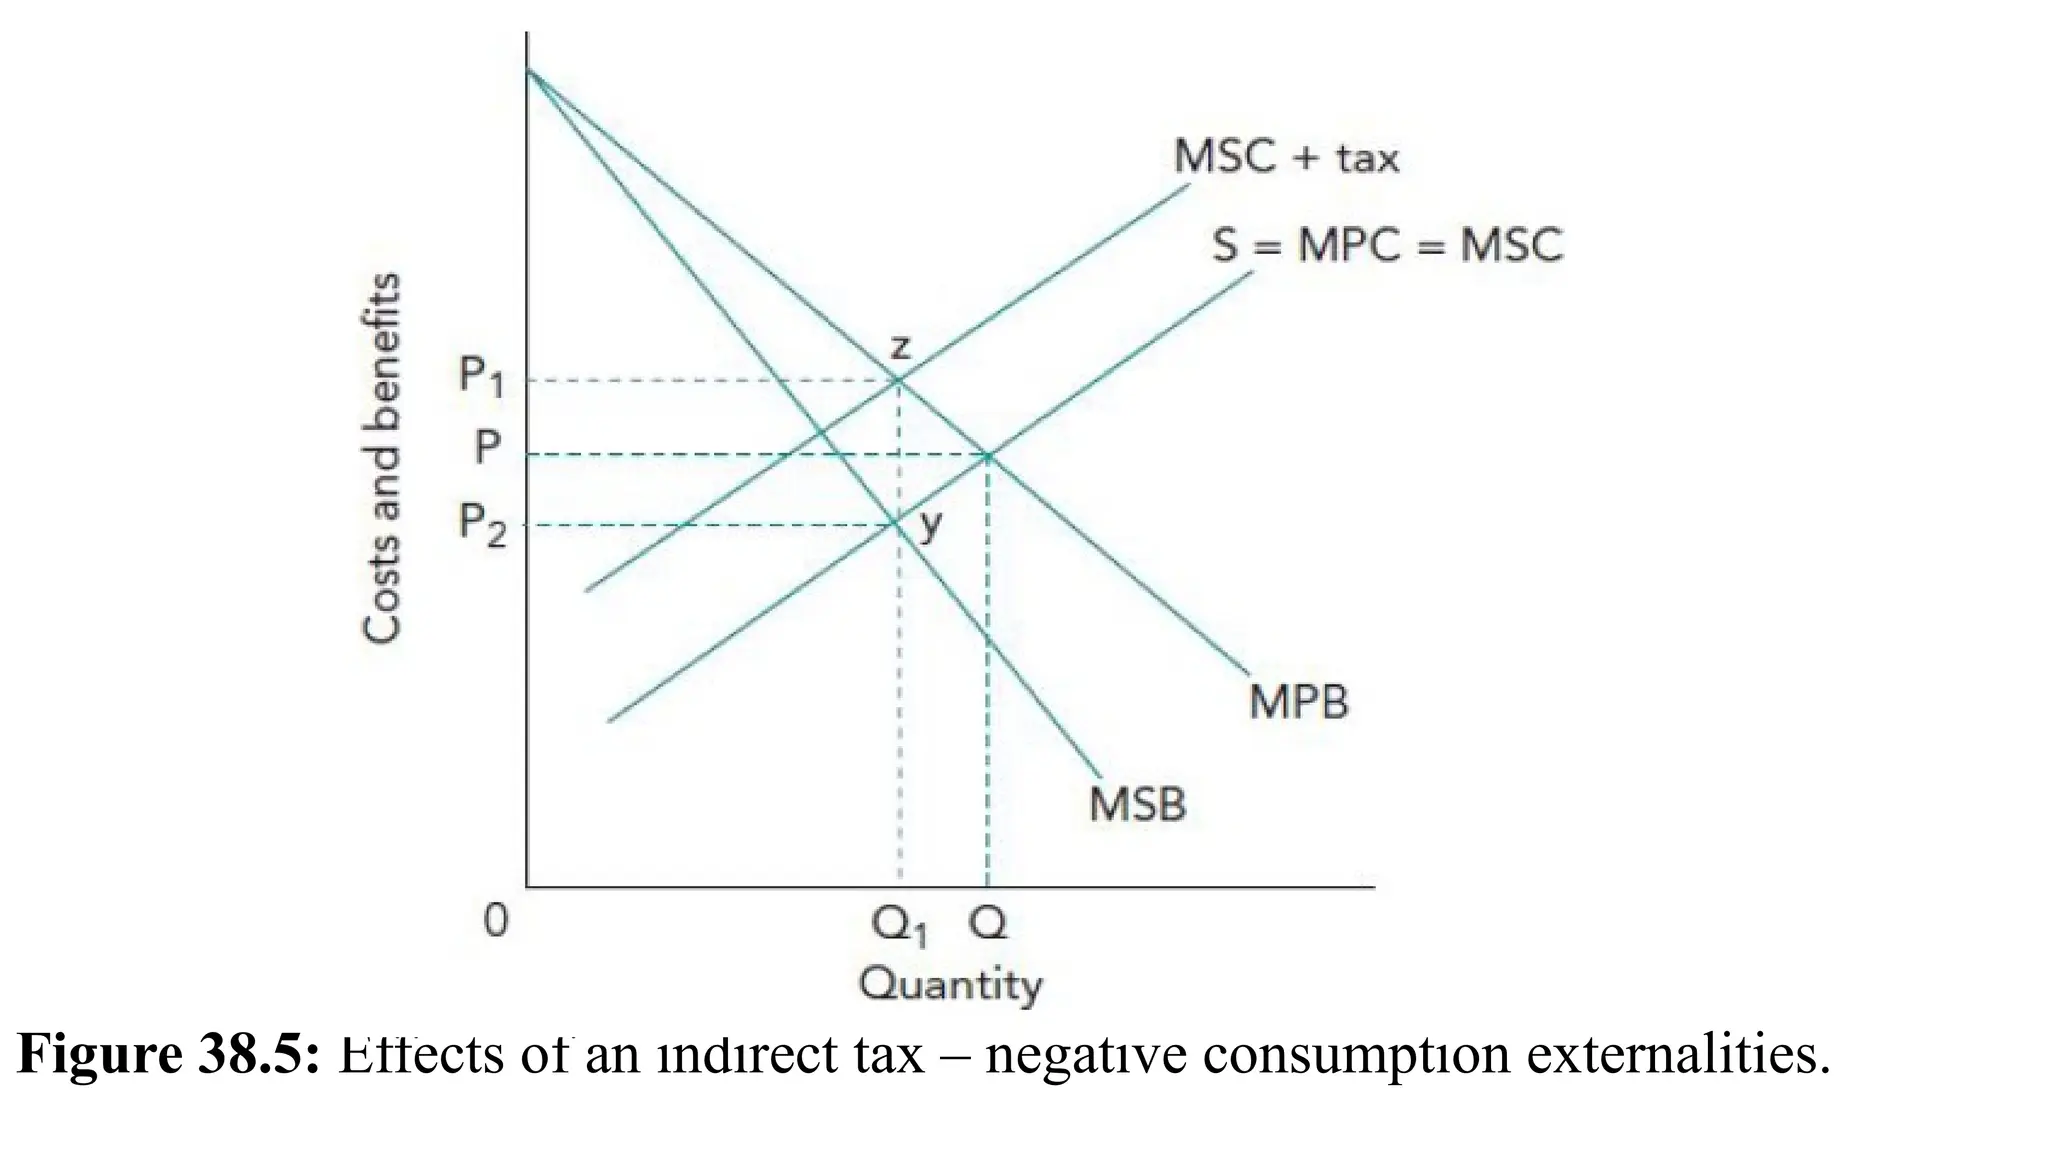
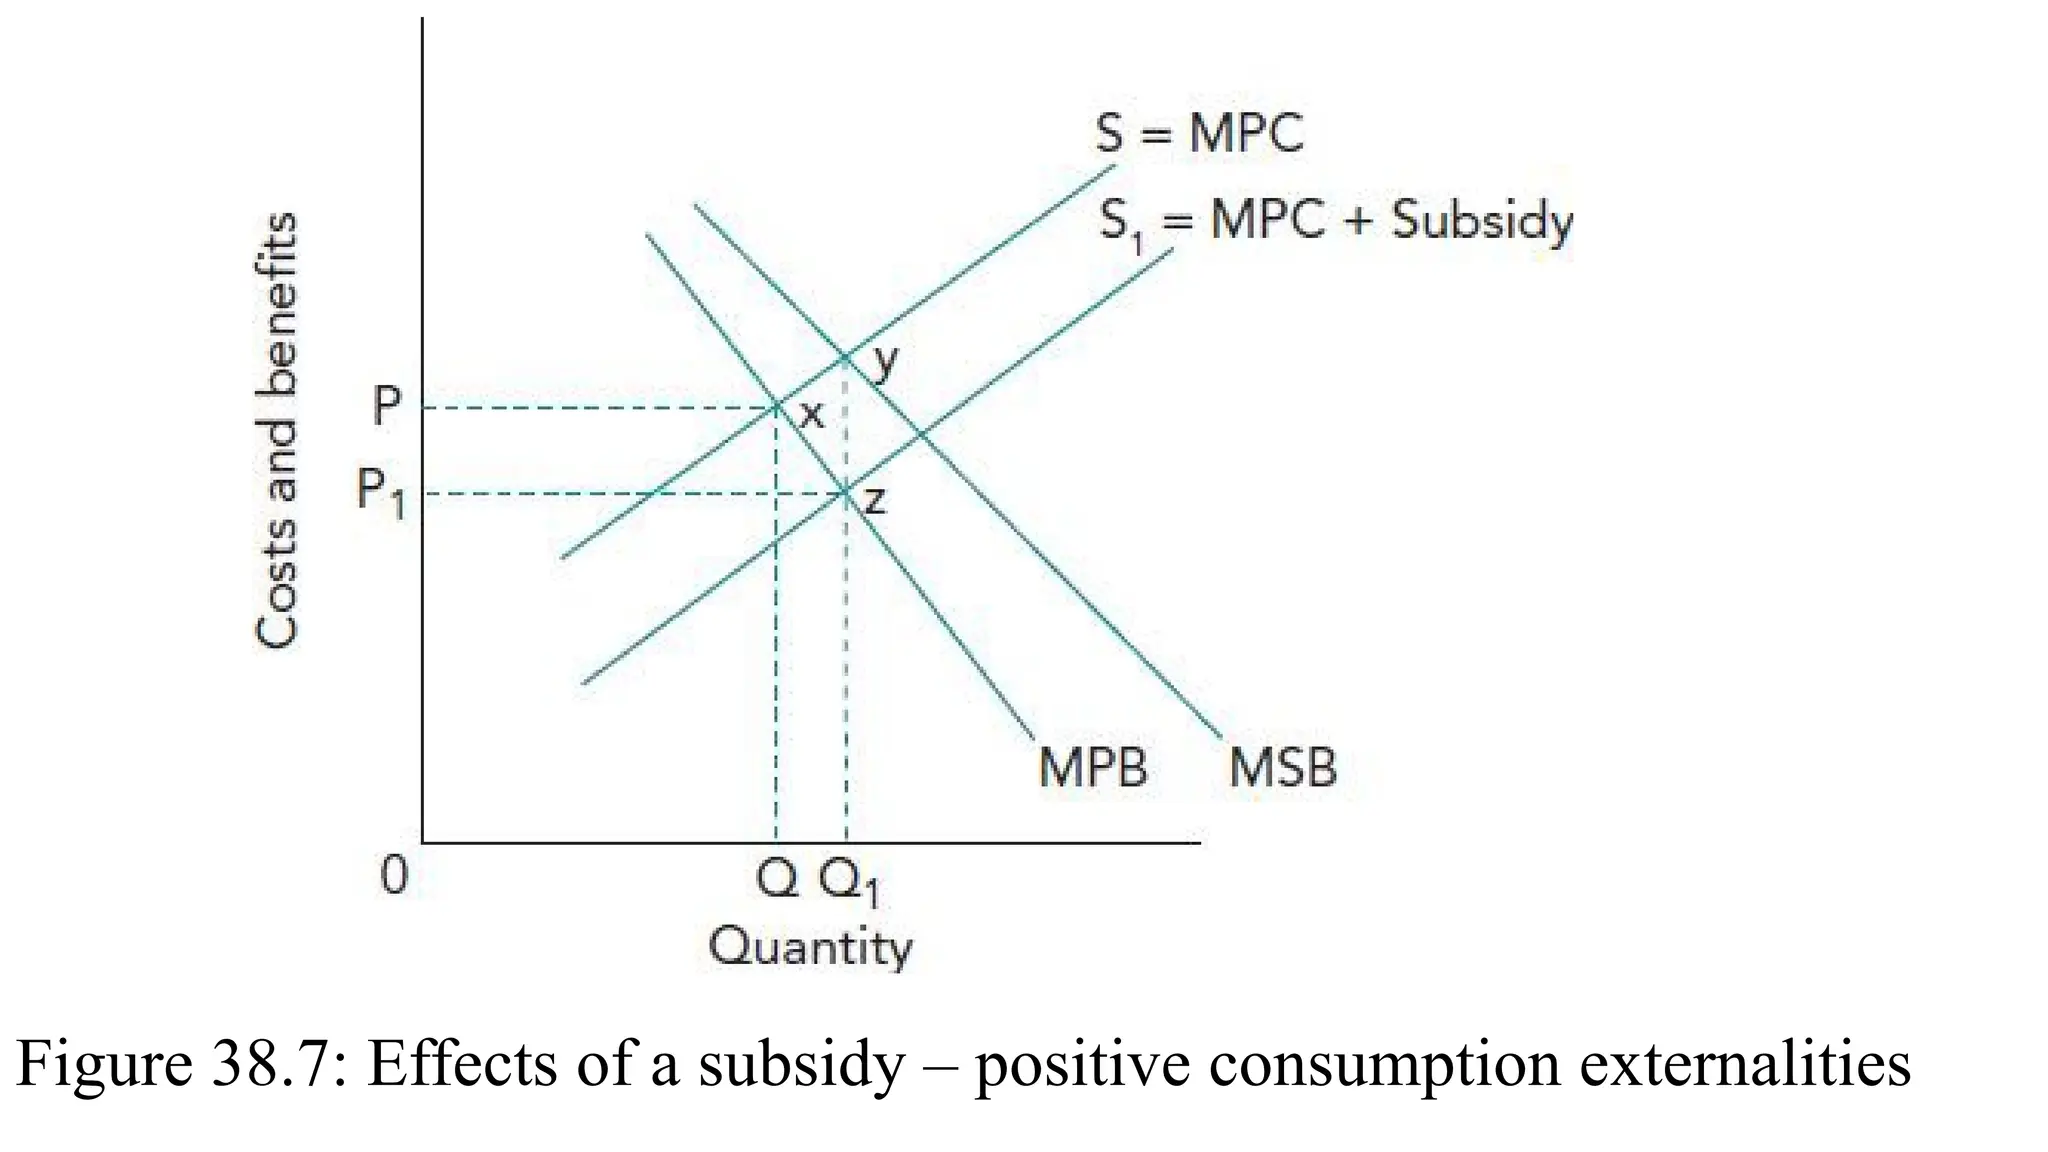
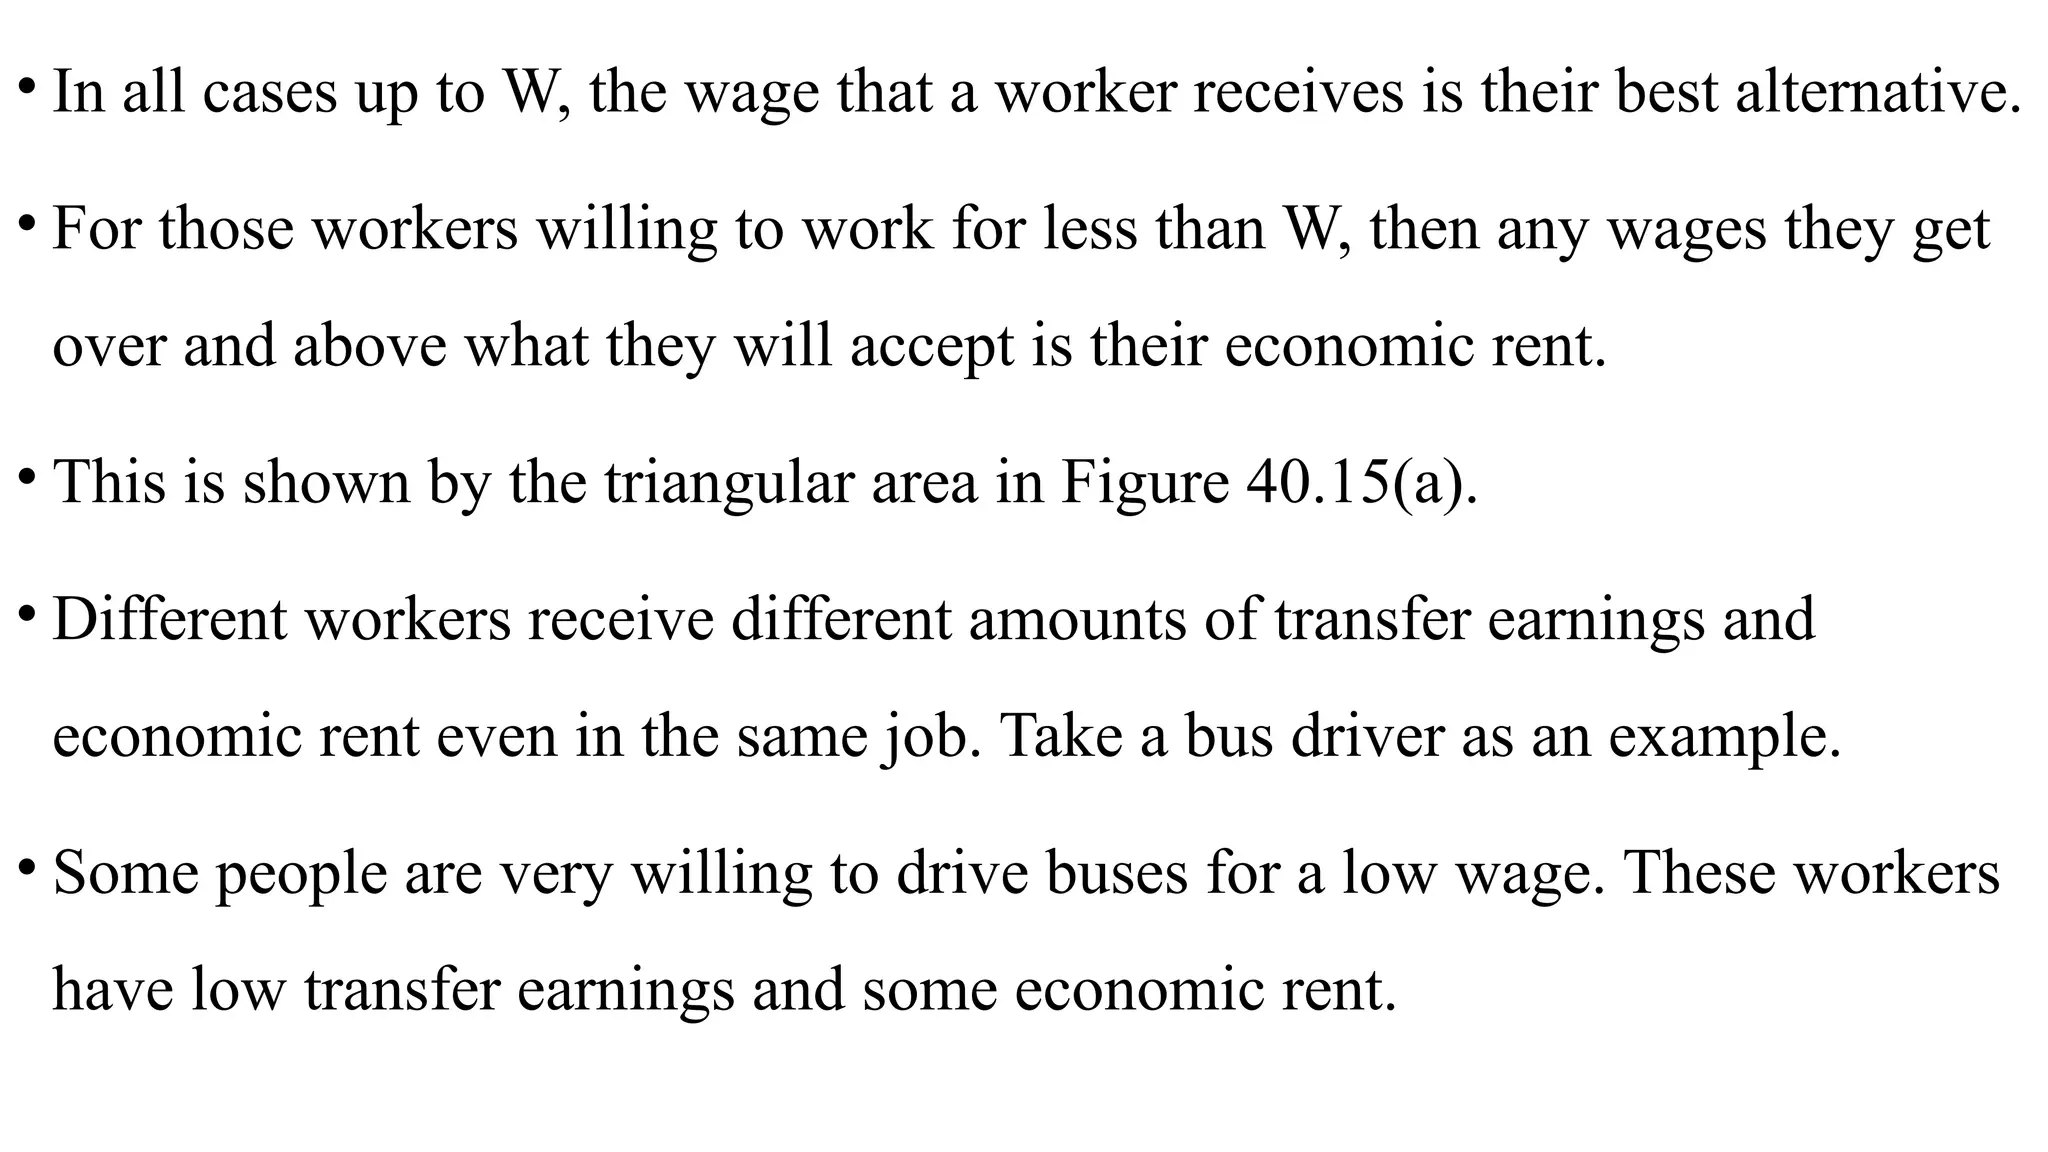
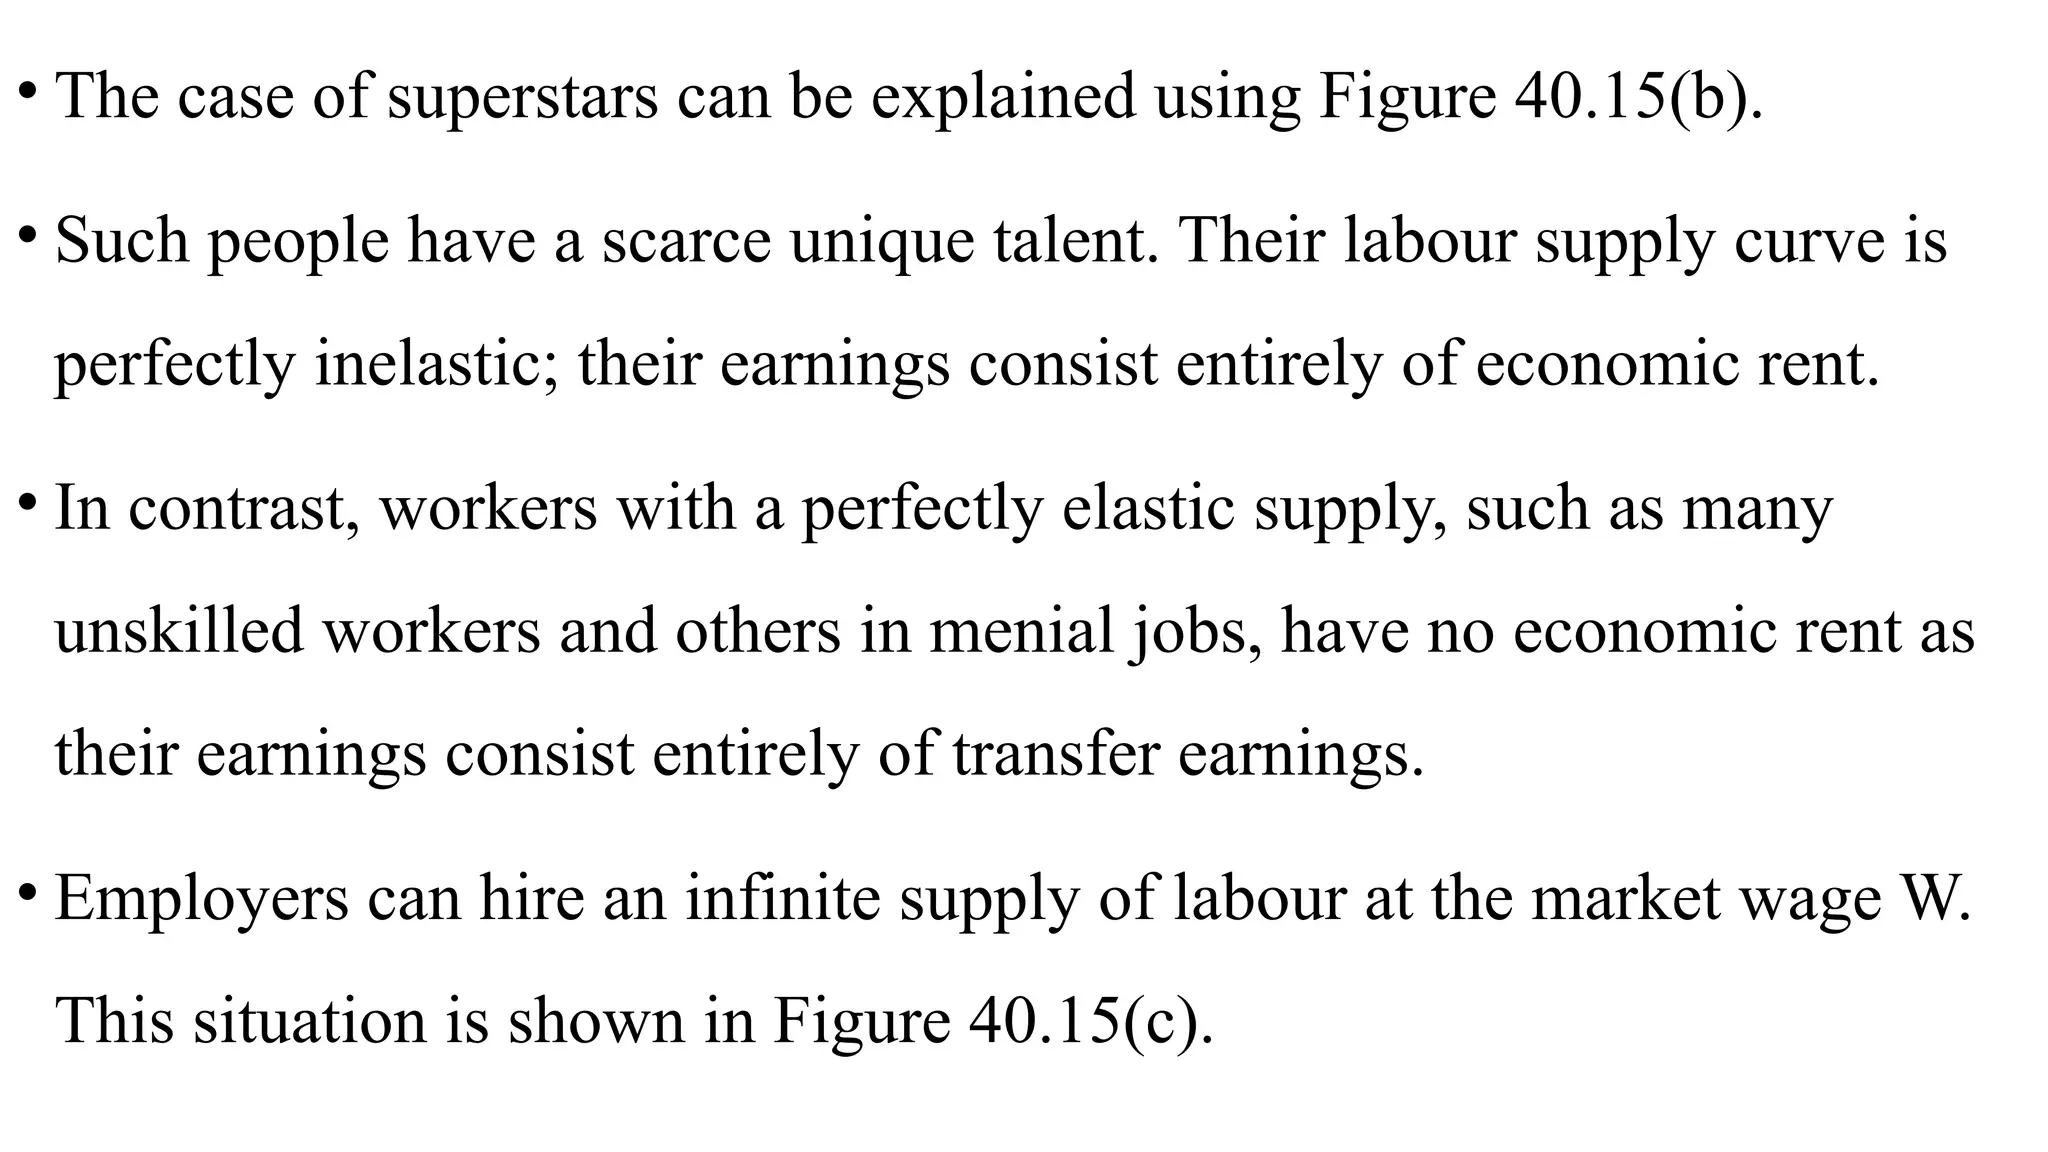
UNIT 8
GOVERNMENT MICROECONOMIC
INTERVENTION (A LEVEL)
CHAPTER 38
GOVERNMENT POLICIES TO ACHIEVE EFFICIENT
RESOURCE ALLOCATION AND CORRECT MARKET FAILURE
LEARNING INTENTIONS
In this chapter you will learn how to:
• Explain how a range of tools can be used to correct the different forms of market
failure, including specific and ad valorem indirect taxes, subsidies, price controls,
production quotas, prohibitions and licences, regulation and deregulation, direct
provision, pollution permits, property rights, nationalisation and privatisation,
provision of information and behavioural insights and ‘nudge’ theory
• Evaluate the effectiveness of the tools used to correct market failure
• Define the meaning of government failure in microeconomic intervention
• Explain the causes and consequences of government failure.
• Some methods of government intervention and their effects on
markets were introduced in AS level (Sections 13.1 to 13.6.)
• The meaning of market failure and the nature of negative and
positive externalities were explained in Sections 32.6 and 33.3.
• This chapter builds upon this content; its focus is to explain and
evaluate the tools that governments use to correct market
failure in order to achieve an efficient allocation of resources.
• In principle, the free market mechanism should produce the best
allocation of resources.
• The reality is that, increasingly, this is not so.
• Consequently, the market mechanism needs to be supported by many
forms of government intervention in order to correct its failings.
38.1 GOVERNMENT POLICIES TO CORRECT
NEGATIVE AND POSITIVE EXTERNALITIES
• Many government interventions are used to correct market failure due to externalities.
The main interventions include:
specific and ad valorem indirect taxes
Subsidies
Regulations
pollution permits
property rights
provision of information.
• These are just some of the ever-increasing ways that governments are using to correct
market failures due to externalities.
NEGATIVE PRODUCTION EXTERNALITIES
• A common situation of market failure is where there are negative production
externalities.
• An example of a negative production externality is where a firm illegally
disposes of toxic waste, emitting toxic fumes into the atmosphere.
• Another example is where the over-use of pesticides by farmers
contaminates water supplies. If this water is then untreated and consumed by
local people, its consumption could cause cholera and possible loss of life.
Specific and ad valorem indirect taxes
• One way to correct for this type of externality is that the government should
tax those activities where too much is being produced.
• An indirect tax should be imposed on the individual or on the firm that has
caused the negative externality.
• The tax should ideally be equal to the marginal external cost.
• This tax, which is often referred to as a Pigouvian tax, is designed to
internalise the externality – this means that firms pay the cost of the
externalities that they have caused to third parties.
• Figure 38.2 shows the effects of imposing an ad valorem green or pollution
tax on the firm whose actions have caused the discharge of toxic waste.
• MPC and MSC diverge as output increases since the tax is levied on the
quantity of output.
• The tax is added to the cost of producing the product; the supply curve MSC
is now equal to the MPC plus this tax.
• Figure 38.2 shows that the price at which the product is sold has increased
from P to P1. This is less than the tax applied by the government.
• At first sight this may appear illogical, but the producer has accepted a
cut in the price received from P to P2. The producer has borne the
burden of part of the tax.
• The total tax paid is equal to the area P2P1yz, of which the consumer’s
share of the burden is PP1yx and the producer’s share is P2Pxz.
• The effect of the negative externality is now internalised within the
market. This is an ideal situation.
Figure 38.2: A green tax – negative production externalities.
• In practice, the big problem is being able to know or estimate
the exact value of the tax that is to be imposed.
• This problem arises because of the issue of putting realistic
monetary values on the costs of externalities.
• For example, what is the price of clean, unpolluted air? Because
of this problem, the size of the pollution tax that is imposed
may be less than the marginal external cost.
• This would mean that the market failure was only partially
resolved.
• The tax could even be greater than the MEC; this too would not be an
efficient solution to the problem.
• This estimation issue is a cause of government failure.
• A second problem is that a green tax will not be effective if the
demand for the product being taxed has a price inelastic
demand.
• An example is diesel fuel which is essential for owners of
vehicles with diesel engines. The additional charge will end up
being paid for by consumers.
• If the product being taxed is more price elastic, the green tax
is more likely to result in a switch of consumption to the
products of less polluting firms.
• The international competitiveness of products subjected to
green taxes should also be considered.
• A country with high green taxes may find that its exports
suffer from cheaper goods that are produced elsewhere
where there may be no such taxes.
Regulations
• Regulations and the work of regulatory bodies is another way to
overcome market failures caused by negative production externalities.
• Consider the case of a mining company that pollutes the surrounding
countryside.
• The government might intervene by setting standards that
restrict the amount of polluted waste that can be legally dumped.
• The government would then need to regulate and inspect the
company to make sure that these restrictions are enforced.
• If regulations are being abused, a regulatory body can
impose large fines on the company.
• If the damage persists, the firm could be forced to close.
• Exhaust fumes from vehicles pollute the atmosphere and, to
reduce this problem, governments set legal limits on the
amount of carbon particles that are emitted from a vehicle’s
exhaust system.
• Collectively, this type of regulation is sometimes referred to
• Deregulation involves the removal of any regulations that act
as barriers to entry for new firms seeking to enter a market.
• The purpose of deregulation is to encourage competition
between new firms and those that are established in an
industry.
• New firms are likely to be more efficient; prices will fall and
the polluting firms are likely to be forced to exit the industry
as they are unable to compete.
•Property rights
• This is a further way in which a market-based solution can be used to correct negative
production externalities.
• It involves property rights, the term used to indicate how owners can use their assets.
• If a property right can be established, a market solution can usually be reached
through agreement to extend these property rights to those causing the negative
externality.
• In many cases, property rights cannot be established, such as in cases involving the air
and sea.
• The absence of property rights leads to negative externalities of
production.
• By changing or extending property rights, owners of property can
prevent others from imposing costs on their property or they could
charge them if they do impose costs.
Two possibilities can occur:
1. If a polluting firm has property rights, then those who are affected by
its activities could pay the polluter to reduce the scale of activity and
therefore the pollution. In principle the polluter would require
payment equal to the loss of profit.
2. If those affected by negative externalities are assigned property
rights, then a polluting firm may be sued and obliged to compensate
them in some way. In principle the charge would be equal to the
marginal external cost.
Pollution permits
• A fourth form of intervention is through pollution permits, or tradable
permits, whereby polluting firms are provided with a permit to produce
a given level of pollution.
• This can apply to polluting the air or water.
• Unlike indirect taxation and regulations, pollution permits are a market
based solution as they can be bought and sold.
• The permits are also subjected to a given level of allowable pollution.
• The system is referred to as a ‘cap and trade’ system.
• A recent example of a ‘cap and trade’ system is China’s Emission
Trading Scheme (ETS).
Figure 38.3 shows how the ‘cap and trade’ system operates.
When introduced, the supply of pollution permits is S with a demand
of D.
The market price is therefore P. Assume over time that demand
increases to D1 (more pollutants are being emitted due to production
growth).
With supply fixed at S, the price rises to P1, giving every incentive to
polluting firms to be more environmentally efficient.
Hence, the supply curve shifts left to S1, with the price of permits
rising to P2. This puts even more financial pressure on firms to invest in
cleaner technologies, so cutting down on greenhouse gas emissions.
• Figure 38.3: Market for tradable pollution permits
• The use of pollution permits has many attractions but they are not
without their critics.
• The European Union’s (EU) Emissions Trading System (ETS) has
suffered at times from an oversupply of permits, mainly as a
consequence of a decline in industrial production coincident with
recession in 2008 and 2013.
• As the EU moved out of recession, the price of permits increased.
NEGATIVE CONSUMPTION EXTERNALITIES
• These externalities are the spillover costs caused by the consumption of
demerit goods.
• An example is the case of passive smoking and its effects on non-smokers;
there is also the problem of aircraft noise, which can seriously affect the
lifestyles of people who live close to a major airport, many of whom may
never travel by air.
• Road congestion is another example. As individual road users ‘consume’ road
space, this reduces the amount of road space that is available to other vehicles.
Specific indirect taxes
• Negative consumption externalities created by one group of consumers reduce the
private benefit of others.
• One remedy is to impose an indirect tax, usually a specific tax, on consumers of
demerit goods.
• Figure 38.5 below shows this situation. Due to external costs in the market, MSB is
below MPB.
• The market equilibrium is at P and Q where MPB equals MPC.
• The social optimum output is below Q at Q1 where MSB and MSC intersect.
• This case of market failure can be corrected by imposing an indirect tax
equal to YZ on those responsible for the negative consumption
externality.
• The supply curve then shifts to the left; the market price increases to P1
resulting in a fall in quantity consumed to Q1.
• This now gives a socially efficient allocation of resources.
Figure 38.5: Effects of an indirect tax – negative consumption externalities.
Price controls, provision of information and production quotas
• Another fiscal device is to impose a minimum price on products that
generate negative externalities of consumption.
• This intervention occurs in many countries to limit the consumption of
high-sugar energy drinks and tobacco products such as cigarettes.
• The minimum price increases the price to consumers above the point where
MPB = MSC.
• The effectiveness of this policy depends upon the price elasticity of demand
for the product.
• In the case of demerit goods, demand is invariably price inelastic. This
will affect the success of a minimum price scheme.
• To be more effective, the provision of information can operate
alongside fiscal measures to decrease consumption of demerit goods.
• The provision of information includes warnings and photographs
printed on the otherwise plain packets of tobacco products to deter
smoking; there is also information provided on the packaging of many
processed food products to indicate their sugar and salt content as well
as their nutritional qualities.
• Bottled water usually contains details of the composition of the
contents.
• Regulations are in place in many countries to restrict the consumption
of demerit goods.
• These regulations usually specify a minimum age limit for
consumption.
• Another way of restricting consumption is through production quotas.
• This involves limiting the quantity of goods that is produced.
• If the quota is set at a low level, the price of the product is likely to rise,
reducing the amount consumed.
• Licensing suppliers is also used to control supply. One problem of such
measures is that they can lead to informal market dealings.
POSITIVE PRODUCTION EXTERNALITIES
• Positive production externalities occur when producers create positive
spillover benefits to third parties.
• For example, inoculations; vaccines that have been developed to
combat serious medical conditions like polio, cholera and smallpox
benefit not only those receiving them but also the community as a
whole.
Subsidies and provision of information
• Figure 38.6 below shows how a subsidy to the firm generating these benefits can
correct market failure.
• MSC is below MPC. The market equilibrium is at PQ; the market under allocates
resources at this point.
• It is implied that the government should provide a subsidy to the firm equal to the
external benefit.
• As a result, there will be an increase in the quantity produced to Q1 and a lower
price at P1. Allocative efficiency is now being achieved.
• The size of the subsidy paid by the government is P1P2 yz.
Figure 38.6: Impact of a subsidy – positive production externalities
• Therefore, using subsidies is a way of increasing the supply of products
with positive production externalities.
• A second approach is to increase demand for products with positive
production externalities.
• Where a price is paid for a product, the subsidy will reduce the price of
the product and, in turn, lead to an increase in demand.
• Demand can also be increased through the provision of information.
•Positive consumption externalities
• A positive consumption externality occurs as a result of decisions taken
that impact favourably on third-party consumers.
Direct provision and subsidies
• The provision of secondary education is a good example of a positive consumption
externality.
• Being educated not only benefits the individual; it produces other spillover benefits
for the economy in the form of a better educated workforce that is likely to be more
productive and able to provide an important source of future economic growth.
• The effect of a subsidy where there are positive consumption
externalities is shown in Figure 38.7 below.
• The equilibrium without government intervention is at point x where
MPC = MPB.
• The marginal external benefit MEB is added to the MPB curve to give
the MSB, the marginal social benefit.
• The MSB represents society’s demand curve for the product.
Figure 38.7: Effects of a subsidy – positive consumption externalities
• With government subsidy, the supply curve shifts to the right from S to
S1.
• The marginal cost of supplying the good is reduced by the amount of
subsidy; the vertical distance yz is equal to the value of the subsidy.
• The equilibrium after the subsidy is at point z, which is where MPB
crosses S1.
• The optimal amount of goods Q1 is sold at the lower price of P1. This
is clearly more beneficial for consumers.
• In the case of education, legislation is used in some countries to make state-funded
education compulsory up to a certain age.
• Sadly, this is often not the case in many low-income countries.
• Information is also provided by governments to persuade consumers to buy more
goods that produce positive externalities.
• Government grants are available in some countries for students, often from low-
income families, to go to university.
• In most high-income countries, people are urged to eat more fruit and vegetables
and less meat to reduce the possible risk of health problems, such as diabetes and
obesity.
38.2 Other tools to correct market failure
• Other types of policies that governments use to correct market failure
include the following;
Behavioural insights and ‘nudge’ theory
• Nudge theory: a notion based on behavioural theory suggesting that
people can be encouraged to adopt behaviour that is beneficial for
society.
• It is a way of achieving beneficial economic and social outcomes without
the need for regulations.
• In the case of market failure, it can be applied through social media,
letters, emails or personal communications.
• A typical example is in the case of a free inoculation (merit good) that is
available to all people over 60 years old.
• These people can be targeted by a simple letter that makes them fully
aware of the benefits of having the inoculation and how they can get one.
• In this way, they are ‘nudged’; without such a nudge, take up would likely
be less and, over time, involve greater costs to the health service.
• A second example is in the case of a city that is seeking to reduce the
number of cars on its roads (negative externality).
• There could be a media campaign that focuses on the benefits of cycling
or of using other more environmentally acceptable forms of transport like
buses.
• This campaign could nudge motorists into using another form of urban
transport.
Direct provision of goods and services
• It was discussed earlier that the non-provision of public goods was
given as an example of market failure.
• This non-provision was the main reason for government intervention.
• Even if it were possible to charge for public goods, it would not be
socially desirable.
• Direct provision by the government is the only possibility.
• The case of merit goods such as healthcare and education is different.
• The government provides these goods and services free of charge or at
subsidised prices, particularly for low-income families.
• The reasons for this include:
Positive externalities. Third parties may benefit if someone is treated
for an infectious disease.
Family members and others in the community benefit through not being
infected.
Treatment may not occur if a charge is made.
Imperfect information. Many people do not appreciate how they can
benefit from a good education.
Families who have limited incomes and who have to pay for education
may choose to go without.
Providing education free of charge may increase uptake.
Similar arguments apply for providing free healthcare.
Wider economic benefits. Government provision of merit goods can
add to an economy’s quality of human capital.
 A healthy well educated population can have a positive impact of
the rate of economic growth.
• The direct provision of public goods and merit goods is therefore a very
relevant and widely applied way of correcting market failure.
Nationalisation and privatization
• Governments can take an industry into public ownership as a means of
correcting market failure. This is known as nationalisation.
• The market failure arises when the industry is not being run in the
public interest.
• It is argued that problems of externalities, for example, can be best dealt
with if a given industry is being managed by the public sector.
• Another method is privatisation as a way for governments to intervene
when there is market failure.
• Privatisation is the process whereby there is a change of ownership from
the nationalised public sector to the private sector.
• There are various perceived benefits of privatisation.
• It is maintained that breaking up a state monopoly will produce a better,
more efficient allocation of resources.
• Moreover, managers of private companies will be accountable to
shareholders.
• With state ownership, the public have only limited property rights over a
nationalised company.
• It is also believed that costs and consumer prices will be lower due to competition
in the market.
• Nationalisation and privatisation in certain situations can correct for market failure.
• It is difficult to say which is best. Globally, though, there has not been an
overwhelming move back to nationalisation. The focus of government policies to
control privatised industries has tended to be to use the range of methods of
intervention.
38.3 GOVERNMENT FAILURE IN MICROECONOMIC
INTERVENTION
• In principle, government policies to correct market failures make
economic sense.
• They increase economic efficiency in markets and are judged to be
economically desirable.
• In practice, however, not all government policies work out as planned.
This is known as government failure.
CAUSES AND CONSEQUENCES OF GOVERNMENT
FAILURE
• There are three main causes of government failure:
Imperfect information
Unintended consequences
Policy conflict.
Imperfect information
• Once the government starts to intervene in the running of markets, it needs
information.
• The correct policies can only be introduced if governments have the correct
information.
• The problem is that governments may have inaccurate or incomplete
information.
• Consequently, they may introduce policies that lead to economic
inefficiency.
• Some examples of this problem are:
There is a lack of information about the true cost or value of a
negative externality such as air pollution.
The problem is that it becomes very difficult to impose the correct
value of a tax that attempts to reduce production of a polluting firm.
For example. The wrong level of tax will lead to the wrong level of
production and an even greater inefficiency in the use of resources.
Governments may lack information about the consumer demand for a
merit good such as free healthcare.
If the government is providing a product free of charge to the
consumer, some estimation of the level of consumer demand is
required.
If it does not estimate the level of demand accurately, then the
wrong amount will be produced or funded; this is another case of an
inefficient allocation of resources.
Unintended consequences
• A further problem that arises with government intervention is that there can be
unintended consequences.
• These undesirable intentions can create inefficiencies.
• Some examples of the ways in which this can happen are:
The imposition of taxes can distort incentives.
High marginal rates of income tax can create disincentives for people to work
harder and so gain more income.
If this happens, then scarce resources are not being used to their best effect and
there is inefficiency.
Politicians are often seen as being motivated by the desire to remain in
government.
If this is so, then economic policies may be designed by governments
to try to retain power rather than to try to ensure maximum economic
efficiency.
For example, road pricing may be avoided due to a government’s fears
that its introduction could lead to a loss of electoral votes.
Policy conflict
• Government intervention in the running of the economy is often
justified by the need to reduce inequality.
• However, it is possible that government intervention might sometimes
increase existing inequality.
• This is simply understood by recognising that the imposition of any tax
will have a distributional impact.
• For example, a tax on energy use that aims to reduce harmful emissions
of greenhouse gases will have different effects on different groups of
people.
• If the tax is on domestic fuel, then older members of society may bear
the greatest effect as they use proportionately more fuel for heating than
others in society.
• This could be seen as unfair and increasing inequality in society.
• It is also possible to see how government failure can occur in the case
of subsidies on the costs of fossil fuels.
• These encourage production and their use in coal-fired power stations,
both of which contribute increased environmental pollution.
• The subsidies might enhance competitiveness of manufacturing
industries and keep workers in jobs, but they are completely
inconsistent with the need for more sustainable development policies.
• Another example is the case of air transport.
• Deregulation of markets in the US, EU and in many parts of Asia has
seen a large number of new firms enter the market.
• Fares are very competitive and encourage many more people to travel
by air.
• There are personal benefits for these people; however, there is clear
conflict with the need to conserve nonrenewable resources and cut
back on air transport’s emissions of greenhouse gases.
EXAM-STYLE QUESTIONS: MULTIPLE CHOICE
CHAPTER 39
EQUITY AND REDISTRIBUTION OF INCOME
AND WEALTH
LEARNING intentions
In this chapter you will learn how to:
• Explain the difference between equity and equality
• Explain the difference between equity and efficiency
• Analyse the distinction between absolute poverty and relative poverty
• Describe the poverty trap
• Evaluate policies towards equity and equality such as negative income tax, universal benefits and means-
tested benefits and universal basic income.
39.1 Equity, equality and efficiency
• Equity occurs if a society distributes its resources fairly among its people.
• The distribution could be of income, government benefits and even wealth.
• Equity has two aspects:
Horizontal equity where consumers and others with the same
circumstances should pay the same level of taxation.
Vertical equity where taxes should be fairly apportioned between the rich
and poor in a society.
• Equality is not the same as equity, Equality is about treating everyone
in the same way.
• Equality aims to promote fairness, but it can only work if everyone
starts from the same position and needs the same help.
• It is the ideal of everyone being truly equal.
• Efficiency was discussed above. It is where scarce resources are being
used to produce maximum output.
• Economic efficiency requires firms to produce at the lowest possible cost;
it also applies where firms produce goods and services that are most
wanted by consumers.
• The problem is that markets fail to produce the best allocation of resources
and require government intervention to correct for this failure.
• Government failure occurs when policies used to promote efficiency do so,
but also increase inequality.
• This situation can be found in markets here there are negative production
and consumption externalities.
39.2 Absolute and relative poverty
• Poverty exists when families do not have enough money or access to
resources to be able to experience a reasonable standard of living.
• This includes not only having food and housing, but also access to decent
education, healthcare, water supply and sanitation.
• Although global poverty is falling, it is still the case that people born in
poverty are much more likely to remain poor.
• A few may escape the so-called ‘cycle of poverty’ but these are the
exception.
• Extreme poverty is defined by the World Bank as ‘the international
poverty line of living on less than $1.90 per day’. (refer UN data)
• Absolute poverty is defined by economists as being when household
income is below a certain level that makes it impossible for a person or
family to meet the basic needs of life such as food, housing, water,
healthcare and education.
• In this state of poverty, those affected are unable to benefit from economic
growth and rising living standards.
• They are trapped in a cycle of poverty.
• It is not possible to put a given global value on the income level of
absolute poverty since this varies from one country to another.
• Relative poverty : situation in which household income falls below a
specified percentage of median adjusted household income.
• It compares the income of a household with the average income for
their country.
• Typically, where this is 50% or less than the average, the household is
said to be in relative poverty.
• Households have money, but only sufficient to meet basic needs.
• Their members are not able to enjoy the same standard and quality of life
as the rest of the population with incomes above 50% of the average.
• Access to consumer goods, housing and education is limited by a low
income.
• For a household in this type of poverty, change can come about as family
members get jobs or better paid jobs, sometimes due to better education.
39.3 Policies towards equity and equality
• it was analysed above how fiscal policies and state provision can attempt
to redistribute income and wealth. Additional fiscal policies are discussed
below.
The poverty trap, benefits and universal basic income
• One way to redistribute income is to pay benefits out of government
spending to those on low incomes.
• Money raised through the tax system is then paid to low-income persons
and families in order to increase their disposable income.
• There are three types of such benefits:
Means-tested benefits: These benefits are only paid to those on
low incomes.
They are targeted directly at those who are seen to be most in need. An example
would be income support or unemployment benefit.
However, such benefits are not always claimed by those for whom they are
designed.
They can also create a disincentive to work. This is called the poverty trap and is
where a person or family is financially worse off when one or more of members are
working rather than living off the range of benefits available to them.
• Universal benefits: These are paid out to everyone in certain
categories, often age-related, regardless of their income or wealth.
• Examples include universal state pensions and child benefit. Such
benefits overcome the two problems associated with means-tested
benefits.
• However, they imply paying out money to many who do not need it and
therefore tend to be expensive to operate
• Universal basic income: This is a relatively new form of
benefit. It is an unconditional cash payment made at regular
intervals by the government, regardless of earnings or
employment status.
• The principal advantage of this approach is that it reduces poverty and
income inequality while encouraging those receiving the benefit to enter
or stay in employment.
• It also recognises the roles of individuals managing families and caring
for older people.
• Critics argue that like transfer payments, universal payments are given to those who
do not need them, so depriving others who might need additional assistance.
Negative income tax
• Negative income tax is a way of dealing with the weaknesses of means-tested
and universal benefits.
• Under such a tax regime, there would be a flat rate of taxation (say 25%). Every
person or family would receive a fixed annual benefit (say $4000).
• If the tax paid on earnings is less than this annual benefit, then the person will
receive the difference from the government. This is why it is called a negative
income tax.
• Where the difference is positive, such as with high-income earners, then
this is the amount of tax that has to be paid to the government.
• Under such a system, people with a certain level of income would pay
no tax, and the tax rate would increase as their income grew above
that level. People with incomes below that level would receive payment
through the tax system.
• Although such a system has been discussed by economists in the UK and
the USA, no such system has yet been implemented because of logistical
and political problems.
• Poverty trap: a situation in which an individual has no
incentive to take a job or work longer hours because
the loss of benefits
and/or increase in tax payments outweighs the gain from
increased earnings .
EXAM-STYLE QUESTIONS: MULTIPLE CHOICE
CHAPTER 40
LABOUR MARKET FORCES AND
GOVERNMENT INTERVENTION
LEARNING INTENTIONS
In this chapter you will learn how to:
• Explain why the demand for labour is a derived demand
• Define the meaning of marginal revenue product (MRP)
• Calculate the marginal revenue product of labour and use marginal revenue product to derive an
individual firm’s demand for labour
• Analyse the factors affecting demand for labour in a firm or in an occupation
• Analyse the causes of shifts in the demand curve and
movements along the demand curve for labour in a firm or in
an occupation
• Analyse the factors affecting the supply of labour in a firm or
in an occupation, including wage and non-wage factors
• Analyse the causes of shifts in the supply curve and
movements along the supply curve for labour in a firm or in
an occupation
• Evaluate wage determination in imperfect markets, including the
influence of trade unions, government and monopsony employers
• Explain the determinants of wage differentials by labour market forces
• Define the meaning of transfer earnings and economic rent
• Evaluate the factors that affect transfer earnings and economic rent in
an occupation.
40.1 The demand for labour
• The demand for labour is a derived demand. This means that a firm’s
demand for labour is due to its decision to produce certain goods or services.
• Labour is therefore demanded not for its own sake, but because it is
essential for the production of goods or services.
• Clerks are employed because they are necessary for a firm to carry out its
day-to-day business; the streets need cleaning, therefore street cleaners are
employed; young people need education so teachers are required; and firms
need managers to meet their corporate objectives.
• These examples may seem obvious but it does underpin the whole basis of
labour economics.
The marginal revenue product of labour
• A profit maximising firm is keen to know the value of what it produces.
• Table 40.1 below shows the output that can be produced if a firm employs
up to six workers.
• The price of output is $10 per unit; the wage rate is fixed at $300 per week.
• This is the marginal cost of employing one more worker.
• It is assumed that labour is the only variable factor of production.
• The marginal revenue product (MRP) is the extra revenue earned by
the firm when it employs one more worker.
• It is calculated by multiplying the marginal product from an
additional worker by the price of the product.
Numbe
r
of
worker
s
Total
produc
t
Margin
al
product
Price
($)
Marginal
revenue
product
($)
Wage
Rate
($)
Contributio
n
($)
1 20 20 10 200 300 -100
2 55 35 10 350 300 50
3 99 44 10 440 300 140
4 129 30 10 300 300 0
5 153 24 10 240 300 -60
6 165 12 10 120 300 -180
• Data from Table 40.1 above is used to show the MRP curve in Figure 40.3.
• The MRP curve increases up to the point where three workers are
employed.
• It then falls steeply, consistent with the law of diminishing returns.
• There comes a point after the fourth worker has been employed that an
additional worker adds more to costs than to revenue.
• It still costs $300 to employ this worker but only an additional $240 of
output is produced. So above this level of employment, the value of the
marginal product is less than the wage being paid.
• This clearly makes no sense to the firm. It can therefore be deduced that
the firm should hire workers up to the point where the value of the
MRP equals the wage rate that is being paid.
• This point is where four workers are employed. The MRP curve is
therefore the demand curve for labour.
• Therefore, a firm should continue to hire labour as long as the
additional worker adds more to revenue than to the firm’s costs.
Figure 40.3: Marginal revenue product
ACTIVITY 40.1: Table 40.2 shows the total weekly output produced by a
firm using a different number of workers. The firm sells its product for $15
per unit and pays its workers $300 per week.
Number of
workers
Total output
1 8
2 20
3 40
4 55
5 65
6 72
Table 40.2: Total weekly output produced by a firm
1. Calculate the marginal product and the marginal revenue
product.
2. How many workers should the firm hire to maximise its
profits?
3. If the wage rate falls by 25%, how many more workers
should the firm employ?
Demand for labour in a firm or in an occupation
• The demand for labour by a firm is based on two assumptions:
The firm wishing to hire labour is operating in a perfectly
competitive market. There are many buyers and sellers of labour, and
no single firm or worker can affect the wage that is paid.
The firm is a profit maximiser. Its demand for labour is based on it
maximising the difference between total revenue and total costs.
• There are three main factors that determine the demand for labour in a
firm or in an occupation:
Wage rate. A wage rate is a type of price. It determines the quantity of
labour demanded by a firm.
A rise in the wage rate will increase labour costs and is likely to lead
to a fall in the quantity of labour demanded by a firm.
This is shown in Figure 40.4 below. At a wage rate of W, the
quantity of workers demanded by the firm is Q.
When the wage rate increases to W1, the quantity of workers
demanded falls to Q1.
A further increase in the wage rate to W2 reduces the quantity of
workers employed to Q2.
This process is used to derive a firm’s demand curve for labour. In
Figure 40.4, this is shown for the three different wage rates between
z and x.
Productivity. A change in the marginal productivity of labour affects
the position of the demand curve for labour.
If workers are more productive, output increases. Labour becomes a
more attractive resource for a firm and there is an increase in the
firm’s demand for workers.
If productivity drops then a firm will be forced to employ less
labour. The demand curve for labour will shift to the left.
Demand for the product. Given the derived demand for labour, it
follows that a change in demand for a firm’s products will affect its
demand for labour.
When demand for a product is high or is projected to increase, a
firm will take on more workers. The demand curve for labour will
shift to the right.
At a time of downturn in the economy, demand for a firm’s products
is expected to fall. In this case, the firm’s demand for labour will also
fall. The demand curve for labour will shift to the left.
Figure 40.4: A firm’s demand for labour.
40.2 The supply of labour
• The supply of labour is the total number of hours that labour is able
and willing to work for a particular wage rate.
• It should be remembered that the labour market involves people and
their willingness to participate (or otherwise) in the labour market.
• This decision usually depends upon the wage rate that they are
offered for their services, although for some workers the wage rate
has only a minor influence on their decision of whether to work –
other behavioural factors have a stronger influence.
• It is useful to consider labour supply at three levels:
1. Individual worker, that of
2. A firm or industry
3. The economy as a whole.
• Different factors affect labour supply depending upon which of these
levels is being considered.
The individual’s supply of labour
• As with any supply, price (or wage in this case) has an important
influence on the decision of any individual worker to enter the labour
market.
• If the wage is too low, an individual may determine that it is not worth
the effort of going to work and will decide to stay at home.
• Economic theory assumes that there is a positive relationship between
labour supply and the wage rate.
• So, as the wage rate increases, more people are willing to offer their
services to employers.
• This is represented by the individual’s labour supply curve, which
mainly slopes upwards (see Figure 40.5).
Figure 40.5: An individual’s labour supply curve
• Beyond a certain point, there is a trade-off between work and leisure.
• Individuals may decide that they would prefer to work less and have more time for
leisure.
• This point is indicated by the backward-sloping curve from point X.
• Before this point, an individual worker is more willing to supply labour as the wage
rate increases.
• It must be stressed that this point depends on the individual’s attitude to work and
leisure – point X on any individual’s supply curve will vary.
• It also depends on the type of economy and the worker’s personal and family
circumstances, especially the income that is required.
• A further factor is the income tax rate. In all countries, this tends to be
progressive.
• Low-wage workers pay little or no income tax. As wages rise, more of
the increase in wages is paid in income tax to the government.
• In some of the top high income countries, this higher rate is often well
above 50%. The downside is that a high income tax rate suppresses the
incentive to work.
• Governments must be very careful to avoid this situation as it is likely
Labour supply to a firm or industry
• The supply curve of labour to a firm or industry consists of the sum of the
individual supply curves of all workers employed in a firm or industry.
• As with an individual worker, the number of workers wanting to supply their
labour increases with the wage rate that is offered.
• The slope of this supply curve is measured by the elasticity of supply of labour,
the extent to which labour supply responds to a change in the wage rate.
• Figure 40.6 below shows two different supply curves – one inelastic (L1) and the
other (L2) elastic – with respect to the wages being paid.
• There are various reasons for this difference.
• An obvious one is the skills required to carry out a particular occupation.
• In general, the more skills required, the more inelastic will be the supply of
labour.
• This argument also applies to the amount of education and training that is
required to carry out a particular job.
• Normally, a teacher has to spend four years after college to obtain the necessary
qualifications. This means that the supply of teachers is more inelastic than, for
example, to street cleaners where little education or training is required.
• The supply curve L2 in Figure 40.6 below is therefore likely to be that
for an industry where wages are low and where there is a plentiful
supply of labour with no particular skills or training.
• In a competitive labour market, the wage rates offered in all other
industries will be important in determining the supply of labour to a
particular industry.
Figure 40.6: The supply curve of labour to a firm or an industry
The long-run supply of labour
• The long-run supply of labour is of particular significance for the
economy as a whole.
• There are contrasts between lower middle-income countries and high-
income countries, involving wider economic factors.
• These factors include:
• The size of the population. In most low-income and lower middle-
income countries, there is an increase in the overall supply of labour
mainly due to higher birth rates and improved medical care for
young children.
• Consequently, increasing numbers of young people join the labour
market. This means the long-run supply curve for labour shifts to the
right, indicating that more workers are willing to supply their labour at
a given wage rate.
• The labour participation rate. This term is used to describe the proportion of the
population of working age actually in employment.
• In some high-income countries, workers often choose to leave the labour market, by
taking ‘early retirement’.
• This is before the normal age for retirement, so reducing the labour participation
rate.
• More students are continuing their studies at university, a further cause of a
declining labour participation rate.
• A reduction in the labour participation rate will shift the long-run labour supply
curve to the left.
• The tax and benefits levels. As shown in Figure 40.5 above, there comes
a point where the work–leisure trade-off affects an individual’s labour
supply.
• This also affects the supply of labour for the economy, particularly in
high-income countries.
• The level of unemployment and benefits payments can also affect the
longrun supply of labour in a similar way as it can affect an individual’s
supply of labour.
• High tax and unemployment benefit discourage supply of labour.
• Immigration and emigration. Immigration and emigration affect the
long-run supply of labour in an economy.
• Emigration increases the supply of labour while immigration decreases
supply of labour.
NOTE:
• The above factors determine the long-run supply of labour. Shifts to the
left and to the right in the long-run supply of labour are shown in
Figure 40.7 below.
Figure 40.7: Shifts in the long-run supply of labour
• In the long run, the supply of labour to a particular firm, as distinct from the
economy, is influenced by the net advantages of a job.
• These include monetary and non-monetary advantages.
• Monetary advantages include:
The weekly wage or monthly salary is the most important reason for
supplying labour
Bonus payments,
Opportunities to work longer hours
Pension arrangements
• Non-monetary advantages include the following:
hours of work
job security
holiday entitlement
promotion prospects
location of the workplace
job satisfaction
whether the work can be done from home.
• A rational worker is likely to take both types of advantage into account
before making a decision on whether to supply labour.
• For many workers, the non-monetary advantages tend to have a
substantial influence on their choice of occupation.
40.3 WAGE DETERMINATION IN PERFECT MARKETS
• Two important features of the workings of labour markets have now
been established.
1. The wage paid to labour equals the value of the marginal
product of labour, the marginal revenue product.
2. The willingness of labour to supply their services to the labour
market is dependent upon the wage rate that is being offered.
HOW WAGES ARE DETERMINED IN A COMPETITIVE LABOUR
MARKET.
• Bringing demand and supply curves together for an industry shows how the
equilibrium wage is determined.
• Figure 40.8 below shows a downward-sloping labour demand curve based on
marginal revenue product theory, and an upward-sloping labour supply curve.
• Equilibrium is found at the intersection of demand and supply.
• If the wage is lower than W employers will not be able to fill all their
vacancies, and will have to offer a higher wage to attract more workers.
• If the wage is higher than W there will be an excess supply of labour, and
the wage will drift down until W is reached and equilibrium obtained.
• The demand curve reflects the value of the marginal productivity of
labour.
• In equilibrium, workers receive the value of their contribution to the
production of goods and services.
• Each firm therefore purchases labour until the value of the marginal
revenue product equals the wage rate.
• Therefore, the wage paid in the market must equal the value of the
marginal revenue product of labour once it has brought demand and
supply into equilibrium.
• The market therefore clears at the equilibrium wage.
• The labour market is dynamic like any market – any change in the
demand or the supply of labour will change the equilibrium wage.
• The value of the marginal revenue product of labour will also change by
the same amount as, by definition, it must always equal the wage rate.
• Take the case of the clothing industry.
• An increase in the disposable income of consumers in high-income countries will
shift the demand curve for clothing to the right, indicating that more will be
demanded at any price.
• In turn, this affects demand for workers producing clothing – this is shown in
Figure 40.9 by a shift to the right of the demand curve for labour.
• The outcome is that the equilibrium wage rises from W to W1, and employment
increases from L to L1.
• The change in the wage rate therefore reflects a change in the value of the marginal
productivity of labour.
Figure 40.9: Effects of an increase in demand for labour
• A change in the labour supply will also affect the market equilibrium.
• Suppose that there is an increase in the number of migrant workers
and that this increases the number of workers who are able to produce
clothing.
• When this happens, the labour supply curve shifts to the right.
• The increased supply of labour has a downward effect on wages,
making it more profitable for firms producing clothing to hire more
labour.
• As the number of workers increases, so their marginal productivity
falls, as does the value of their marginal revenue product.
• The outcome in this case is that wages are reduced for all workers,
although the level of employment rises.
• This is shown in Figure 40.10 below.
Figure 40.10: Effects of an increase in supply of labour
40.4 WAGE DETERMINATION IN IMPERFECT
MARKETS
• The analysis of how wages are determined has assumed that the respective
forces of demand and supply operate freely with no intervention.
• This is an unrealistic assumption as in many labour markets, the demand
and supply of labour are affected by the actions of trade unions and
governments.
• Such interventions produce what are sometimes referred to as
imperfections in the labour market.
Influence of trade unions on wage determination and
employment
• Trade unions are organisations that seek to represent labour in their place
of work.
• They were set up and continue to exist because individuals (labour) have
very little power to influence conditions of employment, including
wages.
• Through collective bargaining, where trade union representatives get
together with employers, trade unions aim to:
• Increase the wages of their members
• Improve working conditions
• Maintain pay differentials between skilled and unskilled
workers
• Fight job losses
• Provide a safe working environment
• Secure additional working benefits
• Prevent unfair dismissals.
• Traditionally, trade unions have been strong in the public sector and
most types of manufacturing; trade unions are less important in the
service sector.
• Trade unions are particularly strong in the transport industry and in
occupations where specialist skills are required.
• Trade unions tend to have most bargaining power where labour has
specialist skills or is in short supply.
• Economic analysis suggests that, in a competitive labour market, a
powerful trade union is able to secure wages for its members above the
equilibrium wage rate.
• The basis for this claim is shown in Figure 40.12 below. At the
equilibrium wage, the quantity of labour employed is L.
• If a strong trade union can force up wages to Wu, for example, which is
above the equilibrium, the number of workers who are offered jobs by
employers falls to Lu.
• At this wage, the number of people who would like to work is higher.
This is shown by Lc.
Figure 40.12: The effect of a strong trade union in a competitive labour market
• In practice, it is difficult to prove whether or not this theory actually
applies in real world labour markets.
• In many countries, such practices have been made illegal, so restricting
their to act in this way.
• Trade unions that try to behave in this way are accused of playing a
dangerous game with employers.
• The fear is that because of high labour costs and restrictive practices,
employers will go out of business or transfer production to countries
where wage levels are lower.
• This threat has been particularly severe for some European and US car
manufacturers – production has been switched from France and
Germany to other EU countries, such as Czech Republic, Poland,
Romania and Slovakia, where labour costs can be as little as one-fifth
of those in higher-income countries.
• Trade unions would appear to have had very little real influence in
these circumstances.
Influence of government on wage determination and
employment where there is a minimum wage.
• The labour market has seen explicit government intervention through the
introduction of a minimum wage.
• The aim of a minimum wage is to reduce poverty and the exploitation of
workers who have little or no bargaining power with their employers.
• In particular, many women employed in shops, small businesses and low
skill jobs, such as home working and cleaning, have been paid very low
wages.
• The introduction of a minimum wage has been of particular significance for
them.
• Whether there should be a minimum wage is controversial.
• It is argued that the amount of state benefits being paid to low-income
families is reduced with the introduction of a minimum wage.
• There might also be a small increase in tax revenue.
• Those against a minimum wage are not convinced by these arguments; they
believe that jobs are being lost and that other low-paid workers seek
increased pay to maintain their differential with the lowest paid.
• Cost-push inflation can occur when a minimum wage is implemented,
affecting the economy as a whole.
• The economics of a minimum wage are shown in Figure 40.13 belw.
• The effect on an industry is particularly dependent upon the elasticities of
demand and supply for labour in that industry.
• Figure 40.13a shows the effects when there is an inelastic demand for
labour.
• The loss of jobs is less than shown in Figure 40.13b where the demand for
labour is more wage elastic.
• In both cases there is an excess supply of labour at the higher minimum
wage.
• This excess is more pronounced in Figure 40.13b where both the
demand for and supply of labour are relatively elastic.
• It can also be seen that the higher the minimum wage rate is set above
the competitive equilibrium of $2.50, the greater will be the excess
supply of labour willing to work at the minimum wage.
Figure 40.13: The effects of the introduction of a minimum wage
• A problem is that sometimes a minimum wage is a national minimum wage.
• This means that it does not take into account variations in the cost of living in a country.
• In big cities, the cost of accommodation, food and other living costs are much higher than
elsewhere.
• Consequently, it is very difficult for workers to survive on the minimum wage alone unless
long hours are worked.
• Recently, a ‘living wage’ has been promoted. It is calculated on the basic cost of living, but
unlike the minimum wage, employers choose to pay this on a voluntary basis. The living
wage, however, is not the answer to poverty – it is just part of a package of measures including
a range of benefits designed to improve the standing of those who are most vulnerable.
Influence of monopsony employers on wage determination
and employment
• A monopsony occurs when there is a single or dominant buyer, in this
case of labour.
• The monopsonist buyer is able to determine the price or wage that is
paid for the workers who are employed.
• This is clearly an imperfect market situation.
• Figure 40.14 below shows how the monopsonist can affect the market
equilibrium.
• The monopsonist will hire workers by equating the marginal cost paid to employ
a worker with the marginal revenue product gained from this employment.
• This is the profit-maximizing position. The wage that the monopsonist pays to
hire labour is Wm.
• This wage rate is below what the employer should pay if workers are paid the
full value of their marginal revenue product, Wmrp.
• The level of employment is Lm.
Figure 40.14: A monopsony buyer of labour
• In this situation, the power of the employer in the labour market is of
overriding importance.
• The employer can set a low wage because of this buying power.
• Monopsonists often exist in local labour market situations.
• An example is where there is just one major employer in a town or where
workers may be employed in an extractive industry located well away from
where they normally live.
• In this way, the employer dominates the labour market, setting down wages
and all other conditions of employment.
40.5 WAGE DIFFERENTIALS
• It is very clear that in any economy there are differences in wages between
occupations.
• Wage differentials occur between industries, between firms in the same
industry and between different regions of a country.
• To some extent, wage differences can be explained in terms of demand and
supply.
• An occupation that is in high demand and low supply will pay a higher wage
rate than one where there is an abundant supply of workers.
• As well as the market forces of demand and supply, other causes ofwage
differentials are:
Bargaining strength. Most airline pilots are likely to be members of a
strong professional organisation or trade union are paid more than cleaners
have little or no bargaining power and can easily be replaced.
Education and training. Some occupations, especially those in
healthcare, legal services and teaching, require workers to undergo a long
period of training. It is only fair that this is reflected in the differential in
pay compared to other occupations where this is not a requirement.
Skilled and unskilled workers. Skilled workers are likely to be paid more
than unskilled workers because demand for skilled workers is higher and
their supply is often less.
Male and female workers. Despite equal pay legislation in many countries,
men are still paid more than women in many occupations because the MRP
of women is lower.
Hours of work. Part-time workers on average are paid lower wage rates
than full-time workers.
Government policy. This widens wage differential between these workers
and others in similar occupations.
40.6 TRANSFER EARNINGS AND ECONOMIC RENT
Transfer earnings: this is the minimum payment necessary
to keep
labour in its present use.
• Economic rent : a payment received by a factor of production over
and above what would be needed to keep it in its present use.
It is any payment to labour which is over and above transfer
earnings.
• Transfer earnings and economic rent are shown in Figure 40.15(a)
below.
• Transfer earnings are indicated by the area under the labour supply
curve which is upward sloping.
• Although the equilibrium wage is W, at wage rates below this there are
workers who are willing to offer their services to employers.
• In fact, at any wage rate from zero upwards, workers will join the
labour market, until at wage W, L quantity of labour is available.
• In all cases up to W, the wage that a worker receives is their best alternative.
• For those workers willing to work for less than W, then any wages they get
over and above what they will accept is their economic rent.
• This is shown by the triangular area in Figure 40.15(a).
• Different workers receive different amounts of transfer earnings and
economic rent even in the same job. Take a bus driver as an example.
• Some people are very willing to drive buses for a low wage. These workers
have low transfer earnings and some economic rent.
• The case of superstars can be explained using Figure 40.15(b).
• Such people have a scarce unique talent. Their labour supply curve is
perfectly inelastic; their earnings consist entirely of economic rent.
• In contrast, workers with a perfectly elastic supply, such as many
unskilled workers and others in menial jobs, have no economic rent as
their earnings consist entirely of transfer earnings.
• Employers can hire an infinite supply of labour at the market wage W.
This situation is shown in Figure 40.15(c).
EXAM-STYLE QUESTIONS: MULTIPLE CHOICE.
Unit 8
End-of-unit questions
DATA EXAM-STYLE QUESTIONS: DATA
RESPONSE AND ESSAY RESPONSE AND ESSAY
End of unit
Unit 8
A2 UNIT  8. ECONOMICS FOR A LEVEL CAMBRIDGE

A2 UNIT 8. ECONOMICS FOR A LEVEL CAMBRIDGE

  • 1.
  • 2.
    CHAPTER 38 GOVERNMENT POLICIESTO ACHIEVE EFFICIENT RESOURCE ALLOCATION AND CORRECT MARKET FAILURE
  • 3.
    LEARNING INTENTIONS In thischapter you will learn how to: • Explain how a range of tools can be used to correct the different forms of market failure, including specific and ad valorem indirect taxes, subsidies, price controls, production quotas, prohibitions and licences, regulation and deregulation, direct provision, pollution permits, property rights, nationalisation and privatisation, provision of information and behavioural insights and ‘nudge’ theory • Evaluate the effectiveness of the tools used to correct market failure • Define the meaning of government failure in microeconomic intervention • Explain the causes and consequences of government failure.
  • 4.
    • Some methodsof government intervention and their effects on markets were introduced in AS level (Sections 13.1 to 13.6.) • The meaning of market failure and the nature of negative and positive externalities were explained in Sections 32.6 and 33.3. • This chapter builds upon this content; its focus is to explain and evaluate the tools that governments use to correct market failure in order to achieve an efficient allocation of resources.
  • 5.
    • In principle,the free market mechanism should produce the best allocation of resources. • The reality is that, increasingly, this is not so. • Consequently, the market mechanism needs to be supported by many forms of government intervention in order to correct its failings.
  • 6.
    38.1 GOVERNMENT POLICIESTO CORRECT NEGATIVE AND POSITIVE EXTERNALITIES • Many government interventions are used to correct market failure due to externalities. The main interventions include: specific and ad valorem indirect taxes Subsidies Regulations pollution permits property rights provision of information. • These are just some of the ever-increasing ways that governments are using to correct market failures due to externalities.
  • 7.
    NEGATIVE PRODUCTION EXTERNALITIES •A common situation of market failure is where there are negative production externalities. • An example of a negative production externality is where a firm illegally disposes of toxic waste, emitting toxic fumes into the atmosphere. • Another example is where the over-use of pesticides by farmers contaminates water supplies. If this water is then untreated and consumed by local people, its consumption could cause cholera and possible loss of life.
  • 8.
    Specific and advalorem indirect taxes • One way to correct for this type of externality is that the government should tax those activities where too much is being produced. • An indirect tax should be imposed on the individual or on the firm that has caused the negative externality. • The tax should ideally be equal to the marginal external cost. • This tax, which is often referred to as a Pigouvian tax, is designed to internalise the externality – this means that firms pay the cost of the externalities that they have caused to third parties.
  • 9.
    • Figure 38.2shows the effects of imposing an ad valorem green or pollution tax on the firm whose actions have caused the discharge of toxic waste. • MPC and MSC diverge as output increases since the tax is levied on the quantity of output. • The tax is added to the cost of producing the product; the supply curve MSC is now equal to the MPC plus this tax. • Figure 38.2 shows that the price at which the product is sold has increased from P to P1. This is less than the tax applied by the government.
  • 10.
    • At firstsight this may appear illogical, but the producer has accepted a cut in the price received from P to P2. The producer has borne the burden of part of the tax. • The total tax paid is equal to the area P2P1yz, of which the consumer’s share of the burden is PP1yx and the producer’s share is P2Pxz. • The effect of the negative externality is now internalised within the market. This is an ideal situation.
  • 11.
    Figure 38.2: Agreen tax – negative production externalities.
  • 12.
    • In practice,the big problem is being able to know or estimate the exact value of the tax that is to be imposed. • This problem arises because of the issue of putting realistic monetary values on the costs of externalities. • For example, what is the price of clean, unpolluted air? Because of this problem, the size of the pollution tax that is imposed may be less than the marginal external cost. • This would mean that the market failure was only partially resolved.
  • 13.
    • The taxcould even be greater than the MEC; this too would not be an efficient solution to the problem. • This estimation issue is a cause of government failure. • A second problem is that a green tax will not be effective if the demand for the product being taxed has a price inelastic demand. • An example is diesel fuel which is essential for owners of vehicles with diesel engines. The additional charge will end up being paid for by consumers.
  • 14.
    • If theproduct being taxed is more price elastic, the green tax is more likely to result in a switch of consumption to the products of less polluting firms. • The international competitiveness of products subjected to green taxes should also be considered. • A country with high green taxes may find that its exports suffer from cheaper goods that are produced elsewhere where there may be no such taxes.
  • 15.
    Regulations • Regulations andthe work of regulatory bodies is another way to overcome market failures caused by negative production externalities. • Consider the case of a mining company that pollutes the surrounding countryside. • The government might intervene by setting standards that restrict the amount of polluted waste that can be legally dumped. • The government would then need to regulate and inspect the company to make sure that these restrictions are enforced.
  • 16.
    • If regulationsare being abused, a regulatory body can impose large fines on the company. • If the damage persists, the firm could be forced to close. • Exhaust fumes from vehicles pollute the atmosphere and, to reduce this problem, governments set legal limits on the amount of carbon particles that are emitted from a vehicle’s exhaust system. • Collectively, this type of regulation is sometimes referred to
  • 17.
    • Deregulation involvesthe removal of any regulations that act as barriers to entry for new firms seeking to enter a market. • The purpose of deregulation is to encourage competition between new firms and those that are established in an industry. • New firms are likely to be more efficient; prices will fall and the polluting firms are likely to be forced to exit the industry as they are unable to compete.
  • 18.
    •Property rights • Thisis a further way in which a market-based solution can be used to correct negative production externalities. • It involves property rights, the term used to indicate how owners can use their assets. • If a property right can be established, a market solution can usually be reached through agreement to extend these property rights to those causing the negative externality. • In many cases, property rights cannot be established, such as in cases involving the air and sea.
  • 19.
    • The absenceof property rights leads to negative externalities of production. • By changing or extending property rights, owners of property can prevent others from imposing costs on their property or they could charge them if they do impose costs.
  • 20.
    Two possibilities canoccur: 1. If a polluting firm has property rights, then those who are affected by its activities could pay the polluter to reduce the scale of activity and therefore the pollution. In principle the polluter would require payment equal to the loss of profit. 2. If those affected by negative externalities are assigned property rights, then a polluting firm may be sued and obliged to compensate them in some way. In principle the charge would be equal to the marginal external cost.
  • 21.
    Pollution permits • Afourth form of intervention is through pollution permits, or tradable permits, whereby polluting firms are provided with a permit to produce a given level of pollution. • This can apply to polluting the air or water. • Unlike indirect taxation and regulations, pollution permits are a market based solution as they can be bought and sold.
  • 22.
    • The permitsare also subjected to a given level of allowable pollution. • The system is referred to as a ‘cap and trade’ system. • A recent example of a ‘cap and trade’ system is China’s Emission Trading Scheme (ETS). Figure 38.3 shows how the ‘cap and trade’ system operates. When introduced, the supply of pollution permits is S with a demand of D.
  • 23.
    The market priceis therefore P. Assume over time that demand increases to D1 (more pollutants are being emitted due to production growth). With supply fixed at S, the price rises to P1, giving every incentive to polluting firms to be more environmentally efficient. Hence, the supply curve shifts left to S1, with the price of permits rising to P2. This puts even more financial pressure on firms to invest in cleaner technologies, so cutting down on greenhouse gas emissions.
  • 24.
    • Figure 38.3:Market for tradable pollution permits
  • 25.
    • The useof pollution permits has many attractions but they are not without their critics. • The European Union’s (EU) Emissions Trading System (ETS) has suffered at times from an oversupply of permits, mainly as a consequence of a decline in industrial production coincident with recession in 2008 and 2013. • As the EU moved out of recession, the price of permits increased.
  • 26.
    NEGATIVE CONSUMPTION EXTERNALITIES •These externalities are the spillover costs caused by the consumption of demerit goods. • An example is the case of passive smoking and its effects on non-smokers; there is also the problem of aircraft noise, which can seriously affect the lifestyles of people who live close to a major airport, many of whom may never travel by air. • Road congestion is another example. As individual road users ‘consume’ road space, this reduces the amount of road space that is available to other vehicles.
  • 27.
    Specific indirect taxes •Negative consumption externalities created by one group of consumers reduce the private benefit of others. • One remedy is to impose an indirect tax, usually a specific tax, on consumers of demerit goods. • Figure 38.5 below shows this situation. Due to external costs in the market, MSB is below MPB. • The market equilibrium is at P and Q where MPB equals MPC. • The social optimum output is below Q at Q1 where MSB and MSC intersect.
  • 28.
    • This caseof market failure can be corrected by imposing an indirect tax equal to YZ on those responsible for the negative consumption externality. • The supply curve then shifts to the left; the market price increases to P1 resulting in a fall in quantity consumed to Q1. • This now gives a socially efficient allocation of resources.
  • 29.
    Figure 38.5: Effectsof an indirect tax – negative consumption externalities.
  • 30.
    Price controls, provisionof information and production quotas • Another fiscal device is to impose a minimum price on products that generate negative externalities of consumption. • This intervention occurs in many countries to limit the consumption of high-sugar energy drinks and tobacco products such as cigarettes. • The minimum price increases the price to consumers above the point where MPB = MSC. • The effectiveness of this policy depends upon the price elasticity of demand for the product.
  • 31.
    • In thecase of demerit goods, demand is invariably price inelastic. This will affect the success of a minimum price scheme. • To be more effective, the provision of information can operate alongside fiscal measures to decrease consumption of demerit goods. • The provision of information includes warnings and photographs printed on the otherwise plain packets of tobacco products to deter smoking; there is also information provided on the packaging of many processed food products to indicate their sugar and salt content as well as their nutritional qualities.
  • 32.
    • Bottled waterusually contains details of the composition of the contents. • Regulations are in place in many countries to restrict the consumption of demerit goods. • These regulations usually specify a minimum age limit for consumption. • Another way of restricting consumption is through production quotas. • This involves limiting the quantity of goods that is produced.
  • 33.
    • If thequota is set at a low level, the price of the product is likely to rise, reducing the amount consumed. • Licensing suppliers is also used to control supply. One problem of such measures is that they can lead to informal market dealings.
  • 34.
    POSITIVE PRODUCTION EXTERNALITIES •Positive production externalities occur when producers create positive spillover benefits to third parties. • For example, inoculations; vaccines that have been developed to combat serious medical conditions like polio, cholera and smallpox benefit not only those receiving them but also the community as a whole.
  • 35.
    Subsidies and provisionof information • Figure 38.6 below shows how a subsidy to the firm generating these benefits can correct market failure. • MSC is below MPC. The market equilibrium is at PQ; the market under allocates resources at this point. • It is implied that the government should provide a subsidy to the firm equal to the external benefit. • As a result, there will be an increase in the quantity produced to Q1 and a lower price at P1. Allocative efficiency is now being achieved. • The size of the subsidy paid by the government is P1P2 yz.
  • 36.
    Figure 38.6: Impactof a subsidy – positive production externalities
  • 37.
    • Therefore, usingsubsidies is a way of increasing the supply of products with positive production externalities. • A second approach is to increase demand for products with positive production externalities. • Where a price is paid for a product, the subsidy will reduce the price of the product and, in turn, lead to an increase in demand. • Demand can also be increased through the provision of information.
  • 38.
    •Positive consumption externalities •A positive consumption externality occurs as a result of decisions taken that impact favourably on third-party consumers. Direct provision and subsidies • The provision of secondary education is a good example of a positive consumption externality. • Being educated not only benefits the individual; it produces other spillover benefits for the economy in the form of a better educated workforce that is likely to be more productive and able to provide an important source of future economic growth.
  • 39.
    • The effectof a subsidy where there are positive consumption externalities is shown in Figure 38.7 below. • The equilibrium without government intervention is at point x where MPC = MPB. • The marginal external benefit MEB is added to the MPB curve to give the MSB, the marginal social benefit. • The MSB represents society’s demand curve for the product.
  • 40.
    Figure 38.7: Effectsof a subsidy – positive consumption externalities
  • 41.
    • With governmentsubsidy, the supply curve shifts to the right from S to S1. • The marginal cost of supplying the good is reduced by the amount of subsidy; the vertical distance yz is equal to the value of the subsidy. • The equilibrium after the subsidy is at point z, which is where MPB crosses S1. • The optimal amount of goods Q1 is sold at the lower price of P1. This is clearly more beneficial for consumers.
  • 42.
    • In thecase of education, legislation is used in some countries to make state-funded education compulsory up to a certain age. • Sadly, this is often not the case in many low-income countries. • Information is also provided by governments to persuade consumers to buy more goods that produce positive externalities. • Government grants are available in some countries for students, often from low- income families, to go to university. • In most high-income countries, people are urged to eat more fruit and vegetables and less meat to reduce the possible risk of health problems, such as diabetes and obesity.
  • 43.
    38.2 Other toolsto correct market failure • Other types of policies that governments use to correct market failure include the following; Behavioural insights and ‘nudge’ theory • Nudge theory: a notion based on behavioural theory suggesting that people can be encouraged to adopt behaviour that is beneficial for society.
  • 44.
    • It isa way of achieving beneficial economic and social outcomes without the need for regulations. • In the case of market failure, it can be applied through social media, letters, emails or personal communications. • A typical example is in the case of a free inoculation (merit good) that is available to all people over 60 years old. • These people can be targeted by a simple letter that makes them fully aware of the benefits of having the inoculation and how they can get one.
  • 45.
    • In thisway, they are ‘nudged’; without such a nudge, take up would likely be less and, over time, involve greater costs to the health service. • A second example is in the case of a city that is seeking to reduce the number of cars on its roads (negative externality). • There could be a media campaign that focuses on the benefits of cycling or of using other more environmentally acceptable forms of transport like buses. • This campaign could nudge motorists into using another form of urban transport.
  • 46.
    Direct provision ofgoods and services • It was discussed earlier that the non-provision of public goods was given as an example of market failure. • This non-provision was the main reason for government intervention. • Even if it were possible to charge for public goods, it would not be socially desirable. • Direct provision by the government is the only possibility.
  • 47.
    • The caseof merit goods such as healthcare and education is different. • The government provides these goods and services free of charge or at subsidised prices, particularly for low-income families. • The reasons for this include: Positive externalities. Third parties may benefit if someone is treated for an infectious disease. Family members and others in the community benefit through not being infected. Treatment may not occur if a charge is made.
  • 48.
    Imperfect information. Manypeople do not appreciate how they can benefit from a good education. Families who have limited incomes and who have to pay for education may choose to go without. Providing education free of charge may increase uptake. Similar arguments apply for providing free healthcare.
  • 49.
    Wider economic benefits.Government provision of merit goods can add to an economy’s quality of human capital.  A healthy well educated population can have a positive impact of the rate of economic growth. • The direct provision of public goods and merit goods is therefore a very relevant and widely applied way of correcting market failure.
  • 50.
    Nationalisation and privatization •Governments can take an industry into public ownership as a means of correcting market failure. This is known as nationalisation. • The market failure arises when the industry is not being run in the public interest. • It is argued that problems of externalities, for example, can be best dealt with if a given industry is being managed by the public sector.
  • 51.
    • Another methodis privatisation as a way for governments to intervene when there is market failure. • Privatisation is the process whereby there is a change of ownership from the nationalised public sector to the private sector. • There are various perceived benefits of privatisation. • It is maintained that breaking up a state monopoly will produce a better, more efficient allocation of resources. • Moreover, managers of private companies will be accountable to shareholders.
  • 52.
    • With stateownership, the public have only limited property rights over a nationalised company. • It is also believed that costs and consumer prices will be lower due to competition in the market. • Nationalisation and privatisation in certain situations can correct for market failure. • It is difficult to say which is best. Globally, though, there has not been an overwhelming move back to nationalisation. The focus of government policies to control privatised industries has tended to be to use the range of methods of intervention.
  • 53.
    38.3 GOVERNMENT FAILUREIN MICROECONOMIC INTERVENTION • In principle, government policies to correct market failures make economic sense. • They increase economic efficiency in markets and are judged to be economically desirable. • In practice, however, not all government policies work out as planned. This is known as government failure.
  • 54.
    CAUSES AND CONSEQUENCESOF GOVERNMENT FAILURE • There are three main causes of government failure: Imperfect information Unintended consequences Policy conflict.
  • 55.
    Imperfect information • Oncethe government starts to intervene in the running of markets, it needs information. • The correct policies can only be introduced if governments have the correct information. • The problem is that governments may have inaccurate or incomplete information. • Consequently, they may introduce policies that lead to economic inefficiency.
  • 56.
    • Some examplesof this problem are: There is a lack of information about the true cost or value of a negative externality such as air pollution. The problem is that it becomes very difficult to impose the correct value of a tax that attempts to reduce production of a polluting firm. For example. The wrong level of tax will lead to the wrong level of production and an even greater inefficiency in the use of resources.
  • 57.
    Governments may lackinformation about the consumer demand for a merit good such as free healthcare. If the government is providing a product free of charge to the consumer, some estimation of the level of consumer demand is required. If it does not estimate the level of demand accurately, then the wrong amount will be produced or funded; this is another case of an inefficient allocation of resources.
  • 58.
    Unintended consequences • Afurther problem that arises with government intervention is that there can be unintended consequences. • These undesirable intentions can create inefficiencies. • Some examples of the ways in which this can happen are: The imposition of taxes can distort incentives. High marginal rates of income tax can create disincentives for people to work harder and so gain more income. If this happens, then scarce resources are not being used to their best effect and there is inefficiency.
  • 59.
    Politicians are oftenseen as being motivated by the desire to remain in government. If this is so, then economic policies may be designed by governments to try to retain power rather than to try to ensure maximum economic efficiency. For example, road pricing may be avoided due to a government’s fears that its introduction could lead to a loss of electoral votes.
  • 60.
    Policy conflict • Governmentintervention in the running of the economy is often justified by the need to reduce inequality. • However, it is possible that government intervention might sometimes increase existing inequality. • This is simply understood by recognising that the imposition of any tax will have a distributional impact.
  • 61.
    • For example,a tax on energy use that aims to reduce harmful emissions of greenhouse gases will have different effects on different groups of people. • If the tax is on domestic fuel, then older members of society may bear the greatest effect as they use proportionately more fuel for heating than others in society. • This could be seen as unfair and increasing inequality in society.
  • 62.
    • It isalso possible to see how government failure can occur in the case of subsidies on the costs of fossil fuels. • These encourage production and their use in coal-fired power stations, both of which contribute increased environmental pollution. • The subsidies might enhance competitiveness of manufacturing industries and keep workers in jobs, but they are completely inconsistent with the need for more sustainable development policies.
  • 63.
    • Another exampleis the case of air transport. • Deregulation of markets in the US, EU and in many parts of Asia has seen a large number of new firms enter the market. • Fares are very competitive and encourage many more people to travel by air. • There are personal benefits for these people; however, there is clear conflict with the need to conserve nonrenewable resources and cut back on air transport’s emissions of greenhouse gases.
  • 64.
  • 65.
    CHAPTER 39 EQUITY ANDREDISTRIBUTION OF INCOME AND WEALTH LEARNING intentions In this chapter you will learn how to: • Explain the difference between equity and equality • Explain the difference between equity and efficiency • Analyse the distinction between absolute poverty and relative poverty • Describe the poverty trap • Evaluate policies towards equity and equality such as negative income tax, universal benefits and means- tested benefits and universal basic income.
  • 66.
    39.1 Equity, equalityand efficiency • Equity occurs if a society distributes its resources fairly among its people. • The distribution could be of income, government benefits and even wealth. • Equity has two aspects: Horizontal equity where consumers and others with the same circumstances should pay the same level of taxation. Vertical equity where taxes should be fairly apportioned between the rich and poor in a society.
  • 67.
    • Equality isnot the same as equity, Equality is about treating everyone in the same way. • Equality aims to promote fairness, but it can only work if everyone starts from the same position and needs the same help. • It is the ideal of everyone being truly equal. • Efficiency was discussed above. It is where scarce resources are being used to produce maximum output.
  • 68.
    • Economic efficiencyrequires firms to produce at the lowest possible cost; it also applies where firms produce goods and services that are most wanted by consumers. • The problem is that markets fail to produce the best allocation of resources and require government intervention to correct for this failure. • Government failure occurs when policies used to promote efficiency do so, but also increase inequality. • This situation can be found in markets here there are negative production and consumption externalities.
  • 69.
    39.2 Absolute andrelative poverty • Poverty exists when families do not have enough money or access to resources to be able to experience a reasonable standard of living. • This includes not only having food and housing, but also access to decent education, healthcare, water supply and sanitation. • Although global poverty is falling, it is still the case that people born in poverty are much more likely to remain poor. • A few may escape the so-called ‘cycle of poverty’ but these are the exception.
  • 70.
    • Extreme povertyis defined by the World Bank as ‘the international poverty line of living on less than $1.90 per day’. (refer UN data) • Absolute poverty is defined by economists as being when household income is below a certain level that makes it impossible for a person or family to meet the basic needs of life such as food, housing, water, healthcare and education. • In this state of poverty, those affected are unable to benefit from economic growth and rising living standards. • They are trapped in a cycle of poverty.
  • 71.
    • It isnot possible to put a given global value on the income level of absolute poverty since this varies from one country to another. • Relative poverty : situation in which household income falls below a specified percentage of median adjusted household income. • It compares the income of a household with the average income for their country. • Typically, where this is 50% or less than the average, the household is said to be in relative poverty.
  • 72.
    • Households havemoney, but only sufficient to meet basic needs. • Their members are not able to enjoy the same standard and quality of life as the rest of the population with incomes above 50% of the average. • Access to consumer goods, housing and education is limited by a low income. • For a household in this type of poverty, change can come about as family members get jobs or better paid jobs, sometimes due to better education.
  • 73.
    39.3 Policies towardsequity and equality • it was analysed above how fiscal policies and state provision can attempt to redistribute income and wealth. Additional fiscal policies are discussed below. The poverty trap, benefits and universal basic income • One way to redistribute income is to pay benefits out of government spending to those on low incomes. • Money raised through the tax system is then paid to low-income persons and families in order to increase their disposable income.
  • 74.
    • There arethree types of such benefits: Means-tested benefits: These benefits are only paid to those on low incomes. They are targeted directly at those who are seen to be most in need. An example would be income support or unemployment benefit. However, such benefits are not always claimed by those for whom they are designed. They can also create a disincentive to work. This is called the poverty trap and is where a person or family is financially worse off when one or more of members are working rather than living off the range of benefits available to them.
  • 75.
    • Universal benefits:These are paid out to everyone in certain categories, often age-related, regardless of their income or wealth. • Examples include universal state pensions and child benefit. Such benefits overcome the two problems associated with means-tested benefits. • However, they imply paying out money to many who do not need it and therefore tend to be expensive to operate
  • 76.
    • Universal basicincome: This is a relatively new form of benefit. It is an unconditional cash payment made at regular intervals by the government, regardless of earnings or employment status. • The principal advantage of this approach is that it reduces poverty and income inequality while encouraging those receiving the benefit to enter or stay in employment. • It also recognises the roles of individuals managing families and caring for older people.
  • 77.
    • Critics arguethat like transfer payments, universal payments are given to those who do not need them, so depriving others who might need additional assistance. Negative income tax • Negative income tax is a way of dealing with the weaknesses of means-tested and universal benefits. • Under such a tax regime, there would be a flat rate of taxation (say 25%). Every person or family would receive a fixed annual benefit (say $4000). • If the tax paid on earnings is less than this annual benefit, then the person will receive the difference from the government. This is why it is called a negative income tax.
  • 78.
    • Where thedifference is positive, such as with high-income earners, then this is the amount of tax that has to be paid to the government. • Under such a system, people with a certain level of income would pay no tax, and the tax rate would increase as their income grew above that level. People with incomes below that level would receive payment through the tax system. • Although such a system has been discussed by economists in the UK and the USA, no such system has yet been implemented because of logistical and political problems.
  • 79.
    • Poverty trap:a situation in which an individual has no incentive to take a job or work longer hours because the loss of benefits and/or increase in tax payments outweighs the gain from increased earnings . EXAM-STYLE QUESTIONS: MULTIPLE CHOICE
  • 80.
    CHAPTER 40 LABOUR MARKETFORCES AND GOVERNMENT INTERVENTION LEARNING INTENTIONS In this chapter you will learn how to: • Explain why the demand for labour is a derived demand • Define the meaning of marginal revenue product (MRP) • Calculate the marginal revenue product of labour and use marginal revenue product to derive an individual firm’s demand for labour • Analyse the factors affecting demand for labour in a firm or in an occupation
  • 81.
    • Analyse thecauses of shifts in the demand curve and movements along the demand curve for labour in a firm or in an occupation • Analyse the factors affecting the supply of labour in a firm or in an occupation, including wage and non-wage factors • Analyse the causes of shifts in the supply curve and movements along the supply curve for labour in a firm or in an occupation
  • 82.
    • Evaluate wagedetermination in imperfect markets, including the influence of trade unions, government and monopsony employers • Explain the determinants of wage differentials by labour market forces • Define the meaning of transfer earnings and economic rent • Evaluate the factors that affect transfer earnings and economic rent in an occupation.
  • 83.
    40.1 The demandfor labour • The demand for labour is a derived demand. This means that a firm’s demand for labour is due to its decision to produce certain goods or services. • Labour is therefore demanded not for its own sake, but because it is essential for the production of goods or services. • Clerks are employed because they are necessary for a firm to carry out its day-to-day business; the streets need cleaning, therefore street cleaners are employed; young people need education so teachers are required; and firms need managers to meet their corporate objectives.
  • 84.
    • These examplesmay seem obvious but it does underpin the whole basis of labour economics. The marginal revenue product of labour • A profit maximising firm is keen to know the value of what it produces. • Table 40.1 below shows the output that can be produced if a firm employs up to six workers. • The price of output is $10 per unit; the wage rate is fixed at $300 per week.
  • 85.
    • This isthe marginal cost of employing one more worker. • It is assumed that labour is the only variable factor of production. • The marginal revenue product (MRP) is the extra revenue earned by the firm when it employs one more worker. • It is calculated by multiplying the marginal product from an additional worker by the price of the product.
  • 86.
    Numbe r of worker s Total produc t Margin al product Price ($) Marginal revenue product ($) Wage Rate ($) Contributio n ($) 1 20 2010 200 300 -100 2 55 35 10 350 300 50 3 99 44 10 440 300 140 4 129 30 10 300 300 0 5 153 24 10 240 300 -60 6 165 12 10 120 300 -180
  • 87.
    • Data fromTable 40.1 above is used to show the MRP curve in Figure 40.3. • The MRP curve increases up to the point where three workers are employed. • It then falls steeply, consistent with the law of diminishing returns. • There comes a point after the fourth worker has been employed that an additional worker adds more to costs than to revenue. • It still costs $300 to employ this worker but only an additional $240 of output is produced. So above this level of employment, the value of the marginal product is less than the wage being paid.
  • 88.
    • This clearlymakes no sense to the firm. It can therefore be deduced that the firm should hire workers up to the point where the value of the MRP equals the wage rate that is being paid. • This point is where four workers are employed. The MRP curve is therefore the demand curve for labour. • Therefore, a firm should continue to hire labour as long as the additional worker adds more to revenue than to the firm’s costs.
  • 89.
    Figure 40.3: Marginalrevenue product
  • 90.
    ACTIVITY 40.1: Table40.2 shows the total weekly output produced by a firm using a different number of workers. The firm sells its product for $15 per unit and pays its workers $300 per week. Number of workers Total output 1 8 2 20 3 40 4 55 5 65 6 72
  • 91.
    Table 40.2: Totalweekly output produced by a firm 1. Calculate the marginal product and the marginal revenue product. 2. How many workers should the firm hire to maximise its profits? 3. If the wage rate falls by 25%, how many more workers should the firm employ?
  • 92.
    Demand for labourin a firm or in an occupation • The demand for labour by a firm is based on two assumptions: The firm wishing to hire labour is operating in a perfectly competitive market. There are many buyers and sellers of labour, and no single firm or worker can affect the wage that is paid. The firm is a profit maximiser. Its demand for labour is based on it maximising the difference between total revenue and total costs.
  • 93.
    • There arethree main factors that determine the demand for labour in a firm or in an occupation: Wage rate. A wage rate is a type of price. It determines the quantity of labour demanded by a firm. A rise in the wage rate will increase labour costs and is likely to lead to a fall in the quantity of labour demanded by a firm. This is shown in Figure 40.4 below. At a wage rate of W, the quantity of workers demanded by the firm is Q.
  • 94.
    When the wagerate increases to W1, the quantity of workers demanded falls to Q1. A further increase in the wage rate to W2 reduces the quantity of workers employed to Q2. This process is used to derive a firm’s demand curve for labour. In Figure 40.4, this is shown for the three different wage rates between z and x.
  • 95.
    Productivity. A changein the marginal productivity of labour affects the position of the demand curve for labour. If workers are more productive, output increases. Labour becomes a more attractive resource for a firm and there is an increase in the firm’s demand for workers. If productivity drops then a firm will be forced to employ less labour. The demand curve for labour will shift to the left.
  • 96.
    Demand for theproduct. Given the derived demand for labour, it follows that a change in demand for a firm’s products will affect its demand for labour. When demand for a product is high or is projected to increase, a firm will take on more workers. The demand curve for labour will shift to the right. At a time of downturn in the economy, demand for a firm’s products is expected to fall. In this case, the firm’s demand for labour will also fall. The demand curve for labour will shift to the left.
  • 97.
    Figure 40.4: Afirm’s demand for labour.
  • 98.
    40.2 The supplyof labour • The supply of labour is the total number of hours that labour is able and willing to work for a particular wage rate. • It should be remembered that the labour market involves people and their willingness to participate (or otherwise) in the labour market. • This decision usually depends upon the wage rate that they are offered for their services, although for some workers the wage rate has only a minor influence on their decision of whether to work – other behavioural factors have a stronger influence.
  • 99.
    • It isuseful to consider labour supply at three levels: 1. Individual worker, that of 2. A firm or industry 3. The economy as a whole. • Different factors affect labour supply depending upon which of these levels is being considered.
  • 100.
    The individual’s supplyof labour • As with any supply, price (or wage in this case) has an important influence on the decision of any individual worker to enter the labour market. • If the wage is too low, an individual may determine that it is not worth the effort of going to work and will decide to stay at home. • Economic theory assumes that there is a positive relationship between labour supply and the wage rate.
  • 101.
    • So, asthe wage rate increases, more people are willing to offer their services to employers. • This is represented by the individual’s labour supply curve, which mainly slopes upwards (see Figure 40.5).
  • 102.
    Figure 40.5: Anindividual’s labour supply curve
  • 103.
    • Beyond acertain point, there is a trade-off between work and leisure. • Individuals may decide that they would prefer to work less and have more time for leisure. • This point is indicated by the backward-sloping curve from point X. • Before this point, an individual worker is more willing to supply labour as the wage rate increases. • It must be stressed that this point depends on the individual’s attitude to work and leisure – point X on any individual’s supply curve will vary. • It also depends on the type of economy and the worker’s personal and family circumstances, especially the income that is required.
  • 104.
    • A furtherfactor is the income tax rate. In all countries, this tends to be progressive. • Low-wage workers pay little or no income tax. As wages rise, more of the increase in wages is paid in income tax to the government. • In some of the top high income countries, this higher rate is often well above 50%. The downside is that a high income tax rate suppresses the incentive to work. • Governments must be very careful to avoid this situation as it is likely
  • 105.
    Labour supply toa firm or industry • The supply curve of labour to a firm or industry consists of the sum of the individual supply curves of all workers employed in a firm or industry. • As with an individual worker, the number of workers wanting to supply their labour increases with the wage rate that is offered. • The slope of this supply curve is measured by the elasticity of supply of labour, the extent to which labour supply responds to a change in the wage rate. • Figure 40.6 below shows two different supply curves – one inelastic (L1) and the other (L2) elastic – with respect to the wages being paid.
  • 106.
    • There arevarious reasons for this difference. • An obvious one is the skills required to carry out a particular occupation. • In general, the more skills required, the more inelastic will be the supply of labour. • This argument also applies to the amount of education and training that is required to carry out a particular job. • Normally, a teacher has to spend four years after college to obtain the necessary qualifications. This means that the supply of teachers is more inelastic than, for example, to street cleaners where little education or training is required.
  • 107.
    • The supplycurve L2 in Figure 40.6 below is therefore likely to be that for an industry where wages are low and where there is a plentiful supply of labour with no particular skills or training. • In a competitive labour market, the wage rates offered in all other industries will be important in determining the supply of labour to a particular industry.
  • 108.
    Figure 40.6: Thesupply curve of labour to a firm or an industry
  • 109.
    The long-run supplyof labour • The long-run supply of labour is of particular significance for the economy as a whole. • There are contrasts between lower middle-income countries and high- income countries, involving wider economic factors. • These factors include:
  • 110.
    • The sizeof the population. In most low-income and lower middle- income countries, there is an increase in the overall supply of labour mainly due to higher birth rates and improved medical care for young children. • Consequently, increasing numbers of young people join the labour market. This means the long-run supply curve for labour shifts to the right, indicating that more workers are willing to supply their labour at a given wage rate.
  • 111.
    • The labourparticipation rate. This term is used to describe the proportion of the population of working age actually in employment. • In some high-income countries, workers often choose to leave the labour market, by taking ‘early retirement’. • This is before the normal age for retirement, so reducing the labour participation rate. • More students are continuing their studies at university, a further cause of a declining labour participation rate. • A reduction in the labour participation rate will shift the long-run labour supply curve to the left.
  • 112.
    • The taxand benefits levels. As shown in Figure 40.5 above, there comes a point where the work–leisure trade-off affects an individual’s labour supply. • This also affects the supply of labour for the economy, particularly in high-income countries. • The level of unemployment and benefits payments can also affect the longrun supply of labour in a similar way as it can affect an individual’s supply of labour. • High tax and unemployment benefit discourage supply of labour.
  • 113.
    • Immigration andemigration. Immigration and emigration affect the long-run supply of labour in an economy. • Emigration increases the supply of labour while immigration decreases supply of labour. NOTE: • The above factors determine the long-run supply of labour. Shifts to the left and to the right in the long-run supply of labour are shown in Figure 40.7 below.
  • 114.
    Figure 40.7: Shiftsin the long-run supply of labour
  • 115.
    • In thelong run, the supply of labour to a particular firm, as distinct from the economy, is influenced by the net advantages of a job. • These include monetary and non-monetary advantages. • Monetary advantages include: The weekly wage or monthly salary is the most important reason for supplying labour Bonus payments, Opportunities to work longer hours Pension arrangements
  • 116.
    • Non-monetary advantagesinclude the following: hours of work job security holiday entitlement promotion prospects location of the workplace job satisfaction whether the work can be done from home.
  • 117.
    • A rationalworker is likely to take both types of advantage into account before making a decision on whether to supply labour. • For many workers, the non-monetary advantages tend to have a substantial influence on their choice of occupation.
  • 118.
    40.3 WAGE DETERMINATIONIN PERFECT MARKETS • Two important features of the workings of labour markets have now been established. 1. The wage paid to labour equals the value of the marginal product of labour, the marginal revenue product. 2. The willingness of labour to supply their services to the labour market is dependent upon the wage rate that is being offered.
  • 119.
    HOW WAGES AREDETERMINED IN A COMPETITIVE LABOUR MARKET. • Bringing demand and supply curves together for an industry shows how the equilibrium wage is determined. • Figure 40.8 below shows a downward-sloping labour demand curve based on marginal revenue product theory, and an upward-sloping labour supply curve. • Equilibrium is found at the intersection of demand and supply. • If the wage is lower than W employers will not be able to fill all their vacancies, and will have to offer a higher wage to attract more workers.
  • 120.
    • If thewage is higher than W there will be an excess supply of labour, and the wage will drift down until W is reached and equilibrium obtained. • The demand curve reflects the value of the marginal productivity of labour. • In equilibrium, workers receive the value of their contribution to the production of goods and services. • Each firm therefore purchases labour until the value of the marginal revenue product equals the wage rate.
  • 121.
    • Therefore, thewage paid in the market must equal the value of the marginal revenue product of labour once it has brought demand and supply into equilibrium. • The market therefore clears at the equilibrium wage. • The labour market is dynamic like any market – any change in the demand or the supply of labour will change the equilibrium wage. • The value of the marginal revenue product of labour will also change by the same amount as, by definition, it must always equal the wage rate.
  • 122.
    • Take thecase of the clothing industry. • An increase in the disposable income of consumers in high-income countries will shift the demand curve for clothing to the right, indicating that more will be demanded at any price. • In turn, this affects demand for workers producing clothing – this is shown in Figure 40.9 by a shift to the right of the demand curve for labour. • The outcome is that the equilibrium wage rises from W to W1, and employment increases from L to L1. • The change in the wage rate therefore reflects a change in the value of the marginal productivity of labour.
  • 123.
    Figure 40.9: Effectsof an increase in demand for labour
  • 124.
    • A changein the labour supply will also affect the market equilibrium. • Suppose that there is an increase in the number of migrant workers and that this increases the number of workers who are able to produce clothing. • When this happens, the labour supply curve shifts to the right. • The increased supply of labour has a downward effect on wages, making it more profitable for firms producing clothing to hire more labour.
  • 125.
    • As thenumber of workers increases, so their marginal productivity falls, as does the value of their marginal revenue product. • The outcome in this case is that wages are reduced for all workers, although the level of employment rises. • This is shown in Figure 40.10 below.
  • 126.
    Figure 40.10: Effectsof an increase in supply of labour
  • 127.
    40.4 WAGE DETERMINATIONIN IMPERFECT MARKETS • The analysis of how wages are determined has assumed that the respective forces of demand and supply operate freely with no intervention. • This is an unrealistic assumption as in many labour markets, the demand and supply of labour are affected by the actions of trade unions and governments. • Such interventions produce what are sometimes referred to as imperfections in the labour market.
  • 128.
    Influence of tradeunions on wage determination and employment • Trade unions are organisations that seek to represent labour in their place of work. • They were set up and continue to exist because individuals (labour) have very little power to influence conditions of employment, including wages. • Through collective bargaining, where trade union representatives get together with employers, trade unions aim to:
  • 129.
    • Increase thewages of their members • Improve working conditions • Maintain pay differentials between skilled and unskilled workers • Fight job losses • Provide a safe working environment • Secure additional working benefits • Prevent unfair dismissals.
  • 130.
    • Traditionally, tradeunions have been strong in the public sector and most types of manufacturing; trade unions are less important in the service sector. • Trade unions are particularly strong in the transport industry and in occupations where specialist skills are required. • Trade unions tend to have most bargaining power where labour has specialist skills or is in short supply.
  • 131.
    • Economic analysissuggests that, in a competitive labour market, a powerful trade union is able to secure wages for its members above the equilibrium wage rate. • The basis for this claim is shown in Figure 40.12 below. At the equilibrium wage, the quantity of labour employed is L. • If a strong trade union can force up wages to Wu, for example, which is above the equilibrium, the number of workers who are offered jobs by employers falls to Lu. • At this wage, the number of people who would like to work is higher. This is shown by Lc.
  • 132.
    Figure 40.12: Theeffect of a strong trade union in a competitive labour market
  • 133.
    • In practice,it is difficult to prove whether or not this theory actually applies in real world labour markets. • In many countries, such practices have been made illegal, so restricting their to act in this way. • Trade unions that try to behave in this way are accused of playing a dangerous game with employers. • The fear is that because of high labour costs and restrictive practices, employers will go out of business or transfer production to countries where wage levels are lower.
  • 134.
    • This threathas been particularly severe for some European and US car manufacturers – production has been switched from France and Germany to other EU countries, such as Czech Republic, Poland, Romania and Slovakia, where labour costs can be as little as one-fifth of those in higher-income countries. • Trade unions would appear to have had very little real influence in these circumstances.
  • 135.
    Influence of governmenton wage determination and employment where there is a minimum wage. • The labour market has seen explicit government intervention through the introduction of a minimum wage. • The aim of a minimum wage is to reduce poverty and the exploitation of workers who have little or no bargaining power with their employers. • In particular, many women employed in shops, small businesses and low skill jobs, such as home working and cleaning, have been paid very low wages.
  • 136.
    • The introductionof a minimum wage has been of particular significance for them. • Whether there should be a minimum wage is controversial. • It is argued that the amount of state benefits being paid to low-income families is reduced with the introduction of a minimum wage. • There might also be a small increase in tax revenue. • Those against a minimum wage are not convinced by these arguments; they believe that jobs are being lost and that other low-paid workers seek increased pay to maintain their differential with the lowest paid.
  • 137.
    • Cost-push inflationcan occur when a minimum wage is implemented, affecting the economy as a whole. • The economics of a minimum wage are shown in Figure 40.13 belw. • The effect on an industry is particularly dependent upon the elasticities of demand and supply for labour in that industry. • Figure 40.13a shows the effects when there is an inelastic demand for labour. • The loss of jobs is less than shown in Figure 40.13b where the demand for labour is more wage elastic.
  • 138.
    • In bothcases there is an excess supply of labour at the higher minimum wage. • This excess is more pronounced in Figure 40.13b where both the demand for and supply of labour are relatively elastic. • It can also be seen that the higher the minimum wage rate is set above the competitive equilibrium of $2.50, the greater will be the excess supply of labour willing to work at the minimum wage.
  • 139.
    Figure 40.13: Theeffects of the introduction of a minimum wage
  • 140.
    • A problemis that sometimes a minimum wage is a national minimum wage. • This means that it does not take into account variations in the cost of living in a country. • In big cities, the cost of accommodation, food and other living costs are much higher than elsewhere. • Consequently, it is very difficult for workers to survive on the minimum wage alone unless long hours are worked. • Recently, a ‘living wage’ has been promoted. It is calculated on the basic cost of living, but unlike the minimum wage, employers choose to pay this on a voluntary basis. The living wage, however, is not the answer to poverty – it is just part of a package of measures including a range of benefits designed to improve the standing of those who are most vulnerable.
  • 141.
    Influence of monopsonyemployers on wage determination and employment • A monopsony occurs when there is a single or dominant buyer, in this case of labour. • The monopsonist buyer is able to determine the price or wage that is paid for the workers who are employed. • This is clearly an imperfect market situation.
  • 142.
    • Figure 40.14below shows how the monopsonist can affect the market equilibrium. • The monopsonist will hire workers by equating the marginal cost paid to employ a worker with the marginal revenue product gained from this employment. • This is the profit-maximizing position. The wage that the monopsonist pays to hire labour is Wm. • This wage rate is below what the employer should pay if workers are paid the full value of their marginal revenue product, Wmrp. • The level of employment is Lm.
  • 143.
    Figure 40.14: Amonopsony buyer of labour
  • 144.
    • In thissituation, the power of the employer in the labour market is of overriding importance. • The employer can set a low wage because of this buying power. • Monopsonists often exist in local labour market situations. • An example is where there is just one major employer in a town or where workers may be employed in an extractive industry located well away from where they normally live. • In this way, the employer dominates the labour market, setting down wages and all other conditions of employment.
  • 145.
    40.5 WAGE DIFFERENTIALS •It is very clear that in any economy there are differences in wages between occupations. • Wage differentials occur between industries, between firms in the same industry and between different regions of a country. • To some extent, wage differences can be explained in terms of demand and supply. • An occupation that is in high demand and low supply will pay a higher wage rate than one where there is an abundant supply of workers.
  • 146.
    • As wellas the market forces of demand and supply, other causes ofwage differentials are: Bargaining strength. Most airline pilots are likely to be members of a strong professional organisation or trade union are paid more than cleaners have little or no bargaining power and can easily be replaced. Education and training. Some occupations, especially those in healthcare, legal services and teaching, require workers to undergo a long period of training. It is only fair that this is reflected in the differential in pay compared to other occupations where this is not a requirement.
  • 147.
    Skilled and unskilledworkers. Skilled workers are likely to be paid more than unskilled workers because demand for skilled workers is higher and their supply is often less. Male and female workers. Despite equal pay legislation in many countries, men are still paid more than women in many occupations because the MRP of women is lower. Hours of work. Part-time workers on average are paid lower wage rates than full-time workers. Government policy. This widens wage differential between these workers and others in similar occupations.
  • 148.
    40.6 TRANSFER EARNINGSAND ECONOMIC RENT Transfer earnings: this is the minimum payment necessary to keep labour in its present use. • Economic rent : a payment received by a factor of production over and above what would be needed to keep it in its present use. It is any payment to labour which is over and above transfer earnings.
  • 149.
    • Transfer earningsand economic rent are shown in Figure 40.15(a) below. • Transfer earnings are indicated by the area under the labour supply curve which is upward sloping. • Although the equilibrium wage is W, at wage rates below this there are workers who are willing to offer their services to employers. • In fact, at any wage rate from zero upwards, workers will join the labour market, until at wage W, L quantity of labour is available.
  • 150.
    • In allcases up to W, the wage that a worker receives is their best alternative. • For those workers willing to work for less than W, then any wages they get over and above what they will accept is their economic rent. • This is shown by the triangular area in Figure 40.15(a). • Different workers receive different amounts of transfer earnings and economic rent even in the same job. Take a bus driver as an example. • Some people are very willing to drive buses for a low wage. These workers have low transfer earnings and some economic rent.
  • 151.
    • The caseof superstars can be explained using Figure 40.15(b). • Such people have a scarce unique talent. Their labour supply curve is perfectly inelastic; their earnings consist entirely of economic rent. • In contrast, workers with a perfectly elastic supply, such as many unskilled workers and others in menial jobs, have no economic rent as their earnings consist entirely of transfer earnings. • Employers can hire an infinite supply of labour at the market wage W. This situation is shown in Figure 40.15(c).
  • 157.
    EXAM-STYLE QUESTIONS: MULTIPLECHOICE. Unit 8 End-of-unit questions DATA EXAM-STYLE QUESTIONS: DATA RESPONSE AND ESSAY RESPONSE AND ESSAY
  • 158.