SlideShare a Scribd company logo
1 of 22
Download to read offline
An Overview of Ontario’s Cap and Trade Program
-Rajiv Satyanarayan
Contents
1. Executive Summary 1
2. Economics Theory behind Cap & Trade 2
2.1 Externality
2.2 Implications of an Externality
2.3 Negative Externality
2.4 Possible solutions
2.4.1 Solutions using Price – Pigouvian Taxes
2.4.2 Solutions using Quantity – Quotas
2.4.3 Market based solutions – Tradeable permits
2.5 Cap & Trade
3. Pros & Cons of Cap & Trade 4
3.1 Pros
3.2 Cons
4. Comparison of Cap & Trade to alternatives 5
4.1 Comparison of Price and Quantity based corrections
4.2 Comparison with Tradeable permits market
4.3 Similarities and Differences
5. Historical Successes & Failures of Cap & Trade 6
6. Ontario Government’s Rationale for choosing Cap & Trade 8
7. Critical Opinion on Cap & Trade 7
7.1 Criticism pertaining to competitiveness of Ontario’s industries
8. Working of Ontario’s Cap & Trade Program 11
8.1 Relevant Regulations and Acts
8.2 Greenhouse Gases and Reduction targets
8.3 Businesses affected
8.4 Registration and Reporting
8.5 Emission Allowances
8.6 Auctions and Sales
8.7 Proceeds from the Cap and Trade Program
9. Effectiveness of Cap & Trade program implementation 14
9.1 Scope of Cap & Trade program
9.2 Distribution of benefits and costs
9.3 Effectiveness of Market Design
9.4 Transparency
9.5 Measurement and verification
9.6 Integration with other measures
10. Conclusion 17
11. Recommendations 17
References 18
1
1. Executive Summary
As part of its Anti-climate change framework of regulations, the Ontario government passed
Regulation 144/16 on 19th
May 2016 for implementing a Cap and Trade Program for Green House
Gas emissions. This paper provides an overview of the economics behind the program, evaluates
the program’s efficacy and provides recommendations to ensure optimal execution.
Economics theory defines Efficient Markets as those where all transactions benefit the society as
a whole. Externalities are a type of Market Failure which hinder markets from being efficient.
They are a cost or a benefit that affects a third party not directly involved in the economic
transaction. Negative externalities (like GHG emissions) impose costs on third parties who are not
directly involved in the transaction. Of the available solutions to ‘internalize' a negative externality,
market-based tradeable permits are theoretically the most efficient. However, in practice, while it
provides a certainty of GHG reduction, it is administratively complicated to implement.
The Cap and Trade program works under the framework set by the Climate Change Mitigation
and Low-carbon Economy Act passed by the Ontario government on 18th
May 2016. The program
will join the Western Climate Initiative model cap and trade program which includes Québec and
California. Further, the actions of Ontario's Five Year Climate Change Action Plan 2016 – 2020,
will be funded by the cap and trade program. The aim of the framework is to achieve 80% GHG
reduction by the end of 2050.
The following lessons have been learned from past cap and trade programs: -
 Prudent allocation of allowances – Over allocation may cause a low carbon price and
render the program ineffective, while under allocation may cause industries to move to
other jurisdictions. To allocate accurately, extensive measurement and verification data
are required.
 Banking allowances – Ability to bank allowances over multiple periods should be
available in the program to give flexibility to industries.
 Coordinating complementary policies – Other policies which reduce GHG emissions
should be coordinated to ensure required carbon price.
It can be concluded that the program has a wide scope and sufficient cap declines to meet the
targeted reduction of 80% by 2050. Effective distribution of benefits to consumers will depend on
the efficacy of the climate change action plan initiatives. The market has been designed with the
safeties of a price floor, ceiling, and a strategic reserve. While administrative costs have been saved
by using the WCI model, sufficient monitoring and oversight costs can be expected. There are
sufficient transparency and checks in terms of measurement and verification. The program also
integrates well with federal policy, economic and environmental policy considerations.
Recommendations: -
 Assess the performance of the program by monitoring the rate of emission decline by
industry with the cost of reductions. Adjust allowances and flexibility arrangements based
on the cost of decline and the target reductions.
2
 Monitor action of complementary regulations which reduce GHG emissions and coordinate
spending to achieve in phase action.
 Review the implementation of the program, the progress of the action plan, and alignment
with the federal climate policy.
2. Economics Theory behind Cap & Trade
Before we examine Cap & Trade as a solution, we need to understand the problem it is trying to
solve. This section endeavors to give a brief on the economics behind the issue and the solution.
2.1 Externality
Economics theory defines Efficient Markets as those where all transactions benefit the society1
.
Externalities are a type of Market Failure which hinder markets from being efficient. An
Externality can be defined as a cost or a benefit that affects a third party not directly involved in
the economic transaction1
. Externalities violate the ‘Exclusivity’ principle of efficient markets2
.
Exclusivity requires that all benefits and costs accrued as the result of owning and using the
resources should accrue to only the owner2
. Negative externalities impose costs while positive
externalities benefit third parties who are not directly involved in the transaction1
.
2.2 Implications of an Externality
In a free market, voluntary exchange is considered mutually beneficial to both parties involved,
because buyers or sellers would not trade if either thought it detrimental to themselves. However,
a transaction can cause additional effects on third parties. From the perspective of these third
parties, the effects may be negative (adding costs), or positive (giving benefits). The existence of
externalities will result in outcomes that are not socially optimal. Those who suffer from external
costs do so involuntarily, whereas those who enjoy external benefits do so at no cost3
.
2.3 Negative Externality
Air pollution and in our case, Green House Gases (GHG) are a negative externality. If we take the
example of a thermal power plant which produces electric power by burning fuels which generate
GHG as a byproduct, the negative externality of GHG causes the market to produce more
electricity than is socially optimal as the cost to society of GHG is ignored.
2.4 Possible solutions
We have seen that a free market produces more goods than optimal with a negative externality if
left on its own4
. This inefficiency may be reduced by market intervention by the government or
economic actors. Market intervention may be done by controlling the price or quantity of the good
produced. Increasing the price to reflect true social costs or decreasing the quantity to efficient
levels will steer the market away from inefficiency.
1
(Austan Goolsbee, 2013)
2
(Herriges, 2010)
3
(Boundless Economics, 2017)
4
(Austan Goolsbee, 2013)
3
2.4.1 Solutions using Price - Pigouvian Taxes
This type of tax (named after English economist Arthur Cecil Pigou) raises a good’s price to take
into account the external costs imposed by a negative externality. It brings equilibrium in the
market toward an efficient level of output and price5
. In effect, the Pigouvian tax ‘internalizes’ the
emission externality. That is, it forces the industry to take into account the external damage of its
operations when it decides how much electricity to generate. This process results in the efficient
market outcome. These taxes are also called Carbon taxes as they tax the carbon produced.
2.4.2 Solutions using Quantity – Quotas
The quantity-based approach is to set a quota, a mandated limit on the quantity of a good or an
externality a producer can make or a consumer can buy6
. By regulating output, the amount of the
externality associated with producing this output is also regulated. Quantity can also be controlled
with licensing, where only a particular amount of an activity (production or consumption) is
allowed by authorities.
2.4.3 Market-based solutions – Tradeable permits
Trying to control the total externality in a market by restricting each firm’s quantity or determining
the correct amount of tax involves a lot of data, predictions, effort and still involve errors. It is also
very difficult for a regulator to know what each firm’s costs are and set quantity restrictions or
taxes appropriately. It is, therefore, preferable to allow firms to jointly determine how best to
reduce an externality to its optimal level. Tradable permits for emission can achieve this. These
are permits issued to firms by the government that allow the holder to emit a certain amount7
. After
the permits are allocated among firms, they may be traded between firms, allowing some firms to
emit a greater amount than other firms. In essence, a market for emissions develops. Such systems
are called ‘cap and trade’ programs for this reason: The government sets a cap on emissions, issues
an amount of permits equal to this cap, and then firms trade the rights among them.
2.5 Cap & Trade
We have seen that Cap & Trade is a type of market correction to reduce the inefficiency caused by
GHG emissions as a negative externality. Its advantage is that it is a market based solution and
allows firms to jointly determine how best to reduce an externality to its optimal level through
tradable permits for emissions. It develops a market for emissions where the government sets a
cap on emissions, issues an amount of permits equal to this cap, and then firms trade the rights
among them.
Cap and trade, or emissions trading, is a common term for a government regulatory program
designed to limit, or cap, the total level of specific chemical by-products resulting from private
business activity8
. Cap and trade's purpose is to create a market price for emissions or pollutants
that did not previously exist and address possible negative externalities. The government sets a
5
(Nelson, 2003)
6
(Mankiw, 1997)
7
(Austan Goolsbee, 2013)
8
(Investopedia - Cap & Trade, 2017)
4
total limit on annual emissions of greenhouse gases. This is the ‘cap’. The cap is designed to shrink
each year. After the cap has been determined, allowances for portions of the total limit are
allocated. Such allocations, or permits, are handed out to businesses who are registered. Companies
which produce a higher level of total emissions than their permits allow have to buy permits.
Companies can also sell off any unused allowance to other producers. This is the ‘trade’.
The cap allows the government and the businesses to plan ahead9
. The government can set an
environmental goal to be achieved and businesses can plan process improvements and investments
to achieve the same. The trading allows flexibility to businesses in achieving the emission cuts.
Firms which can easily achieve cuts can do so and even trade permits to generate revenue. Others
who find it to be difficult may opt to purchase permits than invest in process improvements.
3. Pros & Cons of Cap & Trade
3.1 Pros
As discussed in Section 2.4 before, the main advantage of cap and trade is that it is more efficient
in achieving the aim of reducing emissions as compared to its alternatives. Companies which can
reduce their emissions at a low cost will do so, and sell the emissions credits to companies who
cannot10
.
Also, the given level of emissions which is a maximum is pre-determined. A certain number of
emissions credits are made available to businesses in a variety of ways. By gradually decreasing
the maximum level of emissions, long-term goals to reduce emissions can be met. This maximum
level can be decreased by government purchases of emissions which are then retired, or by pro-
environmental groups who can purchase and retire credits to decrease the harmful effects of
climate change11
.
Another benefit is of increased governmental revenue. This can be used to further energy
efficiency, addressing climate change or make energy more affordable for low-income families12
.
3.2 Cons
Cap & Trade indirectly encourages the industries who find it difficult to limit emissions because
it is possible to purchase cheap offsets or carbon credits rather than invest in costlier upgrades13
.
Sometimes these credits are just given away, creating no trade benefit at all. This means it costs a
business nothing to expand their emissions and that can harm a local economy, which receives no
economic gain in return14
.
9
(Environmental Defense Fund - Cap & Trade, 2017)
10
(climate-change-the-pros-and-cons-of-cap-and-trade, 2010)
11
(climate-change-the-pros-and-cons-of-cap-and-trade, 2010)
12
(12-cap-and-trade-pros-and-cons/, 2015)
13
(12-cap-and-trade-pros-and-cons/, 2015)
14
(12-cap-and-trade-pros-and-cons/, 2015)
5
While the ability of the government to purchase credits is advantageous, it is also a disadvantage
as it means that taxpayer money is used to purchase something that is not used (credits are retired)
and could potentially stagnate industry development.
It creates higher prices for goods and services. As renewable energy resources are relatively new
and so relatively expensive, industries that do transition into lower emissions and follow cap rules,
do so at a cost. These get passed along to the consumers as higher prices.
The policy is not the uniform across countries. This causes fluctuating prices if multiple countries
are involved in a common auction like the Western Climate Initiative in which Ontario is involved.
It also provides global companies chances at arbitrage15
.
4. Comparison of Cap & Trade to alternatives
Let us consider similarities and differences of the three measures: Quotas, taxes, and tradeable
permits.
 Correction of market failure - All three measures have as their objective as correction of
an existing market failure. Without these, sources responsible for GHG emissions do not
have to pay for the damages they impose on society as a whole. The failure to internalize
these costs would lead to greater levels of emissions than would be socially optimal.
 Price on carbon - Taxes and cap and trade both put a price on carbon and thus correct the
market failure. Both approaches create an incentive to develop and invest in energy-saving
technologies. Quotas put an indirect price by imposing on polluters to invest in reducing
pollution to keep it below the specified quota to stay in business.
 Use of market efficiencies - Unlike quotas, the other two harness market forces to achieve
the lowest cost reductions in GHG emissions.
 Generate revenue - A tax by definition is designed to raise revenue, but a cap and trade
system, to the extent that allowances are auctioned, can also raise similar amounts of
revenue. How such revenues are used becomes an important issue in both systems. Quotas
do not generate revenue.
 Impose a compliance obligation - Depending on who pays the tax or is responsible for
holding allowances, the number of firms directly impacted by these systems can be large
or small. Most proposals focus on a limited number of firms with the goal of maximizing
emissions coverage and reducing administrative costs. Quotas are imposed on entire
industries or area jurisdictions.
 Require monitoring, reporting, and verification - All three systems require similar data
on emissions, reporting and verification of that data, and enforcement in the event of
noncompliance.
 Uncertainty - By setting a cap and issuing a corresponding number of allowances, a cap
and trade system achieves a set environmental goal, but the cost of reaching that goal is
determined by market forces. In contrast, a tax provides certainty about the costs of
compliance, but the resulting reductions in GHG emissions are not predetermined and
would result from market forces. A quota sets only a cap.
15
(cap-and-trade-pros-and-cons-list, 2015)
6
 Compliance flexibility - A tax requires a firm each year to decide how much to reduce its
emissions and how much tax to pay. Under a cap and trade system, borrowing, banking
and extended compliance periods allow firms the flexibility to make compliance planning
decisions on a multi-year basis. Quotas allow no flexibilities.
 The impact of economic conditions - Changes in economic activity impact a firm’s
behavior. Under a cap and trade system, reduced economic growth would lower allowance
prices. Under a tax, government action to lower the amount of the tax, not market forces,
would be required to reduce the carbon price seen by firms. In times of economic
expansion, the opposite would be true - under cap and trade, allowance prices would rise
based on market forces, but taxes would remain the same unless adjusted through
government action. In this sense, cap and trade can be seen as providing a self-adjusting
price. A tax or quota, in contrast, would need adjusting.
 Other cases - A carbon tax might be the simplest to administer. Setting up a complex cap
and trade arrangement that is comprehensive has high institutional needs. Cap and trade
also involves transaction costs in buying and selling permits. Considered globally, it also
may cause a Free Rider Problem16
. The problem of excess carbon emissions is a global
problem and so needs to be a global solution. If carbon trading is introduced in one country
but not others, it may cause production to shift to countries without the scheme.
In summary, both cap and trade programs and carbon taxes can work well as long as they are
designed to provide a strong economic signal to switch to cleaner energy. Cap and trade has one
key environmental advantage over a carbon tax17
: It provides more certainty about the amount of
emissions reductions that will result but little certainty about the price of emissions (which is set
by the emissions trading market). A carbon tax also has one key advantage2
: It is easier and quicker
for governments to implement. It can rely on existing administrative structures for taxing fuels and
can, therefore, be implemented in just a few months. In theory, the same applies to cap and trade
systems, but in practice, they tend to be much more complex. More time is required to develop the
necessary regulations, and they are more susceptible to lobbying and loopholes18
. Cap and trade
also requires the establishment of an emissions trading market.
5. Historical Successes & Failures of Cap & Trade
Cap & Trade was first adopted as ‘Emissions trading’ as part of the clean air act in the USA, in
199019
, to control power plants from causing acid rain. The cap took effect from 1995 and cut
emissions by three million tons that year, ahead of schedule. It also proved that cap & trade is the
least expensive way to control emissions, as found previously by computer simulations.
Measures to tackle GHG emissions began in Rio in 1992, when 160 countries became part of the
UN Framework Convention on Climate Change (UNFCCC). The UNFCCC is simply a framework
and the necessary details were settled by the Conference of Parties (CoP) to the UNFCCC. In 1997,
the CoP agreed to the Kyoto Protocol where 38 developed countries committed themselves to
16
(economics/carbon-tax-pros-and-cons, 2013)
17
(issues/climate-change/science/climate-solutions/carbon-tax-or-cap-and-trade/, 2014)
18
(pros-cons-politics-of-cap-and-trade-versus-co2-taxes, 2009)
19
(the-political-history-of-cap-and-trade, 2009)
7
targets and timetables for the reduction of GHGs. International mechanisms which would allow
developed countries flexibility to meet their targets were included in the Kyoto Protocol. Countries
would also be able to use International Emissions Trading. Nations that emit less than their quota
would be able to sell assigned amount units to nations that exceed their quotas. It is also possible
for countries to sponsor carbon projects that reduce greenhouse gas emissions in other countries.
The EU ETS is the largest multinational GHG trading system. It is also the system which has seen
the most problems. RGGI was formed in 2003 by New York State with nine north east US states.
Lessons learned with the European Union Emission Trading System (EU ETS) and the Regional
Greenhouse Gas Initiative (RGGI) have shown the need to manage costs and volatility with cost
containment measures20
.
The EU ETS was initially implemented in phases, with a pilot Phase I from 2005-2007, followed
by a Kyoto Phase II from 2008-2012 and a number of subsequent phases. The initial system
covered approximately half of EU CO2 emissions across 31 EU countries. The system was limited
to certain sectors, as many sectors, such as transportation, were exempted because of concerns
about competitiveness with non-participating jurisdictions21
. The initial process for setting caps on
emissions was decentralized by member states, which created strong incentives for individual
states to propose high cap limits that favored emission intensive industries in their jurisdiction.
This, combined with weak emissions data, led to an overly generous allocation of allowances
relative to emissions when the market opened in 2005. While the price of allowances was initially
high, the oversupply in the market quickly depressed demand and prices, causing the price of a
single allowance to drop from €30 in 2005 to effectively €0 by 2007. The EU responded in
subsequent phases with a planned tightening and centralization of the cap, an expanded scope of
covered industries, and an ability to bank allowances between phases. While this initially increased
allowance prices to over €20, prices have continued to bottom since that point. The current price
varies between €0 and €10. This is in part due to a combination of a weakened post-recession EU
economy and the increased use of offsets under the Clean Development Mechanism, which grants
allowances for offset projects in developing countries.
The following lessons can be learned from the above 22
 Addressing Over-Allocation - Over-allocation can be banked by companies to keep the
price of allowances low for years to come. Avoiding such over-allocation requires good
data on emissions to base an initial cap.
 Banking Allowances - Ability to bank allowances over multiple periods should be
available in the program. While such a model can exacerbate the negative effects of
allowance over-allocation, it is necessary to avoid an external collapse of allowance prices
at the end of a given period.
 Limiting Free or Exempt Allowances - Granting free allowances to certain sectors is a
risky way to deal with issues of competitiveness. When allocations are not linked to
20
(Klinsky, 2013)
21
(cap-and-trade, 2016)
22
(cap-and-trade, 2016)
8
production, they cannot affect marginal costs, which eliminates incentives to reduce or
relocate emissions for entire sectors.
 Robust Offset Rules - Offset policies must be properly monitored and maintained. The
increasing popularity of the Clean Development Mechanism lies in its allowing companies
to apply for offsets when they reduce emissions in foreign jurisdictions.
 Coordinating Complementary Policies - It has been suggested that the issues with the
EU ETS are caused by complementary EU environmental policies related to the cap and
trade program. These policies, in the view of their critics, relocate emissions, increase
emissions reduction costs, and, in the absence of a price floor, depress allowance prices.
6. Ontario Government’s Rationale for choosing Cap & Trade
The Cap & Trade program is one measure in a long line of initiatives taken to handle climate
change23
. The Ontario government24
indicates that the province is responsible for about 1% of
global GHG emissions and is one of the largest per capita emitters in the world. The government’s
measures, culminating in the Climate Change Action Plan, will lower Ontario’s emissions by 8 to
10 mega-tonnes by 2020. The Green Energy Act in 2009, incentives for electric vehicles in 2010,
energy efficiency building standards in 2012, ending coal-fired power plants in 2014,
announcement of cap and trade program in 2015 and finally the Climate change action plan in
2016 have been the measures taken so far in that direction.
Although Ontario began this journey as a province long back, other provinces will have to follow
suit soon with the federal government announcing a national floor price for carbon in October
201625
. After this announcement, the provinces will have a choice between carbon taxes and cap
and trade. Ontario made the same choice in 2015. The government indicates the following reasons
for choosing the cap and trade program26
: -
 Cap and trade are more efficient than other alternatives as it uses market forces to achieve
lowest cost emissions cuts. A carbon tax would require extensive data to fix efficient limits
on emissions and an accurate price for the tax.
 It gives flexibility in planning to individual industries. They have the choice of purchasing
permits or investing in emission efficient measures in the time frame suitable to them.
Carbon tax not only is inflexible, it does not even cater to the state of the economy.
 Becoming a signatory of Western Climate Initiative with Quebec and California will
reduce administrative costs by joining an existing system.
 It will allow the government to protect certain industries, by providing assistance in the
form of permits, where risk exists of production moving to other locations.
 It will create a transparent revenue-neutral system as the funds generated will be handled
by an independent agency to invest in the climate change action plan. Carbon tax will be
part of other revenues generated by the government and will not provide transparency.
23
(Climate change mitigation and Low carbon economy Act, 2016, 2016)
24
(cap-and-trade-Ontario, 2016)
25
(The Star, 2016)
26
(Change, 2017)
9
 The program gives certainty to achievement of the goal of 80% reduction in emissions by
2050. Carbon taxes would provide certainty on the price of carbon but not on the
reductions. Also, carbon taxes would cause reductions due to industries leaving Ontario
(50% reductions would be due to that).
However, besides the rational reasons provided above, the main reason for the provincial
government to not opt for carbon taxes was public opinion27
. With a sluggish economy and
electricity bills already increasing due to the Green Energy Act, a move towards carbon taxes
would have angered the public. A carbon tax would increase shipping costs and thus prices on all
necessities like food and clothing. It would, therefore, be a tax which would affect the tax payers.
Instead, a cap and trade program could be made transparent to be revenue neutral, thus calming
the public.
The government indicates that cap and trade is projected to generate about $1.9 billion per year in
proceeds. This will be invested into programs that save homeowners energy and money. The
program will be revenue neutral and every dollar collected through cap and trade will be invested
back into projects that reduce greenhouse gas pollution, such as public transit, electric vehicle
incentives, and social housing retrofits. Also, researchers, entrepreneurs, and start-ups will benefit
as their new technologies are needed to meet the emissions reduction challenge. This will bring
jobs and economic benefits in the growing global market for climate-friendly products. The
government has already committed $325 million to the Green Investment Fund for projects that
will fight climate change, grow the economy and create jobs.
The government estimates that internalizing the cost of emissions will not affect electricity costs
much as 90% of power generated in Ontario is emissions free (predominantly Nuclear). It indicates
that Gasoline will cost 4.3 cents more per litre and Natural gas $5 more per month. The total cost
per month for the average household is estimated to be $13.
7. Critical Opinion on Cap & Trade
There has been wide spread criticism of the Ontario government on the Cap & Trade program.
Premier Kathleen Wynne’s approval rating is presently at 15% and 58% of the electorate believe
she should resign28
. However, more than the program itself, this is in expectation of the outcome
- higher electricity bills and increased cost of gasoline. The price of natural gas will also rise29
. To
add to that, OEB’s decision to not show the additional cost as a separate bill line item has led to
criticism of not being transparent30
. Finally, the dissent is amplified due to higher cost of electricity
being paid for by Ontarians since the Green Energy Act in 2009. The person being held responsible
for this is Gerald Butts, Senior Advisor to the Premier from 2003 to 2008.
The criticism moves to include Ontario's Cap & Trade program as part of the pan-Canadian
framework for clean growth and climate change, which is Canada's plan to meet the 2030 target
27
(Huffington Post, 2014)
28
(Ontario-disaster-architects, 2016)
29
(cap-trade-will-raise-natural-gas-bills-across-Ontario-oeb, 2016)
30
(insights-resources/Ontario-energy-board-decision-on-cap-trade-costs-why-reasons-for-decision-are-essential-
to-demonstrate-regulatory-independence, 2016)
10
of GHG emission reduction31
. This plan features a minimum national carbon price of $15 per
tonne32
.
The skepticism is partly because of the higher costs and partly because the program will generate
$ 8 billion in revenues for the government33
. While public opinion is partly in favor of making the
program revenue neutral, part skepticism is towards efficient use of the revenue generated. The
government is trying to address both concerns by indicating that the generated funds will be
handled by a transparent Green Bank and issue a plan on how the funds will be spent. However,
with functioning of the Green Bank still unclear, this has not helped much.
Besides the above criticism of rising costs on the common consumer, there are doubts about the
efficacy of the program in meeting its aim of reducing GHG emissions to the required level34
.
There is speculation that too many free permits have been issued and that the increase in cost of
gasoline will not push consumers towards electric vehicles. We have seen that the cap set and the
number of free permits given out by the government will decide the market price for carbon.
Achieving a right price for carbon will be critical to avoid the problems faced by ETS.
7.1 Criticism pertaining to competitiveness of Ontario’s industries
The main criticism of the program is under the premise that a carbon-priced Ontario cannot
compete with the US industries across the borders, especially with the USA not putting a price on
GHG emissions35
. Twenty chambers of commerce around the province, strongly led by those in
Ajax-Pickering, Burlington, Hamilton and New Market, have been protesting to delay the
program36
. They are complaining about Ontario losing jobs and investing in neighboring areas.
This is even more valid with the Trump presidency not supporting climate change and reduction
of GHG emissions. Production and fuel costs will be lower in the US states. This will cause
investments in the manufacturing sector to be made in the USA rather than across the border in
Ontario. Sectors like the automobile manufacturing business, which are well established on both
sides of the border may see slow scaling down of production in Ontario as production costs go up
due to the cap and trade program. The auto sector faces additional issues with President Trump
rolling back in auto emission standards37
. Increased cost of power will affect all businesses across
Ontario. The auditor general has said that the program will cost Ontario businesses and consumers
an additional $ 8 billion by 202038
. The government’s defense to this criticism does not address
the concerns. The environment minister has issued statements saying that the program has been
endorsed by third party economic experts to be ‘most cost effective and best’ at reducing GHG
emissions39
. The government could address concerns by issuing permits to industries needed to be
31
(climate-change-deal-premiers-prime-minister, 2016)
32
(ontarios-cap-and-trade-regime-off-to-a-shaky-start, 2016)
33
(wynnes-carbon-price-doesnt-add-up, 2016)
34
(ontarios-cap-and-trade-regime-off-to-a-shaky-start, 2016)
35
(ontario-disaster-architects, 2016)
36
(The Star, 2016)
37
(National Observer, 2017)
38
(The Star, 2016)
39
(The Star, 2016)
11
protected. However, there has been no action in this regard. The government has only assured that
natural gas prices will remain the same as permits will be issued to those companies.
8. Details of Ontario’s Cap & Trade Program
8.1 Relevant Regulations and Acts
The Climate Change Mitigation and Low-carbon Economy Act was passed on 18th
May 201640
. It
sets out the framework for the cap and trade program including requirements for quantifying,
calculating, reporting and verifying greenhouse gas emissions, and submitting allowances and
credits to match greenhouse gas emissions. It also provides the rules for creating and distributing
allowances and credits through free allowances, auctions and sales, establishing an offset program.
The Ontario Regulation 144/1641
- The Cap and Trade Program and its incorporated Methodology
for the Distribution of Ontario Emission Allowances Free of Charge were set on 19th
May 2016.
They set out the details of the cap and trade program including caps, compliance periods, rules
related to registration and participation, details regarding who is a mandatory participant and who
can participate as a voluntary or market participant, as well as information on allocating emission
allowances.
The Ontario Regulation 143/1642
- Quantification, Reporting, and Verification of Greenhouse Gas
Emissions Regulation and its incorporated Guideline for Quantification, Reporting and
Verification of Greenhouse Gas were set on 19th
May 2016. They set out more details regarding
quantifying, calculating, reporting and verifying greenhouse gas emissions.
On June 8, 2016, the provincial government released Ontario’s Five Year Climate Change Action
Plan 2016 – 202043
, which will be funded by the cap and trade program.
The Act allows for agreements to link Ontario’s cap and trade program with programs in other
jurisdictions as part of a broader international effort to reduce emissions44
. In 2008, Ontario joined
with other jurisdictions, including Québec and California, to create the Western Climate Initiative
model cap and trade program. Québec and California already have carbon markets, and Ontario
has structured its cap and trade program to ultimately align with these existing markets45
.
8.2 Greenhouse Gases and Reduction targets
The Act and Reporting Regulation list the greenhouse gases that are covered by the regulatory
regime: carbon dioxide, methane, nitrous oxide, hydrofluorocarbons, perfluorocarbons, Sulphur
hexafluoride, nitrogen trifluoride46
. The Act sets the following targets for reducing Ontario’s
overall greenhouse gas emissions from 1990 baseline levels:
40
(Climate change mitigation and Low carbon economy Act, 2016, 2016)
41
(Ontario Regulation 144/16 - Cap & Trade Program, 2016)
42
(Ontario Regulation 143/16 - Qualification Reporting & Verification of GHG emissions, 2016)
43
(Ontario's five-year climate change action plan 2016-2020, 2016)
44
(Climate change mitigation and Low carbon economy Act, 2016, 2016)
45
(Ontario Regulation 144/16 - Cap & Trade Program, 2016)
46
(Ontario Regulation 143/16 - Qualification Reporting & Verification of GHG emissions, 2016)
12
 15% reduction by the end of 2020
 37% reduction by the end of 2030
 80% reduction by the end of 2050
To meet the 2020 provincial emission targets, the government will issue allowances each year that
fall by an average rate of 4.1% from 2017 to 2020. These targets are aligned with the
recommendations made by the Intergovernmental Panel on Climate Change. The regulatory
regime allows the government to make these targets more stringent and to establish additional
interim targets.
8.3 Businesses affected
Businesses involving the following types of production are covered by the cap and trade program:
cement; copper and nickel; glass; iron and steel; lead; petrochemical; and pulp and paper; and the
following activities: coal storage; electricity generation; general stationary combustion; operation
of equipment for a electricity transmission system or a distribution system; operation of equipment
related to the transmission, storage and transportation of natural gas; and petroleum refining9
.
In addition to being responsible for their own facilities' emissions, electricity importers, natural
gas distributors, and petroleum product suppliers will be required to obtain emissions allowances
for the greenhouse gas emissions associated with their customers (except for customers already
participating in the cap and trade program as mandatory or voluntary participants)8
. The Reporting
Regulation sets out the requirements for these emitters. There are different reporting and
registration requirements based on emission levels.
If a facility produces 25,000 tonnes or more of greenhouse gas emissions (carbon dioxide
equivalent or CO2e) per year, the owner or operator of the facility is subject to reporting
requirements including emission verification requirements and must register as a mandatory
participant in the cap and trade program. If a facility produces between 10,000 and 25,000 tonnes
of CO2e per year, the owner or operator of the facility is subject to reporting requirements and may
register as a voluntary participant in the cap and trade program. If a facility produces less than
10,000 tonnes of CO2e per year, there are no reporting obligations, but the owner or operator of
the facility may apply to register as a market participant in the cap and trade program.
8.4 Registration and Reporting
The cap and trade program will take effect on January 1st
, 2017 with the first 4-year compliance
period ending Dec. 31, 2020.14 Subsequent compliance periods will last three years. Reporting
obligations will continue under the current Greenhouse Gas Emissions Reporting Regulation
(Ontario Regulation 452/09 under the Environmental Protection Act) until all reporting is
complete.
Mandatory participants need to register by November 30th
, 2016. The information required for
registration is set out in Schedule 1 of the Cap and Trade Regulation.
For Voluntary and Market Participants that are not required to register under the Act, the Cap and
Trade Regulation contains provisions. Voluntary participants may register in 2016 if they meet the
criteria set out in section 29 of the Cap and Trade Regulation. There are also opportunities to
13
register as a voluntary participant in 2017 or after 2017. Those who register as voluntary
participants will be subject to the same requirements as mandatory participants, including the
requirements to verify reported emissions. A person who is not a mandatory or voluntary
participant may apply to register as a market participant.
8.5 Emission Allowances
Under the Cap and Trade Regulation, the Minister is required to create a set number of emission
allowances that decreases each year47
. One allowance is equal to one tonne of greenhouse gas
equivalent (CO2e). Regulated emitters will only be able to emit the amount of greenhouse gases
permitted by their allowances. Initially, a certain number of free allowances will be available for
distribution to eligible participants. The Cap and Trade Regulation and incorporated Methodology
set out the application eligibility requirements for free allowances. Eligible participants can apply
for free allowances in order to cover their emissions and the number allocated to them will be
calculated based on the Methodology. Eligible facilities that apply for free allowances are those
engaged in the production of specified GHG activities in the Reporting Regulation.
8.6 Auctions and Sales
As the total number of allowances in Ontario decreases each year and free allowances are phased
out, emitters will have to reduce their emissions or purchase allowances in the carbon market. Only
registered participants, be they mandatory, voluntary or market, will be able to purchase, sell or
trade emission allowances and credits. The first auction for emission allowances is expected to
take place in March 2017. Each year there will be four auctions with a single round of bidding.
The Minister may also offer distribution of allowances for sale starting in 2017. A maximum of
four sales is allowed per year. Potential fines for non-compliance range from a minimum of $5,000
for individuals and $25,000 for corporations to as high as $6 million for individuals and $10
million for corporations.
8.7 Proceeds from the Cap and Trade Program
The Act establishes a Greenhouse Gas Reduction Account for the proceeds from the cap and trade
program48
. Schedule 1 of the Act sets out a list of climate change initiatives that could be funded
from the account including public transit, clean-tech innovation for industry, electric vehicle
incentives and housing retrofits. However, the Act requires the Minister to prepare a more specific
Climate Change Action Plan that may be funded by the Greenhouse Gas Reduction Account. The
provincial government may revise the plan and must review it every five years.
On June 8, 2016, the Ontario government released its first Climate Change Action Plan. The plan
addresses the leading sources of greenhouse gas emissions in Ontario, including transportation,
industry, and energy inefficiency in buildings and homes. The government also plans to address
climate change through better land use planning, and by supporting the research and development
of low-carbon technologies. Among other plans to reduce emissions, the government intends to
create incentives for the purchase of electric vehicles, increase the availability and use of lower-
47
(Ontario Regulation 144/16 - Cap & Trade Program, 2016)
48
(Climate change mitigation and Low carbon economy Act, 2016, 2016)
14
carbon fuel, improve public transportation, and provide incentives for apartment building energy
retrofits.
Key areas of the action plan include49
:-
a. Establishing a green bank to increase access to financing for energy efficient
technologies
b. Electrifying the transportation system by increasing the availability of zero-emission
vehicles, cleaner trucks and making transit accessible
c. Reducing emissions from buildings by providing better information to make more
informed decisions on energy use and making new buildings more energy efficient
over time
d. Making Ontario one of the easiest and most affordable jurisdictions to install or
retrofit clean energy systems including solar, battery storage, advanced insulation,
and heat pumps, while protecting low-income and vulnerable communities
e. Supporting a carbon market that achieves reductions at the lowest cost, driven by
businesses and industry making investments to reduce greenhouse gas emissions
f. Working with First Nations and Metis communities to address climate change and
build capacity with actions guided by Traditional Ecological Knowledge
g. Building on progress by making government operations carbon neutral that include
government facilities, operations, and procurement
h. Ensuring natural, agricultural and forest lands are used efficiently and sustainably to
enhance the removal and storage of carbon, and enhancing the capture to CO2e from
waste
With anticipated annual cap and trade proceeds of $1.8-1.9 billion annually adding to $8.3
billion by 2020, the funds are expected to fund 28 climate mitigation actions to achieve 9.8
million tonnes of GHG emission reductions by 2020.
9. Effectiveness of Cap & Trade program implementation
9.1 Scope of Cap & Trade program
The program covers seven GHG emissions including Carbon dioxide, Methane, and Nitrous oxide
which make for the 82% of the emissions, which is in line with California and Quebec50
. There
are sufficient annual declines to meet the 2020 targets. During the first compliance period, 82% of
the province’s emissions will be regulated under the cap that declines annually at an average rate
of 4.1% to achieve a 15% emissions reduction target by 2020.
49
(Ontario's five-year climate change action plan 2016-2020, 2016)
50
(But, 2016)
15
Fig 9.1 Emission reduction targets51
The program has a hybrid regulation of upstream and downstream. There is upstream regulation
for fuel distributors, natural gas, and electricity, which cover 54% of Ontario's forecast emissions
by 202052
. Upstream regulation of fuel distribution is expected to enhance the program's
administrative feasibility and implementation. The downstream approach covers 34% of the
forecast emissions from industrial activity by 2020. The smaller sources like agricultural, waste
emissions, aviation, and marine fuels are excluded to make it administratively simpler and
cheaper53
.
9.2 Distribution of benefits and costs
Based on the distribution of allowances, there could be greater gains accruing to the industry than
to consumers in the first compliance period54
. This is initially owing to the cost of free allowances
and the allowances for the fuel distributors paid by consumers. This could be a potential gain of
about $4.7 billion received from the distribution of allowances and the portion of cap and trade
proceeds accruing to industry. But, although it is not known with certainty when free allowances
will cease, transitional assistance is planned to be phased out. Also, from the climate change action
plan, it is expected that the cap and trade proceeds will be re-invested in activities that significantly
reduce the energy costs for households and contribute to greater societal benefits that persist after
2020. From the action plan, it is estimated that 80% of the benefits from cap and trade proceeds
will accrue to consumers.
9.3 Effectiveness of Market Design
Ontario’s market design is same as that of Quebec and California to enable linkage opportunities
in the future. This use of existing infrastructure will reduce implementation and transaction costs,
but, restrict flexibility to change market design. The market rules will enforce cost containment
measures including a price floor ($18 per tonne), price ceiling and strategic reserve to ensure that
the market does not fail. Ontario’s program meets the criteria of being transparent by disclosing
participant information and access to accounts. But, whether the carbon price is effective in
achieving significant emission reductions is to be seen. Policies towards renewables may lower
demand for fossil fuels causing low demand for allowances and drive carbon prices down.
Balancing the pace of change by allowing carbon reductions to be driven by the marketplace, rather
51
(MOECC, 2014)
52
(But, 2016)
53
(But, 2016)
54
(But, 2016)
16
than by instituting higher carbon prices to push behavioral changes in the society, is important.
Ontario’s cap and trade market is expected to use the CITSS55
(Compliance Instrument Tracking
System Service, used by WCI) to save infrastructure costs once linking occurs. Due to the checks
in the bid and auction processes that enforce the purchase and holding rules, higher monitoring
and oversight costs could be expected56
.
9.4 Transparency
The cost of free allowances represents a total of $3.27 billion by the end the first compliance
period. The basis for allocations will be supported by verified emissions prepared in accordance
with the requirements of the Reporting Regulation. It is appropriate to provide for transitory
assistance to mitigate uneconomic investments to reduce process and combustion emissions (as
was done in California). The use of auction and transitional assistance also attains the highest net
GHG reductions at the lowest cost. The extent of transitional assistance provided is expected to
help the industries that need it the most. In terms of flexibility arrangements, there will be
exemptions primarily for large increases in production for large emitters and a more moderate
decline of free allowances for facilities using biofuels. Transitory assistance appears to be provided
to help large emitters prepare for significant actions after 2020. With free allowances and
flexibility arrangements that relax certain program rules, it will be important to ensure accurate
reporting of the emissions produced.
9.5 Measurement and verification
A robust measurement, reporting and verification process is in place in Ontario to enable effective
linking with Quebec and California. The requirement to report greater detail on biomass types in
Ontario appears to be necessary, as the use of biomass can affect the amount of free allowances
provided to the industry57
. To ensure sustainable reductions, in the long run, it requires successful
enforcement of action plan initiatives, monitoring of the initiatives funded by cap and trade
proceeds, and consideration of complementary metrics to evaluate prospective climate change
action plan initiatives.
9.6 Integration with other measures
Ontario’s climate policy will integrate well with broader provincial and federal government
objectives. In terms of political considerations, there will be major energy use changes from
switching fossil fuels to renewable energy and electricity. In addition, there are planned changes
to municipal land-use planning and environmental assessment, consumer protection measures for
low-income consumers affected by carbon prices, and the need for community empowerment58
.
Besides the challenge that many of these policies are at a formative stage, the changes are complex
and require time to implement and enforce.
55
(Ontario Govt, 2012)
56
(But, 2016)
57
(But, 2016)
58
(Ontario's five-year climate change action plan 2016-2020, 2016)
17
In terms of economic policy considerations, there are major economic opportunities from
increasing the deployment of low-carbon technologies. Clean jobs and investment opportunities
are expected to come with the implementation of the climate change action plan. Low-interest
financing opportunities will be accelerated with the Green Bank, provided that its implementation
is successful in accelerating low-carbon technological growth.
In terms of environmental policy considerations, the inclusion of climate change in the
environmental assessment process has the potential to identify project risks earlier and lower future
costs of compliance. With considerable interest in leveraging the natural environment as carbon
sinks, it supports continued monitoring of the environment and how it will be used to displace
emissions from fossil fuels.
10. Conclusion
It can be concluded that the program has a wide scope and sufficient cap declines to meet the
targeted reduction of 80% by 2050. Effective distribution of benefits to consumers will depend on
the efficacy of the climate change action plan initiatives. The market has been designed with the
safeties of price floor, ceiling, and a strategic reserve. While administrative costs have been saved
by using the WCI model, sufficient monitoring and oversight costs can be expected. There are
sufficient transparency and checks in terms of measurement and verification. The program also
integrates well with federal policy, economic and environmental policy considerations.
11. Recommendations
 Assess the performance of the program by monitoring the rate of emission decline by
industry with cost of reductions. Adjust allowances and flexibility arrangements based on
cost of decline and the target reductions.
 Monitor action of complementary regulations which reduce GHG emissions and coordinate
spending to achieve in-phase action.
 Review the implementation of the program, progress of the action plan, and alignment with
federal climate policy.
18
References
12-cap-and-trade-pros-and-cons/. (2015, May 14). Retrieved from brandongaille.com:
http://brandongaille.com/12-cap-and-trade-pros-and-cons/
Austan Goolsbee, S. L. (2013). Section 16 - Externalities & Public goods. In S. L. Austan
Goolsbee, Microeconomics (pp. 643-678). New York: Worth.
Boundless Economics. (2017, January). Retrieved from Boundless:
https://www.boundless.com/economics/textbooks/boundless-economics-textbook/
But, J. (2016). Evaluation of Ontario's Cap and Trade Regulation. Toronto: FES, York
University.
cap-and-trade. (2016, October 25). Retrieved from www.canadianenergylaw.com:
http://www.canadianenergylaw.com/tags/cap-and-trade/
cap-and-trade-ontario. (2016, September 30). Retrieved from www.ontario.ca:
https://www.ontario.ca/page/cap-and-trade-ontario
cap-and-trade-pros-and-cons-list. (2015, June 25). Retrieved from occupytheory.org:
http://occupytheory.org/cap-and-trade-pros-and-cons-list/
cap-trade-will-raise-natural-gas-bills-across-ontario-oeb. (2016, December 22). Retrieved from
680news.com: http://www.680news.com/2016/12/22/cap-trade-will-raise-natural-gas-
bills-across-ontario-oeb/
Change, M. o. (2017). Registry - Ministry of Environment and Climate Change. Retrieved from
Ministry of Environment and Climate Change: https://www.ebr.gov.on.ca/
Climate change mitigation and Low carbon economy Act, 2016. (2016, May 18). Retrieved from
Ontario.ca: https://www.ontario.ca/laws/statute
climate-change-deal-premiers-prime-minister. (2016, December 7). Retrieved from
cbc.ca/news/politics: http://www.cbc.ca/news/politics/climate-change-deal-premiers-
prime-minister-1.3886426
climate-change-the-pros-and-cons-of-cap-and-trade. (2010, November 15). Retrieved from
steverichey.com: http://www.steverichey.com/writing-samples/climate-change/the-pros-
and-cons-of-cap-and-trade/
economics/carbon-tax-pros-and-cons. (2013, January 20). Retrieved from
www.economicshelp.org: http://www.economicshelp.org/blog/2207/economics/carbon-
tax-pros-and-cons/
Environment Economics - Negative Externality. (2008, February). Retrieved from Environment
Economics: http://www.env-econ.net/negative-externality.html
Environmental Defense Fund - Cap & Trade. (2017, January). Retrieved from Environmental
Defense Fund: https://www.edf.org/climate/how-cap-and-trade-works
19
Herriges, J. (2010, September). Principles of Microeconomics - Externalities. Wisconsin -
Madison, Iowa, USA.
Huffington Post. (2014, May 08). Retrieved from huffingtonpost.ca:
http://www.huffingtonpost.ca/candice-malcolm/carbon-tax_b_5651491.html
insights-resources/ontario-energy-board-decision-on-cap-trade-costs-why-reasons-for-decision-
are-essential-to-demonstrate-regulatory-independence. (2016, August 9). Retrieved from
gowlingwlg.com/en/canada: https://gowlingwlg.com/en/canada/insights-
resources/ontario-energy-board-decision-on-cap-trade-costs-why-reasons-for-decision-
are-essential-to-demonstrate-regulatory-independence
Investopedia - Cap & Trade. (2017, January). Retrieved from Investopedia:
http://www.investopedia.com/terms/c/cap-and-trade.asp
issues/climate-change/science/climate-solutions/carbon-tax-or-cap-and-trade/. (2014). Retrieved
from davidsuzuki.org: http://www.davidsuzuki.org/issues/climate-
change/science/climate-solutions/carbon-tax-or-cap-and-trade/
Klinsky, S. (2013). Bottom-up policy lessons emerging from the Western Climate Initiative's
development challenges. Climate Policy, 143-169.
Mankiw, G. N. (1997). Principles of Economics. Stamford, CT: Cengage Learning.
MOECC. (2014). Climate Change Update Report. Toronto.
National Observer. (2017, March 16). Retrieved from nationalobserver.com:
http://www.nationalobserver.com/2017/03/16/news/ontario-plans-team-california-
against-trump-climate-change
Nelson, J. A. (2003). Microeconomics in Context. New York: M E Sharpe.
Ontario Govt. (2012). Retrieved from Ontario - MOECC: https://www.ontario.ca/page/cap-and-
trade-register-and-participate-citss
Ontario Regulation 143/16 - Quatification Reporting & Verification of GHG emissions. (2016,
May 19). Retrieved from Onatrio.ca: https://www.ontario.ca/laws/statute
Ontario Regulation 144/16 - Cap & Trade Program. (2016, May 19). Retrieved from Ontario.ca:
https://www.ontario.ca/laws/statute
ontario-disaster-architects. (2016, December 7). Retrieved from cbc.ca/news/opinion:
http://www.cbc.ca/news/opinion/ontario-disaster-architects-1.3884108
Ontario's five year climate change action plan 2016-2020. (2016, June 8). Retrieved from
Ontario.ca: https://www.ontario.ca/laws/statute
ontarios-cap-and-trade-regime-off-to-a-shaky-start. (2016, March 3). Retrieved from
www.thestar.com: https://www.thestar.com/opinion/commentary/2016/03/03/ontarios-
cap-and-trade-regime-off-to-a-shaky-start.html
20
pros-cons-politics-of-cap-and-trade-versus-co2-taxes. (2009, May 19). Retrieved from
www.yaleclimateconnections.org: http://www.yaleclimateconnections.org/2009/05/pros-
cons-politics-of-cap-and-trade-versus-co2-taxes/
publications/cap-trade-vs-taxes. (n.d.). Retrieved from www.c2es.org:
http://www.c2es.org/publications/cap-trade-vs-taxes
The Star. (2016, October 3). Retrieved from thestar.com:
https://www.thestar.com/news/canada/2016/10/03/5-things-to-know-about-canadas-
carbon-pricing-plans.html
The Star. (2016, December 29). Retrieved from thestar.com:
https://www.thestar.com/news/queenspark/2016/12/29/ontario-business-groups-want-
cap-and-trade-program-delayed.html
the-political-history-of-cap-and-trade. (2009, August). Retrieved from
www.smithsonianmag.com: http://www.smithsonianmag.com/air/the-political-history-of-
cap-and-trade-34711212/

More Related Content

Similar to An Overview of Ontario's Cap & Trade Program

Public Administration Government and Tax
Public Administration Government and TaxPublic Administration Government and Tax
Public Administration Government and TaxHeinHtet844399
 
Complete Economic Environment & Business Unit 4 revision
Complete Economic Environment & Business Unit 4 revisionComplete Economic Environment & Business Unit 4 revision
Complete Economic Environment & Business Unit 4 revisionManishadhokia3105
 
Frontier report-competition-and-entry-in-the-gb-electricity-retail-market
Frontier report-competition-and-entry-in-the-gb-electricity-retail-marketFrontier report-competition-and-entry-in-the-gb-electricity-retail-market
Frontier report-competition-and-entry-in-the-gb-electricity-retail-marketDr Lendy Spires
 
Cost Audit and Cost Accounting Standards
Cost Audit and Cost Accounting StandardsCost Audit and Cost Accounting Standards
Cost Audit and Cost Accounting Standardskpgandhi
 
Curb it balance it emission management &cc using sap (2)
Curb it   balance it emission management &cc using sap (2)Curb it   balance it emission management &cc using sap (2)
Curb it balance it emission management &cc using sap (2)Prakash Wagh
 
2007 SAP Scholarship Submission
2007 SAP Scholarship Submission2007 SAP Scholarship Submission
2007 SAP Scholarship Submissiongturcotte
 
2007 SAP Scholarship Submission
2007 SAP Scholarship Submission2007 SAP Scholarship Submission
2007 SAP Scholarship Submissionguest2a2001d
 
2007 SAP Scholarship Submission
2007 SAP Scholarship Submission2007 SAP Scholarship Submission
2007 SAP Scholarship Submissionguest2a2001d
 
Assessing Impacts – Methodology in Practice, Cara Maguire
Assessing Impacts – Methodology in Practice, Cara MaguireAssessing Impacts – Methodology in Practice, Cara Maguire
Assessing Impacts – Methodology in Practice, Cara MaguireOECD Governance
 
Waxman-Markey Climate Bill
Waxman-Markey Climate BillWaxman-Markey Climate Bill
Waxman-Markey Climate Billmarkemmettwilson
 
Waxman-Markey Climate Bill
Waxman-Markey Climate BillWaxman-Markey Climate Bill
Waxman-Markey Climate Billmarkemmettwilson
 
Corporate Environmental Management – A New Paradigm Emerges
Corporate Environmental Management – A New Paradigm EmergesCorporate Environmental Management – A New Paradigm Emerges
Corporate Environmental Management – A New Paradigm EmergesTurlough Guerin GAICD FGIA
 
Cap and trade 2022.pptx
Cap and trade 2022.pptxCap and trade 2022.pptx
Cap and trade 2022.pptxJon Newland
 
Fca module 98
Fca module 98Fca module 98
Fca module 98Nitesh55
 
2020 Lecture 2 - Introduction to Appraisal.pptx
2020 Lecture 2 - Introduction to Appraisal.pptx2020 Lecture 2 - Introduction to Appraisal.pptx
2020 Lecture 2 - Introduction to Appraisal.pptxglasgowduo
 
Ontario Cap & Trade - Time is Running Out for Small & Medium Business to Save
Ontario Cap & Trade - Time is Running Out for Small & Medium Business to SaveOntario Cap & Trade - Time is Running Out for Small & Medium Business to Save
Ontario Cap & Trade - Time is Running Out for Small & Medium Business to SaveDuncan Rotherham
 
Ontario Cap & Trade - Time is Running Out for Small & Medium Business to Save
Ontario Cap & Trade - Time is Running Out for Small & Medium Business to SaveOntario Cap & Trade - Time is Running Out for Small & Medium Business to Save
Ontario Cap & Trade - Time is Running Out for Small & Medium Business to SaveSheldon Fernandes, P.Eng., MBA
 
Alex Wood: CBSR Carbon Pricing & Climate Policy
Alex Wood: CBSR Carbon Pricing & Climate Policy Alex Wood: CBSR Carbon Pricing & Climate Policy
Alex Wood: CBSR Carbon Pricing & Climate Policy Sustainable Prosperity
 

Similar to An Overview of Ontario's Cap & Trade Program (20)

Economics of waste
Economics of wasteEconomics of waste
Economics of waste
 
Public Administration Government and Tax
Public Administration Government and TaxPublic Administration Government and Tax
Public Administration Government and Tax
 
Complete Economic Environment & Business Unit 4 revision
Complete Economic Environment & Business Unit 4 revisionComplete Economic Environment & Business Unit 4 revision
Complete Economic Environment & Business Unit 4 revision
 
Frontier report-competition-and-entry-in-the-gb-electricity-retail-market
Frontier report-competition-and-entry-in-the-gb-electricity-retail-marketFrontier report-competition-and-entry-in-the-gb-electricity-retail-market
Frontier report-competition-and-entry-in-the-gb-electricity-retail-market
 
Cost Audit and Cost Accounting Standards
Cost Audit and Cost Accounting StandardsCost Audit and Cost Accounting Standards
Cost Audit and Cost Accounting Standards
 
Curb it balance it emission management &cc using sap (2)
Curb it   balance it emission management &cc using sap (2)Curb it   balance it emission management &cc using sap (2)
Curb it balance it emission management &cc using sap (2)
 
2007 SAP Scholarship Submission
2007 SAP Scholarship Submission2007 SAP Scholarship Submission
2007 SAP Scholarship Submission
 
2007 SAP Scholarship Submission
2007 SAP Scholarship Submission2007 SAP Scholarship Submission
2007 SAP Scholarship Submission
 
2007 SAP Scholarship Submission
2007 SAP Scholarship Submission2007 SAP Scholarship Submission
2007 SAP Scholarship Submission
 
Assessing Impacts – Methodology in Practice, Cara Maguire
Assessing Impacts – Methodology in Practice, Cara MaguireAssessing Impacts – Methodology in Practice, Cara Maguire
Assessing Impacts – Methodology in Practice, Cara Maguire
 
Waxman-Markey Climate Bill
Waxman-Markey Climate BillWaxman-Markey Climate Bill
Waxman-Markey Climate Bill
 
Waxman-Markey Climate Bill
Waxman-Markey Climate BillWaxman-Markey Climate Bill
Waxman-Markey Climate Bill
 
Corporate Environmental Management – A New Paradigm Emerges
Corporate Environmental Management – A New Paradigm EmergesCorporate Environmental Management – A New Paradigm Emerges
Corporate Environmental Management – A New Paradigm Emerges
 
Cap and trade 2022.pptx
Cap and trade 2022.pptxCap and trade 2022.pptx
Cap and trade 2022.pptx
 
Cost Accounting
Cost AccountingCost Accounting
Cost Accounting
 
Fca module 98
Fca module 98Fca module 98
Fca module 98
 
2020 Lecture 2 - Introduction to Appraisal.pptx
2020 Lecture 2 - Introduction to Appraisal.pptx2020 Lecture 2 - Introduction to Appraisal.pptx
2020 Lecture 2 - Introduction to Appraisal.pptx
 
Ontario Cap & Trade - Time is Running Out for Small & Medium Business to Save
Ontario Cap & Trade - Time is Running Out for Small & Medium Business to SaveOntario Cap & Trade - Time is Running Out for Small & Medium Business to Save
Ontario Cap & Trade - Time is Running Out for Small & Medium Business to Save
 
Ontario Cap & Trade - Time is Running Out for Small & Medium Business to Save
Ontario Cap & Trade - Time is Running Out for Small & Medium Business to SaveOntario Cap & Trade - Time is Running Out for Small & Medium Business to Save
Ontario Cap & Trade - Time is Running Out for Small & Medium Business to Save
 
Alex Wood: CBSR Carbon Pricing & Climate Policy
Alex Wood: CBSR Carbon Pricing & Climate Policy Alex Wood: CBSR Carbon Pricing & Climate Policy
Alex Wood: CBSR Carbon Pricing & Climate Policy
 

Recently uploaded

Tech Startup Growth Hacking 101 - Basics on Growth Marketing
Tech Startup Growth Hacking 101  - Basics on Growth MarketingTech Startup Growth Hacking 101  - Basics on Growth Marketing
Tech Startup Growth Hacking 101 - Basics on Growth MarketingShawn Pang
 
Insurers' journeys to build a mastery in the IoT usage
Insurers' journeys to build a mastery in the IoT usageInsurers' journeys to build a mastery in the IoT usage
Insurers' journeys to build a mastery in the IoT usageMatteo Carbone
 
Call Girls Pune Just Call 9907093804 Top Class Call Girl Service Available
Call Girls Pune Just Call 9907093804 Top Class Call Girl Service AvailableCall Girls Pune Just Call 9907093804 Top Class Call Girl Service Available
Call Girls Pune Just Call 9907093804 Top Class Call Girl Service AvailableDipal Arora
 
Lowrate Call Girls In Laxmi Nagar Delhi ❤️8860477959 Escorts 100% Genuine Ser...
Lowrate Call Girls In Laxmi Nagar Delhi ❤️8860477959 Escorts 100% Genuine Ser...Lowrate Call Girls In Laxmi Nagar Delhi ❤️8860477959 Escorts 100% Genuine Ser...
Lowrate Call Girls In Laxmi Nagar Delhi ❤️8860477959 Escorts 100% Genuine Ser...lizamodels9
 
VIP Kolkata Call Girl Howrah 👉 8250192130 Available With Room
VIP Kolkata Call Girl Howrah 👉 8250192130  Available With RoomVIP Kolkata Call Girl Howrah 👉 8250192130  Available With Room
VIP Kolkata Call Girl Howrah 👉 8250192130 Available With Roomdivyansh0kumar0
 
Intro to BCG's Carbon Emissions Benchmark_vF.pdf
Intro to BCG's Carbon Emissions Benchmark_vF.pdfIntro to BCG's Carbon Emissions Benchmark_vF.pdf
Intro to BCG's Carbon Emissions Benchmark_vF.pdfpollardmorgan
 
Vip Female Escorts Noida 9711199171 Greater Noida Escorts Service
Vip Female Escorts Noida 9711199171 Greater Noida Escorts ServiceVip Female Escorts Noida 9711199171 Greater Noida Escorts Service
Vip Female Escorts Noida 9711199171 Greater Noida Escorts Serviceankitnayak356677
 
Call Girls In Sikandarpur Gurgaon ❤️8860477959_Russian 100% Genuine Escorts I...
Call Girls In Sikandarpur Gurgaon ❤️8860477959_Russian 100% Genuine Escorts I...Call Girls In Sikandarpur Gurgaon ❤️8860477959_Russian 100% Genuine Escorts I...
Call Girls In Sikandarpur Gurgaon ❤️8860477959_Russian 100% Genuine Escorts I...lizamodels9
 
0183760ssssssssssssssssssssssssssss00101011 (27).pdf
0183760ssssssssssssssssssssssssssss00101011 (27).pdf0183760ssssssssssssssssssssssssssss00101011 (27).pdf
0183760ssssssssssssssssssssssssssss00101011 (27).pdfRenandantas16
 
Lowrate Call Girls In Sector 18 Noida ❤️8860477959 Escorts 100% Genuine Servi...
Lowrate Call Girls In Sector 18 Noida ❤️8860477959 Escorts 100% Genuine Servi...Lowrate Call Girls In Sector 18 Noida ❤️8860477959 Escorts 100% Genuine Servi...
Lowrate Call Girls In Sector 18 Noida ❤️8860477959 Escorts 100% Genuine Servi...lizamodels9
 
Non Text Magic Studio Magic Design for Presentations L&P.pptx
Non Text Magic Studio Magic Design for Presentations L&P.pptxNon Text Magic Studio Magic Design for Presentations L&P.pptx
Non Text Magic Studio Magic Design for Presentations L&P.pptxAbhayThakur200703
 
Regression analysis: Simple Linear Regression Multiple Linear Regression
Regression analysis:  Simple Linear Regression Multiple Linear RegressionRegression analysis:  Simple Linear Regression Multiple Linear Regression
Regression analysis: Simple Linear Regression Multiple Linear RegressionRavindra Nath Shukla
 
Monte Carlo simulation : Simulation using MCSM
Monte Carlo simulation : Simulation using MCSMMonte Carlo simulation : Simulation using MCSM
Monte Carlo simulation : Simulation using MCSMRavindra Nath Shukla
 
Keppel Ltd. 1Q 2024 Business Update Presentation Slides
Keppel Ltd. 1Q 2024 Business Update  Presentation SlidesKeppel Ltd. 1Q 2024 Business Update  Presentation Slides
Keppel Ltd. 1Q 2024 Business Update Presentation SlidesKeppelCorporation
 
Catalogue ONG NUOC PPR DE NHAT .pdf
Catalogue ONG NUOC PPR DE NHAT      .pdfCatalogue ONG NUOC PPR DE NHAT      .pdf
Catalogue ONG NUOC PPR DE NHAT .pdfOrient Homes
 
Russian Faridabad Call Girls(Badarpur) : ☎ 8168257667, @4999
Russian Faridabad Call Girls(Badarpur) : ☎ 8168257667, @4999Russian Faridabad Call Girls(Badarpur) : ☎ 8168257667, @4999
Russian Faridabad Call Girls(Badarpur) : ☎ 8168257667, @4999Tina Ji
 
M.C Lodges -- Guest House in Jhang.
M.C Lodges --  Guest House in Jhang.M.C Lodges --  Guest House in Jhang.
M.C Lodges -- Guest House in Jhang.Aaiza Hassan
 
/:Call Girls In Jaypee Siddharth - 5 Star Hotel New Delhi ➥9990211544 Top Esc...
/:Call Girls In Jaypee Siddharth - 5 Star Hotel New Delhi ➥9990211544 Top Esc.../:Call Girls In Jaypee Siddharth - 5 Star Hotel New Delhi ➥9990211544 Top Esc...
/:Call Girls In Jaypee Siddharth - 5 Star Hotel New Delhi ➥9990211544 Top Esc...lizamodels9
 

Recently uploaded (20)

Tech Startup Growth Hacking 101 - Basics on Growth Marketing
Tech Startup Growth Hacking 101  - Basics on Growth MarketingTech Startup Growth Hacking 101  - Basics on Growth Marketing
Tech Startup Growth Hacking 101 - Basics on Growth Marketing
 
Insurers' journeys to build a mastery in the IoT usage
Insurers' journeys to build a mastery in the IoT usageInsurers' journeys to build a mastery in the IoT usage
Insurers' journeys to build a mastery in the IoT usage
 
KestrelPro Flyer Japan IT Week 2024 (English)
KestrelPro Flyer Japan IT Week 2024 (English)KestrelPro Flyer Japan IT Week 2024 (English)
KestrelPro Flyer Japan IT Week 2024 (English)
 
Call Girls Pune Just Call 9907093804 Top Class Call Girl Service Available
Call Girls Pune Just Call 9907093804 Top Class Call Girl Service AvailableCall Girls Pune Just Call 9907093804 Top Class Call Girl Service Available
Call Girls Pune Just Call 9907093804 Top Class Call Girl Service Available
 
Lowrate Call Girls In Laxmi Nagar Delhi ❤️8860477959 Escorts 100% Genuine Ser...
Lowrate Call Girls In Laxmi Nagar Delhi ❤️8860477959 Escorts 100% Genuine Ser...Lowrate Call Girls In Laxmi Nagar Delhi ❤️8860477959 Escorts 100% Genuine Ser...
Lowrate Call Girls In Laxmi Nagar Delhi ❤️8860477959 Escorts 100% Genuine Ser...
 
VIP Kolkata Call Girl Howrah 👉 8250192130 Available With Room
VIP Kolkata Call Girl Howrah 👉 8250192130  Available With RoomVIP Kolkata Call Girl Howrah 👉 8250192130  Available With Room
VIP Kolkata Call Girl Howrah 👉 8250192130 Available With Room
 
Intro to BCG's Carbon Emissions Benchmark_vF.pdf
Intro to BCG's Carbon Emissions Benchmark_vF.pdfIntro to BCG's Carbon Emissions Benchmark_vF.pdf
Intro to BCG's Carbon Emissions Benchmark_vF.pdf
 
Vip Female Escorts Noida 9711199171 Greater Noida Escorts Service
Vip Female Escorts Noida 9711199171 Greater Noida Escorts ServiceVip Female Escorts Noida 9711199171 Greater Noida Escorts Service
Vip Female Escorts Noida 9711199171 Greater Noida Escorts Service
 
Call Girls In Sikandarpur Gurgaon ❤️8860477959_Russian 100% Genuine Escorts I...
Call Girls In Sikandarpur Gurgaon ❤️8860477959_Russian 100% Genuine Escorts I...Call Girls In Sikandarpur Gurgaon ❤️8860477959_Russian 100% Genuine Escorts I...
Call Girls In Sikandarpur Gurgaon ❤️8860477959_Russian 100% Genuine Escorts I...
 
0183760ssssssssssssssssssssssssssss00101011 (27).pdf
0183760ssssssssssssssssssssssssssss00101011 (27).pdf0183760ssssssssssssssssssssssssssss00101011 (27).pdf
0183760ssssssssssssssssssssssssssss00101011 (27).pdf
 
Lowrate Call Girls In Sector 18 Noida ❤️8860477959 Escorts 100% Genuine Servi...
Lowrate Call Girls In Sector 18 Noida ❤️8860477959 Escorts 100% Genuine Servi...Lowrate Call Girls In Sector 18 Noida ❤️8860477959 Escorts 100% Genuine Servi...
Lowrate Call Girls In Sector 18 Noida ❤️8860477959 Escorts 100% Genuine Servi...
 
Non Text Magic Studio Magic Design for Presentations L&P.pptx
Non Text Magic Studio Magic Design for Presentations L&P.pptxNon Text Magic Studio Magic Design for Presentations L&P.pptx
Non Text Magic Studio Magic Design for Presentations L&P.pptx
 
Forklift Operations: Safety through Cartoons
Forklift Operations: Safety through CartoonsForklift Operations: Safety through Cartoons
Forklift Operations: Safety through Cartoons
 
Regression analysis: Simple Linear Regression Multiple Linear Regression
Regression analysis:  Simple Linear Regression Multiple Linear RegressionRegression analysis:  Simple Linear Regression Multiple Linear Regression
Regression analysis: Simple Linear Regression Multiple Linear Regression
 
Monte Carlo simulation : Simulation using MCSM
Monte Carlo simulation : Simulation using MCSMMonte Carlo simulation : Simulation using MCSM
Monte Carlo simulation : Simulation using MCSM
 
Keppel Ltd. 1Q 2024 Business Update Presentation Slides
Keppel Ltd. 1Q 2024 Business Update  Presentation SlidesKeppel Ltd. 1Q 2024 Business Update  Presentation Slides
Keppel Ltd. 1Q 2024 Business Update Presentation Slides
 
Catalogue ONG NUOC PPR DE NHAT .pdf
Catalogue ONG NUOC PPR DE NHAT      .pdfCatalogue ONG NUOC PPR DE NHAT      .pdf
Catalogue ONG NUOC PPR DE NHAT .pdf
 
Russian Faridabad Call Girls(Badarpur) : ☎ 8168257667, @4999
Russian Faridabad Call Girls(Badarpur) : ☎ 8168257667, @4999Russian Faridabad Call Girls(Badarpur) : ☎ 8168257667, @4999
Russian Faridabad Call Girls(Badarpur) : ☎ 8168257667, @4999
 
M.C Lodges -- Guest House in Jhang.
M.C Lodges --  Guest House in Jhang.M.C Lodges --  Guest House in Jhang.
M.C Lodges -- Guest House in Jhang.
 
/:Call Girls In Jaypee Siddharth - 5 Star Hotel New Delhi ➥9990211544 Top Esc...
/:Call Girls In Jaypee Siddharth - 5 Star Hotel New Delhi ➥9990211544 Top Esc.../:Call Girls In Jaypee Siddharth - 5 Star Hotel New Delhi ➥9990211544 Top Esc...
/:Call Girls In Jaypee Siddharth - 5 Star Hotel New Delhi ➥9990211544 Top Esc...
 

An Overview of Ontario's Cap & Trade Program

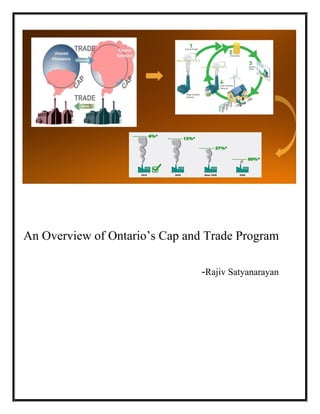
  • 1. An Overview of Ontario’s Cap and Trade Program -Rajiv Satyanarayan
  • 2. Contents 1. Executive Summary 1 2. Economics Theory behind Cap & Trade 2 2.1 Externality 2.2 Implications of an Externality 2.3 Negative Externality 2.4 Possible solutions 2.4.1 Solutions using Price – Pigouvian Taxes 2.4.2 Solutions using Quantity – Quotas 2.4.3 Market based solutions – Tradeable permits 2.5 Cap & Trade 3. Pros & Cons of Cap & Trade 4 3.1 Pros 3.2 Cons 4. Comparison of Cap & Trade to alternatives 5 4.1 Comparison of Price and Quantity based corrections 4.2 Comparison with Tradeable permits market 4.3 Similarities and Differences 5. Historical Successes & Failures of Cap & Trade 6 6. Ontario Government’s Rationale for choosing Cap & Trade 8 7. Critical Opinion on Cap & Trade 7 7.1 Criticism pertaining to competitiveness of Ontario’s industries 8. Working of Ontario’s Cap & Trade Program 11 8.1 Relevant Regulations and Acts 8.2 Greenhouse Gases and Reduction targets 8.3 Businesses affected 8.4 Registration and Reporting 8.5 Emission Allowances 8.6 Auctions and Sales 8.7 Proceeds from the Cap and Trade Program 9. Effectiveness of Cap & Trade program implementation 14 9.1 Scope of Cap & Trade program 9.2 Distribution of benefits and costs 9.3 Effectiveness of Market Design 9.4 Transparency 9.5 Measurement and verification 9.6 Integration with other measures 10. Conclusion 17 11. Recommendations 17 References 18
  • 3. 1 1. Executive Summary As part of its Anti-climate change framework of regulations, the Ontario government passed Regulation 144/16 on 19th May 2016 for implementing a Cap and Trade Program for Green House Gas emissions. This paper provides an overview of the economics behind the program, evaluates the program’s efficacy and provides recommendations to ensure optimal execution. Economics theory defines Efficient Markets as those where all transactions benefit the society as a whole. Externalities are a type of Market Failure which hinder markets from being efficient. They are a cost or a benefit that affects a third party not directly involved in the economic transaction. Negative externalities (like GHG emissions) impose costs on third parties who are not directly involved in the transaction. Of the available solutions to ‘internalize' a negative externality, market-based tradeable permits are theoretically the most efficient. However, in practice, while it provides a certainty of GHG reduction, it is administratively complicated to implement. The Cap and Trade program works under the framework set by the Climate Change Mitigation and Low-carbon Economy Act passed by the Ontario government on 18th May 2016. The program will join the Western Climate Initiative model cap and trade program which includes Québec and California. Further, the actions of Ontario's Five Year Climate Change Action Plan 2016 – 2020, will be funded by the cap and trade program. The aim of the framework is to achieve 80% GHG reduction by the end of 2050. The following lessons have been learned from past cap and trade programs: -  Prudent allocation of allowances – Over allocation may cause a low carbon price and render the program ineffective, while under allocation may cause industries to move to other jurisdictions. To allocate accurately, extensive measurement and verification data are required.  Banking allowances – Ability to bank allowances over multiple periods should be available in the program to give flexibility to industries.  Coordinating complementary policies – Other policies which reduce GHG emissions should be coordinated to ensure required carbon price. It can be concluded that the program has a wide scope and sufficient cap declines to meet the targeted reduction of 80% by 2050. Effective distribution of benefits to consumers will depend on the efficacy of the climate change action plan initiatives. The market has been designed with the safeties of a price floor, ceiling, and a strategic reserve. While administrative costs have been saved by using the WCI model, sufficient monitoring and oversight costs can be expected. There are sufficient transparency and checks in terms of measurement and verification. The program also integrates well with federal policy, economic and environmental policy considerations. Recommendations: -  Assess the performance of the program by monitoring the rate of emission decline by industry with the cost of reductions. Adjust allowances and flexibility arrangements based on the cost of decline and the target reductions.
  • 4. 2  Monitor action of complementary regulations which reduce GHG emissions and coordinate spending to achieve in phase action.  Review the implementation of the program, the progress of the action plan, and alignment with the federal climate policy. 2. Economics Theory behind Cap & Trade Before we examine Cap & Trade as a solution, we need to understand the problem it is trying to solve. This section endeavors to give a brief on the economics behind the issue and the solution. 2.1 Externality Economics theory defines Efficient Markets as those where all transactions benefit the society1 . Externalities are a type of Market Failure which hinder markets from being efficient. An Externality can be defined as a cost or a benefit that affects a third party not directly involved in the economic transaction1 . Externalities violate the ‘Exclusivity’ principle of efficient markets2 . Exclusivity requires that all benefits and costs accrued as the result of owning and using the resources should accrue to only the owner2 . Negative externalities impose costs while positive externalities benefit third parties who are not directly involved in the transaction1 . 2.2 Implications of an Externality In a free market, voluntary exchange is considered mutually beneficial to both parties involved, because buyers or sellers would not trade if either thought it detrimental to themselves. However, a transaction can cause additional effects on third parties. From the perspective of these third parties, the effects may be negative (adding costs), or positive (giving benefits). The existence of externalities will result in outcomes that are not socially optimal. Those who suffer from external costs do so involuntarily, whereas those who enjoy external benefits do so at no cost3 . 2.3 Negative Externality Air pollution and in our case, Green House Gases (GHG) are a negative externality. If we take the example of a thermal power plant which produces electric power by burning fuels which generate GHG as a byproduct, the negative externality of GHG causes the market to produce more electricity than is socially optimal as the cost to society of GHG is ignored. 2.4 Possible solutions We have seen that a free market produces more goods than optimal with a negative externality if left on its own4 . This inefficiency may be reduced by market intervention by the government or economic actors. Market intervention may be done by controlling the price or quantity of the good produced. Increasing the price to reflect true social costs or decreasing the quantity to efficient levels will steer the market away from inefficiency. 1 (Austan Goolsbee, 2013) 2 (Herriges, 2010) 3 (Boundless Economics, 2017) 4 (Austan Goolsbee, 2013)
  • 5. 3 2.4.1 Solutions using Price - Pigouvian Taxes This type of tax (named after English economist Arthur Cecil Pigou) raises a good’s price to take into account the external costs imposed by a negative externality. It brings equilibrium in the market toward an efficient level of output and price5 . In effect, the Pigouvian tax ‘internalizes’ the emission externality. That is, it forces the industry to take into account the external damage of its operations when it decides how much electricity to generate. This process results in the efficient market outcome. These taxes are also called Carbon taxes as they tax the carbon produced. 2.4.2 Solutions using Quantity – Quotas The quantity-based approach is to set a quota, a mandated limit on the quantity of a good or an externality a producer can make or a consumer can buy6 . By regulating output, the amount of the externality associated with producing this output is also regulated. Quantity can also be controlled with licensing, where only a particular amount of an activity (production or consumption) is allowed by authorities. 2.4.3 Market-based solutions – Tradeable permits Trying to control the total externality in a market by restricting each firm’s quantity or determining the correct amount of tax involves a lot of data, predictions, effort and still involve errors. It is also very difficult for a regulator to know what each firm’s costs are and set quantity restrictions or taxes appropriately. It is, therefore, preferable to allow firms to jointly determine how best to reduce an externality to its optimal level. Tradable permits for emission can achieve this. These are permits issued to firms by the government that allow the holder to emit a certain amount7 . After the permits are allocated among firms, they may be traded between firms, allowing some firms to emit a greater amount than other firms. In essence, a market for emissions develops. Such systems are called ‘cap and trade’ programs for this reason: The government sets a cap on emissions, issues an amount of permits equal to this cap, and then firms trade the rights among them. 2.5 Cap & Trade We have seen that Cap & Trade is a type of market correction to reduce the inefficiency caused by GHG emissions as a negative externality. Its advantage is that it is a market based solution and allows firms to jointly determine how best to reduce an externality to its optimal level through tradable permits for emissions. It develops a market for emissions where the government sets a cap on emissions, issues an amount of permits equal to this cap, and then firms trade the rights among them. Cap and trade, or emissions trading, is a common term for a government regulatory program designed to limit, or cap, the total level of specific chemical by-products resulting from private business activity8 . Cap and trade's purpose is to create a market price for emissions or pollutants that did not previously exist and address possible negative externalities. The government sets a 5 (Nelson, 2003) 6 (Mankiw, 1997) 7 (Austan Goolsbee, 2013) 8 (Investopedia - Cap & Trade, 2017)
  • 6. 4 total limit on annual emissions of greenhouse gases. This is the ‘cap’. The cap is designed to shrink each year. After the cap has been determined, allowances for portions of the total limit are allocated. Such allocations, or permits, are handed out to businesses who are registered. Companies which produce a higher level of total emissions than their permits allow have to buy permits. Companies can also sell off any unused allowance to other producers. This is the ‘trade’. The cap allows the government and the businesses to plan ahead9 . The government can set an environmental goal to be achieved and businesses can plan process improvements and investments to achieve the same. The trading allows flexibility to businesses in achieving the emission cuts. Firms which can easily achieve cuts can do so and even trade permits to generate revenue. Others who find it to be difficult may opt to purchase permits than invest in process improvements. 3. Pros & Cons of Cap & Trade 3.1 Pros As discussed in Section 2.4 before, the main advantage of cap and trade is that it is more efficient in achieving the aim of reducing emissions as compared to its alternatives. Companies which can reduce their emissions at a low cost will do so, and sell the emissions credits to companies who cannot10 . Also, the given level of emissions which is a maximum is pre-determined. A certain number of emissions credits are made available to businesses in a variety of ways. By gradually decreasing the maximum level of emissions, long-term goals to reduce emissions can be met. This maximum level can be decreased by government purchases of emissions which are then retired, or by pro- environmental groups who can purchase and retire credits to decrease the harmful effects of climate change11 . Another benefit is of increased governmental revenue. This can be used to further energy efficiency, addressing climate change or make energy more affordable for low-income families12 . 3.2 Cons Cap & Trade indirectly encourages the industries who find it difficult to limit emissions because it is possible to purchase cheap offsets or carbon credits rather than invest in costlier upgrades13 . Sometimes these credits are just given away, creating no trade benefit at all. This means it costs a business nothing to expand their emissions and that can harm a local economy, which receives no economic gain in return14 . 9 (Environmental Defense Fund - Cap & Trade, 2017) 10 (climate-change-the-pros-and-cons-of-cap-and-trade, 2010) 11 (climate-change-the-pros-and-cons-of-cap-and-trade, 2010) 12 (12-cap-and-trade-pros-and-cons/, 2015) 13 (12-cap-and-trade-pros-and-cons/, 2015) 14 (12-cap-and-trade-pros-and-cons/, 2015)
  • 7. 5 While the ability of the government to purchase credits is advantageous, it is also a disadvantage as it means that taxpayer money is used to purchase something that is not used (credits are retired) and could potentially stagnate industry development. It creates higher prices for goods and services. As renewable energy resources are relatively new and so relatively expensive, industries that do transition into lower emissions and follow cap rules, do so at a cost. These get passed along to the consumers as higher prices. The policy is not the uniform across countries. This causes fluctuating prices if multiple countries are involved in a common auction like the Western Climate Initiative in which Ontario is involved. It also provides global companies chances at arbitrage15 . 4. Comparison of Cap & Trade to alternatives Let us consider similarities and differences of the three measures: Quotas, taxes, and tradeable permits.  Correction of market failure - All three measures have as their objective as correction of an existing market failure. Without these, sources responsible for GHG emissions do not have to pay for the damages they impose on society as a whole. The failure to internalize these costs would lead to greater levels of emissions than would be socially optimal.  Price on carbon - Taxes and cap and trade both put a price on carbon and thus correct the market failure. Both approaches create an incentive to develop and invest in energy-saving technologies. Quotas put an indirect price by imposing on polluters to invest in reducing pollution to keep it below the specified quota to stay in business.  Use of market efficiencies - Unlike quotas, the other two harness market forces to achieve the lowest cost reductions in GHG emissions.  Generate revenue - A tax by definition is designed to raise revenue, but a cap and trade system, to the extent that allowances are auctioned, can also raise similar amounts of revenue. How such revenues are used becomes an important issue in both systems. Quotas do not generate revenue.  Impose a compliance obligation - Depending on who pays the tax or is responsible for holding allowances, the number of firms directly impacted by these systems can be large or small. Most proposals focus on a limited number of firms with the goal of maximizing emissions coverage and reducing administrative costs. Quotas are imposed on entire industries or area jurisdictions.  Require monitoring, reporting, and verification - All three systems require similar data on emissions, reporting and verification of that data, and enforcement in the event of noncompliance.  Uncertainty - By setting a cap and issuing a corresponding number of allowances, a cap and trade system achieves a set environmental goal, but the cost of reaching that goal is determined by market forces. In contrast, a tax provides certainty about the costs of compliance, but the resulting reductions in GHG emissions are not predetermined and would result from market forces. A quota sets only a cap. 15 (cap-and-trade-pros-and-cons-list, 2015)
  • 8. 6  Compliance flexibility - A tax requires a firm each year to decide how much to reduce its emissions and how much tax to pay. Under a cap and trade system, borrowing, banking and extended compliance periods allow firms the flexibility to make compliance planning decisions on a multi-year basis. Quotas allow no flexibilities.  The impact of economic conditions - Changes in economic activity impact a firm’s behavior. Under a cap and trade system, reduced economic growth would lower allowance prices. Under a tax, government action to lower the amount of the tax, not market forces, would be required to reduce the carbon price seen by firms. In times of economic expansion, the opposite would be true - under cap and trade, allowance prices would rise based on market forces, but taxes would remain the same unless adjusted through government action. In this sense, cap and trade can be seen as providing a self-adjusting price. A tax or quota, in contrast, would need adjusting.  Other cases - A carbon tax might be the simplest to administer. Setting up a complex cap and trade arrangement that is comprehensive has high institutional needs. Cap and trade also involves transaction costs in buying and selling permits. Considered globally, it also may cause a Free Rider Problem16 . The problem of excess carbon emissions is a global problem and so needs to be a global solution. If carbon trading is introduced in one country but not others, it may cause production to shift to countries without the scheme. In summary, both cap and trade programs and carbon taxes can work well as long as they are designed to provide a strong economic signal to switch to cleaner energy. Cap and trade has one key environmental advantage over a carbon tax17 : It provides more certainty about the amount of emissions reductions that will result but little certainty about the price of emissions (which is set by the emissions trading market). A carbon tax also has one key advantage2 : It is easier and quicker for governments to implement. It can rely on existing administrative structures for taxing fuels and can, therefore, be implemented in just a few months. In theory, the same applies to cap and trade systems, but in practice, they tend to be much more complex. More time is required to develop the necessary regulations, and they are more susceptible to lobbying and loopholes18 . Cap and trade also requires the establishment of an emissions trading market. 5. Historical Successes & Failures of Cap & Trade Cap & Trade was first adopted as ‘Emissions trading’ as part of the clean air act in the USA, in 199019 , to control power plants from causing acid rain. The cap took effect from 1995 and cut emissions by three million tons that year, ahead of schedule. It also proved that cap & trade is the least expensive way to control emissions, as found previously by computer simulations. Measures to tackle GHG emissions began in Rio in 1992, when 160 countries became part of the UN Framework Convention on Climate Change (UNFCCC). The UNFCCC is simply a framework and the necessary details were settled by the Conference of Parties (CoP) to the UNFCCC. In 1997, the CoP agreed to the Kyoto Protocol where 38 developed countries committed themselves to 16 (economics/carbon-tax-pros-and-cons, 2013) 17 (issues/climate-change/science/climate-solutions/carbon-tax-or-cap-and-trade/, 2014) 18 (pros-cons-politics-of-cap-and-trade-versus-co2-taxes, 2009) 19 (the-political-history-of-cap-and-trade, 2009)
  • 9. 7 targets and timetables for the reduction of GHGs. International mechanisms which would allow developed countries flexibility to meet their targets were included in the Kyoto Protocol. Countries would also be able to use International Emissions Trading. Nations that emit less than their quota would be able to sell assigned amount units to nations that exceed their quotas. It is also possible for countries to sponsor carbon projects that reduce greenhouse gas emissions in other countries. The EU ETS is the largest multinational GHG trading system. It is also the system which has seen the most problems. RGGI was formed in 2003 by New York State with nine north east US states. Lessons learned with the European Union Emission Trading System (EU ETS) and the Regional Greenhouse Gas Initiative (RGGI) have shown the need to manage costs and volatility with cost containment measures20 . The EU ETS was initially implemented in phases, with a pilot Phase I from 2005-2007, followed by a Kyoto Phase II from 2008-2012 and a number of subsequent phases. The initial system covered approximately half of EU CO2 emissions across 31 EU countries. The system was limited to certain sectors, as many sectors, such as transportation, were exempted because of concerns about competitiveness with non-participating jurisdictions21 . The initial process for setting caps on emissions was decentralized by member states, which created strong incentives for individual states to propose high cap limits that favored emission intensive industries in their jurisdiction. This, combined with weak emissions data, led to an overly generous allocation of allowances relative to emissions when the market opened in 2005. While the price of allowances was initially high, the oversupply in the market quickly depressed demand and prices, causing the price of a single allowance to drop from €30 in 2005 to effectively €0 by 2007. The EU responded in subsequent phases with a planned tightening and centralization of the cap, an expanded scope of covered industries, and an ability to bank allowances between phases. While this initially increased allowance prices to over €20, prices have continued to bottom since that point. The current price varies between €0 and €10. This is in part due to a combination of a weakened post-recession EU economy and the increased use of offsets under the Clean Development Mechanism, which grants allowances for offset projects in developing countries. The following lessons can be learned from the above 22  Addressing Over-Allocation - Over-allocation can be banked by companies to keep the price of allowances low for years to come. Avoiding such over-allocation requires good data on emissions to base an initial cap.  Banking Allowances - Ability to bank allowances over multiple periods should be available in the program. While such a model can exacerbate the negative effects of allowance over-allocation, it is necessary to avoid an external collapse of allowance prices at the end of a given period.  Limiting Free or Exempt Allowances - Granting free allowances to certain sectors is a risky way to deal with issues of competitiveness. When allocations are not linked to 20 (Klinsky, 2013) 21 (cap-and-trade, 2016) 22 (cap-and-trade, 2016)
  • 10. 8 production, they cannot affect marginal costs, which eliminates incentives to reduce or relocate emissions for entire sectors.  Robust Offset Rules - Offset policies must be properly monitored and maintained. The increasing popularity of the Clean Development Mechanism lies in its allowing companies to apply for offsets when they reduce emissions in foreign jurisdictions.  Coordinating Complementary Policies - It has been suggested that the issues with the EU ETS are caused by complementary EU environmental policies related to the cap and trade program. These policies, in the view of their critics, relocate emissions, increase emissions reduction costs, and, in the absence of a price floor, depress allowance prices. 6. Ontario Government’s Rationale for choosing Cap & Trade The Cap & Trade program is one measure in a long line of initiatives taken to handle climate change23 . The Ontario government24 indicates that the province is responsible for about 1% of global GHG emissions and is one of the largest per capita emitters in the world. The government’s measures, culminating in the Climate Change Action Plan, will lower Ontario’s emissions by 8 to 10 mega-tonnes by 2020. The Green Energy Act in 2009, incentives for electric vehicles in 2010, energy efficiency building standards in 2012, ending coal-fired power plants in 2014, announcement of cap and trade program in 2015 and finally the Climate change action plan in 2016 have been the measures taken so far in that direction. Although Ontario began this journey as a province long back, other provinces will have to follow suit soon with the federal government announcing a national floor price for carbon in October 201625 . After this announcement, the provinces will have a choice between carbon taxes and cap and trade. Ontario made the same choice in 2015. The government indicates the following reasons for choosing the cap and trade program26 : -  Cap and trade are more efficient than other alternatives as it uses market forces to achieve lowest cost emissions cuts. A carbon tax would require extensive data to fix efficient limits on emissions and an accurate price for the tax.  It gives flexibility in planning to individual industries. They have the choice of purchasing permits or investing in emission efficient measures in the time frame suitable to them. Carbon tax not only is inflexible, it does not even cater to the state of the economy.  Becoming a signatory of Western Climate Initiative with Quebec and California will reduce administrative costs by joining an existing system.  It will allow the government to protect certain industries, by providing assistance in the form of permits, where risk exists of production moving to other locations.  It will create a transparent revenue-neutral system as the funds generated will be handled by an independent agency to invest in the climate change action plan. Carbon tax will be part of other revenues generated by the government and will not provide transparency. 23 (Climate change mitigation and Low carbon economy Act, 2016, 2016) 24 (cap-and-trade-Ontario, 2016) 25 (The Star, 2016) 26 (Change, 2017)
  • 11. 9  The program gives certainty to achievement of the goal of 80% reduction in emissions by 2050. Carbon taxes would provide certainty on the price of carbon but not on the reductions. Also, carbon taxes would cause reductions due to industries leaving Ontario (50% reductions would be due to that). However, besides the rational reasons provided above, the main reason for the provincial government to not opt for carbon taxes was public opinion27 . With a sluggish economy and electricity bills already increasing due to the Green Energy Act, a move towards carbon taxes would have angered the public. A carbon tax would increase shipping costs and thus prices on all necessities like food and clothing. It would, therefore, be a tax which would affect the tax payers. Instead, a cap and trade program could be made transparent to be revenue neutral, thus calming the public. The government indicates that cap and trade is projected to generate about $1.9 billion per year in proceeds. This will be invested into programs that save homeowners energy and money. The program will be revenue neutral and every dollar collected through cap and trade will be invested back into projects that reduce greenhouse gas pollution, such as public transit, electric vehicle incentives, and social housing retrofits. Also, researchers, entrepreneurs, and start-ups will benefit as their new technologies are needed to meet the emissions reduction challenge. This will bring jobs and economic benefits in the growing global market for climate-friendly products. The government has already committed $325 million to the Green Investment Fund for projects that will fight climate change, grow the economy and create jobs. The government estimates that internalizing the cost of emissions will not affect electricity costs much as 90% of power generated in Ontario is emissions free (predominantly Nuclear). It indicates that Gasoline will cost 4.3 cents more per litre and Natural gas $5 more per month. The total cost per month for the average household is estimated to be $13. 7. Critical Opinion on Cap & Trade There has been wide spread criticism of the Ontario government on the Cap & Trade program. Premier Kathleen Wynne’s approval rating is presently at 15% and 58% of the electorate believe she should resign28 . However, more than the program itself, this is in expectation of the outcome - higher electricity bills and increased cost of gasoline. The price of natural gas will also rise29 . To add to that, OEB’s decision to not show the additional cost as a separate bill line item has led to criticism of not being transparent30 . Finally, the dissent is amplified due to higher cost of electricity being paid for by Ontarians since the Green Energy Act in 2009. The person being held responsible for this is Gerald Butts, Senior Advisor to the Premier from 2003 to 2008. The criticism moves to include Ontario's Cap & Trade program as part of the pan-Canadian framework for clean growth and climate change, which is Canada's plan to meet the 2030 target 27 (Huffington Post, 2014) 28 (Ontario-disaster-architects, 2016) 29 (cap-trade-will-raise-natural-gas-bills-across-Ontario-oeb, 2016) 30 (insights-resources/Ontario-energy-board-decision-on-cap-trade-costs-why-reasons-for-decision-are-essential- to-demonstrate-regulatory-independence, 2016)
  • 12. 10 of GHG emission reduction31 . This plan features a minimum national carbon price of $15 per tonne32 . The skepticism is partly because of the higher costs and partly because the program will generate $ 8 billion in revenues for the government33 . While public opinion is partly in favor of making the program revenue neutral, part skepticism is towards efficient use of the revenue generated. The government is trying to address both concerns by indicating that the generated funds will be handled by a transparent Green Bank and issue a plan on how the funds will be spent. However, with functioning of the Green Bank still unclear, this has not helped much. Besides the above criticism of rising costs on the common consumer, there are doubts about the efficacy of the program in meeting its aim of reducing GHG emissions to the required level34 . There is speculation that too many free permits have been issued and that the increase in cost of gasoline will not push consumers towards electric vehicles. We have seen that the cap set and the number of free permits given out by the government will decide the market price for carbon. Achieving a right price for carbon will be critical to avoid the problems faced by ETS. 7.1 Criticism pertaining to competitiveness of Ontario’s industries The main criticism of the program is under the premise that a carbon-priced Ontario cannot compete with the US industries across the borders, especially with the USA not putting a price on GHG emissions35 . Twenty chambers of commerce around the province, strongly led by those in Ajax-Pickering, Burlington, Hamilton and New Market, have been protesting to delay the program36 . They are complaining about Ontario losing jobs and investing in neighboring areas. This is even more valid with the Trump presidency not supporting climate change and reduction of GHG emissions. Production and fuel costs will be lower in the US states. This will cause investments in the manufacturing sector to be made in the USA rather than across the border in Ontario. Sectors like the automobile manufacturing business, which are well established on both sides of the border may see slow scaling down of production in Ontario as production costs go up due to the cap and trade program. The auto sector faces additional issues with President Trump rolling back in auto emission standards37 . Increased cost of power will affect all businesses across Ontario. The auditor general has said that the program will cost Ontario businesses and consumers an additional $ 8 billion by 202038 . The government’s defense to this criticism does not address the concerns. The environment minister has issued statements saying that the program has been endorsed by third party economic experts to be ‘most cost effective and best’ at reducing GHG emissions39 . The government could address concerns by issuing permits to industries needed to be 31 (climate-change-deal-premiers-prime-minister, 2016) 32 (ontarios-cap-and-trade-regime-off-to-a-shaky-start, 2016) 33 (wynnes-carbon-price-doesnt-add-up, 2016) 34 (ontarios-cap-and-trade-regime-off-to-a-shaky-start, 2016) 35 (ontario-disaster-architects, 2016) 36 (The Star, 2016) 37 (National Observer, 2017) 38 (The Star, 2016) 39 (The Star, 2016)
  • 13. 11 protected. However, there has been no action in this regard. The government has only assured that natural gas prices will remain the same as permits will be issued to those companies. 8. Details of Ontario’s Cap & Trade Program 8.1 Relevant Regulations and Acts The Climate Change Mitigation and Low-carbon Economy Act was passed on 18th May 201640 . It sets out the framework for the cap and trade program including requirements for quantifying, calculating, reporting and verifying greenhouse gas emissions, and submitting allowances and credits to match greenhouse gas emissions. It also provides the rules for creating and distributing allowances and credits through free allowances, auctions and sales, establishing an offset program. The Ontario Regulation 144/1641 - The Cap and Trade Program and its incorporated Methodology for the Distribution of Ontario Emission Allowances Free of Charge were set on 19th May 2016. They set out the details of the cap and trade program including caps, compliance periods, rules related to registration and participation, details regarding who is a mandatory participant and who can participate as a voluntary or market participant, as well as information on allocating emission allowances. The Ontario Regulation 143/1642 - Quantification, Reporting, and Verification of Greenhouse Gas Emissions Regulation and its incorporated Guideline for Quantification, Reporting and Verification of Greenhouse Gas were set on 19th May 2016. They set out more details regarding quantifying, calculating, reporting and verifying greenhouse gas emissions. On June 8, 2016, the provincial government released Ontario’s Five Year Climate Change Action Plan 2016 – 202043 , which will be funded by the cap and trade program. The Act allows for agreements to link Ontario’s cap and trade program with programs in other jurisdictions as part of a broader international effort to reduce emissions44 . In 2008, Ontario joined with other jurisdictions, including Québec and California, to create the Western Climate Initiative model cap and trade program. Québec and California already have carbon markets, and Ontario has structured its cap and trade program to ultimately align with these existing markets45 . 8.2 Greenhouse Gases and Reduction targets The Act and Reporting Regulation list the greenhouse gases that are covered by the regulatory regime: carbon dioxide, methane, nitrous oxide, hydrofluorocarbons, perfluorocarbons, Sulphur hexafluoride, nitrogen trifluoride46 . The Act sets the following targets for reducing Ontario’s overall greenhouse gas emissions from 1990 baseline levels: 40 (Climate change mitigation and Low carbon economy Act, 2016, 2016) 41 (Ontario Regulation 144/16 - Cap & Trade Program, 2016) 42 (Ontario Regulation 143/16 - Qualification Reporting & Verification of GHG emissions, 2016) 43 (Ontario's five-year climate change action plan 2016-2020, 2016) 44 (Climate change mitigation and Low carbon economy Act, 2016, 2016) 45 (Ontario Regulation 144/16 - Cap & Trade Program, 2016) 46 (Ontario Regulation 143/16 - Qualification Reporting & Verification of GHG emissions, 2016)
  • 14. 12  15% reduction by the end of 2020  37% reduction by the end of 2030  80% reduction by the end of 2050 To meet the 2020 provincial emission targets, the government will issue allowances each year that fall by an average rate of 4.1% from 2017 to 2020. These targets are aligned with the recommendations made by the Intergovernmental Panel on Climate Change. The regulatory regime allows the government to make these targets more stringent and to establish additional interim targets. 8.3 Businesses affected Businesses involving the following types of production are covered by the cap and trade program: cement; copper and nickel; glass; iron and steel; lead; petrochemical; and pulp and paper; and the following activities: coal storage; electricity generation; general stationary combustion; operation of equipment for a electricity transmission system or a distribution system; operation of equipment related to the transmission, storage and transportation of natural gas; and petroleum refining9 . In addition to being responsible for their own facilities' emissions, electricity importers, natural gas distributors, and petroleum product suppliers will be required to obtain emissions allowances for the greenhouse gas emissions associated with their customers (except for customers already participating in the cap and trade program as mandatory or voluntary participants)8 . The Reporting Regulation sets out the requirements for these emitters. There are different reporting and registration requirements based on emission levels. If a facility produces 25,000 tonnes or more of greenhouse gas emissions (carbon dioxide equivalent or CO2e) per year, the owner or operator of the facility is subject to reporting requirements including emission verification requirements and must register as a mandatory participant in the cap and trade program. If a facility produces between 10,000 and 25,000 tonnes of CO2e per year, the owner or operator of the facility is subject to reporting requirements and may register as a voluntary participant in the cap and trade program. If a facility produces less than 10,000 tonnes of CO2e per year, there are no reporting obligations, but the owner or operator of the facility may apply to register as a market participant in the cap and trade program. 8.4 Registration and Reporting The cap and trade program will take effect on January 1st , 2017 with the first 4-year compliance period ending Dec. 31, 2020.14 Subsequent compliance periods will last three years. Reporting obligations will continue under the current Greenhouse Gas Emissions Reporting Regulation (Ontario Regulation 452/09 under the Environmental Protection Act) until all reporting is complete. Mandatory participants need to register by November 30th , 2016. The information required for registration is set out in Schedule 1 of the Cap and Trade Regulation. For Voluntary and Market Participants that are not required to register under the Act, the Cap and Trade Regulation contains provisions. Voluntary participants may register in 2016 if they meet the criteria set out in section 29 of the Cap and Trade Regulation. There are also opportunities to
  • 15. 13 register as a voluntary participant in 2017 or after 2017. Those who register as voluntary participants will be subject to the same requirements as mandatory participants, including the requirements to verify reported emissions. A person who is not a mandatory or voluntary participant may apply to register as a market participant. 8.5 Emission Allowances Under the Cap and Trade Regulation, the Minister is required to create a set number of emission allowances that decreases each year47 . One allowance is equal to one tonne of greenhouse gas equivalent (CO2e). Regulated emitters will only be able to emit the amount of greenhouse gases permitted by their allowances. Initially, a certain number of free allowances will be available for distribution to eligible participants. The Cap and Trade Regulation and incorporated Methodology set out the application eligibility requirements for free allowances. Eligible participants can apply for free allowances in order to cover their emissions and the number allocated to them will be calculated based on the Methodology. Eligible facilities that apply for free allowances are those engaged in the production of specified GHG activities in the Reporting Regulation. 8.6 Auctions and Sales As the total number of allowances in Ontario decreases each year and free allowances are phased out, emitters will have to reduce their emissions or purchase allowances in the carbon market. Only registered participants, be they mandatory, voluntary or market, will be able to purchase, sell or trade emission allowances and credits. The first auction for emission allowances is expected to take place in March 2017. Each year there will be four auctions with a single round of bidding. The Minister may also offer distribution of allowances for sale starting in 2017. A maximum of four sales is allowed per year. Potential fines for non-compliance range from a minimum of $5,000 for individuals and $25,000 for corporations to as high as $6 million for individuals and $10 million for corporations. 8.7 Proceeds from the Cap and Trade Program The Act establishes a Greenhouse Gas Reduction Account for the proceeds from the cap and trade program48 . Schedule 1 of the Act sets out a list of climate change initiatives that could be funded from the account including public transit, clean-tech innovation for industry, electric vehicle incentives and housing retrofits. However, the Act requires the Minister to prepare a more specific Climate Change Action Plan that may be funded by the Greenhouse Gas Reduction Account. The provincial government may revise the plan and must review it every five years. On June 8, 2016, the Ontario government released its first Climate Change Action Plan. The plan addresses the leading sources of greenhouse gas emissions in Ontario, including transportation, industry, and energy inefficiency in buildings and homes. The government also plans to address climate change through better land use planning, and by supporting the research and development of low-carbon technologies. Among other plans to reduce emissions, the government intends to create incentives for the purchase of electric vehicles, increase the availability and use of lower- 47 (Ontario Regulation 144/16 - Cap & Trade Program, 2016) 48 (Climate change mitigation and Low carbon economy Act, 2016, 2016)
  • 16. 14 carbon fuel, improve public transportation, and provide incentives for apartment building energy retrofits. Key areas of the action plan include49 :- a. Establishing a green bank to increase access to financing for energy efficient technologies b. Electrifying the transportation system by increasing the availability of zero-emission vehicles, cleaner trucks and making transit accessible c. Reducing emissions from buildings by providing better information to make more informed decisions on energy use and making new buildings more energy efficient over time d. Making Ontario one of the easiest and most affordable jurisdictions to install or retrofit clean energy systems including solar, battery storage, advanced insulation, and heat pumps, while protecting low-income and vulnerable communities e. Supporting a carbon market that achieves reductions at the lowest cost, driven by businesses and industry making investments to reduce greenhouse gas emissions f. Working with First Nations and Metis communities to address climate change and build capacity with actions guided by Traditional Ecological Knowledge g. Building on progress by making government operations carbon neutral that include government facilities, operations, and procurement h. Ensuring natural, agricultural and forest lands are used efficiently and sustainably to enhance the removal and storage of carbon, and enhancing the capture to CO2e from waste With anticipated annual cap and trade proceeds of $1.8-1.9 billion annually adding to $8.3 billion by 2020, the funds are expected to fund 28 climate mitigation actions to achieve 9.8 million tonnes of GHG emission reductions by 2020. 9. Effectiveness of Cap & Trade program implementation 9.1 Scope of Cap & Trade program The program covers seven GHG emissions including Carbon dioxide, Methane, and Nitrous oxide which make for the 82% of the emissions, which is in line with California and Quebec50 . There are sufficient annual declines to meet the 2020 targets. During the first compliance period, 82% of the province’s emissions will be regulated under the cap that declines annually at an average rate of 4.1% to achieve a 15% emissions reduction target by 2020. 49 (Ontario's five-year climate change action plan 2016-2020, 2016) 50 (But, 2016)
  • 17. 15 Fig 9.1 Emission reduction targets51 The program has a hybrid regulation of upstream and downstream. There is upstream regulation for fuel distributors, natural gas, and electricity, which cover 54% of Ontario's forecast emissions by 202052 . Upstream regulation of fuel distribution is expected to enhance the program's administrative feasibility and implementation. The downstream approach covers 34% of the forecast emissions from industrial activity by 2020. The smaller sources like agricultural, waste emissions, aviation, and marine fuels are excluded to make it administratively simpler and cheaper53 . 9.2 Distribution of benefits and costs Based on the distribution of allowances, there could be greater gains accruing to the industry than to consumers in the first compliance period54 . This is initially owing to the cost of free allowances and the allowances for the fuel distributors paid by consumers. This could be a potential gain of about $4.7 billion received from the distribution of allowances and the portion of cap and trade proceeds accruing to industry. But, although it is not known with certainty when free allowances will cease, transitional assistance is planned to be phased out. Also, from the climate change action plan, it is expected that the cap and trade proceeds will be re-invested in activities that significantly reduce the energy costs for households and contribute to greater societal benefits that persist after 2020. From the action plan, it is estimated that 80% of the benefits from cap and trade proceeds will accrue to consumers. 9.3 Effectiveness of Market Design Ontario’s market design is same as that of Quebec and California to enable linkage opportunities in the future. This use of existing infrastructure will reduce implementation and transaction costs, but, restrict flexibility to change market design. The market rules will enforce cost containment measures including a price floor ($18 per tonne), price ceiling and strategic reserve to ensure that the market does not fail. Ontario’s program meets the criteria of being transparent by disclosing participant information and access to accounts. But, whether the carbon price is effective in achieving significant emission reductions is to be seen. Policies towards renewables may lower demand for fossil fuels causing low demand for allowances and drive carbon prices down. Balancing the pace of change by allowing carbon reductions to be driven by the marketplace, rather 51 (MOECC, 2014) 52 (But, 2016) 53 (But, 2016) 54 (But, 2016)
  • 18. 16 than by instituting higher carbon prices to push behavioral changes in the society, is important. Ontario’s cap and trade market is expected to use the CITSS55 (Compliance Instrument Tracking System Service, used by WCI) to save infrastructure costs once linking occurs. Due to the checks in the bid and auction processes that enforce the purchase and holding rules, higher monitoring and oversight costs could be expected56 . 9.4 Transparency The cost of free allowances represents a total of $3.27 billion by the end the first compliance period. The basis for allocations will be supported by verified emissions prepared in accordance with the requirements of the Reporting Regulation. It is appropriate to provide for transitory assistance to mitigate uneconomic investments to reduce process and combustion emissions (as was done in California). The use of auction and transitional assistance also attains the highest net GHG reductions at the lowest cost. The extent of transitional assistance provided is expected to help the industries that need it the most. In terms of flexibility arrangements, there will be exemptions primarily for large increases in production for large emitters and a more moderate decline of free allowances for facilities using biofuels. Transitory assistance appears to be provided to help large emitters prepare for significant actions after 2020. With free allowances and flexibility arrangements that relax certain program rules, it will be important to ensure accurate reporting of the emissions produced. 9.5 Measurement and verification A robust measurement, reporting and verification process is in place in Ontario to enable effective linking with Quebec and California. The requirement to report greater detail on biomass types in Ontario appears to be necessary, as the use of biomass can affect the amount of free allowances provided to the industry57 . To ensure sustainable reductions, in the long run, it requires successful enforcement of action plan initiatives, monitoring of the initiatives funded by cap and trade proceeds, and consideration of complementary metrics to evaluate prospective climate change action plan initiatives. 9.6 Integration with other measures Ontario’s climate policy will integrate well with broader provincial and federal government objectives. In terms of political considerations, there will be major energy use changes from switching fossil fuels to renewable energy and electricity. In addition, there are planned changes to municipal land-use planning and environmental assessment, consumer protection measures for low-income consumers affected by carbon prices, and the need for community empowerment58 . Besides the challenge that many of these policies are at a formative stage, the changes are complex and require time to implement and enforce. 55 (Ontario Govt, 2012) 56 (But, 2016) 57 (But, 2016) 58 (Ontario's five-year climate change action plan 2016-2020, 2016)
  • 19. 17 In terms of economic policy considerations, there are major economic opportunities from increasing the deployment of low-carbon technologies. Clean jobs and investment opportunities are expected to come with the implementation of the climate change action plan. Low-interest financing opportunities will be accelerated with the Green Bank, provided that its implementation is successful in accelerating low-carbon technological growth. In terms of environmental policy considerations, the inclusion of climate change in the environmental assessment process has the potential to identify project risks earlier and lower future costs of compliance. With considerable interest in leveraging the natural environment as carbon sinks, it supports continued monitoring of the environment and how it will be used to displace emissions from fossil fuels. 10. Conclusion It can be concluded that the program has a wide scope and sufficient cap declines to meet the targeted reduction of 80% by 2050. Effective distribution of benefits to consumers will depend on the efficacy of the climate change action plan initiatives. The market has been designed with the safeties of price floor, ceiling, and a strategic reserve. While administrative costs have been saved by using the WCI model, sufficient monitoring and oversight costs can be expected. There are sufficient transparency and checks in terms of measurement and verification. The program also integrates well with federal policy, economic and environmental policy considerations. 11. Recommendations  Assess the performance of the program by monitoring the rate of emission decline by industry with cost of reductions. Adjust allowances and flexibility arrangements based on cost of decline and the target reductions.  Monitor action of complementary regulations which reduce GHG emissions and coordinate spending to achieve in-phase action.  Review the implementation of the program, progress of the action plan, and alignment with federal climate policy.
  • 20. 18 References 12-cap-and-trade-pros-and-cons/. (2015, May 14). Retrieved from brandongaille.com: http://brandongaille.com/12-cap-and-trade-pros-and-cons/ Austan Goolsbee, S. L. (2013). Section 16 - Externalities & Public goods. In S. L. Austan Goolsbee, Microeconomics (pp. 643-678). New York: Worth. Boundless Economics. (2017, January). Retrieved from Boundless: https://www.boundless.com/economics/textbooks/boundless-economics-textbook/ But, J. (2016). Evaluation of Ontario's Cap and Trade Regulation. Toronto: FES, York University. cap-and-trade. (2016, October 25). Retrieved from www.canadianenergylaw.com: http://www.canadianenergylaw.com/tags/cap-and-trade/ cap-and-trade-ontario. (2016, September 30). Retrieved from www.ontario.ca: https://www.ontario.ca/page/cap-and-trade-ontario cap-and-trade-pros-and-cons-list. (2015, June 25). Retrieved from occupytheory.org: http://occupytheory.org/cap-and-trade-pros-and-cons-list/ cap-trade-will-raise-natural-gas-bills-across-ontario-oeb. (2016, December 22). Retrieved from 680news.com: http://www.680news.com/2016/12/22/cap-trade-will-raise-natural-gas- bills-across-ontario-oeb/ Change, M. o. (2017). Registry - Ministry of Environment and Climate Change. Retrieved from Ministry of Environment and Climate Change: https://www.ebr.gov.on.ca/ Climate change mitigation and Low carbon economy Act, 2016. (2016, May 18). Retrieved from Ontario.ca: https://www.ontario.ca/laws/statute climate-change-deal-premiers-prime-minister. (2016, December 7). Retrieved from cbc.ca/news/politics: http://www.cbc.ca/news/politics/climate-change-deal-premiers- prime-minister-1.3886426 climate-change-the-pros-and-cons-of-cap-and-trade. (2010, November 15). Retrieved from steverichey.com: http://www.steverichey.com/writing-samples/climate-change/the-pros- and-cons-of-cap-and-trade/ economics/carbon-tax-pros-and-cons. (2013, January 20). Retrieved from www.economicshelp.org: http://www.economicshelp.org/blog/2207/economics/carbon- tax-pros-and-cons/ Environment Economics - Negative Externality. (2008, February). Retrieved from Environment Economics: http://www.env-econ.net/negative-externality.html Environmental Defense Fund - Cap & Trade. (2017, January). Retrieved from Environmental Defense Fund: https://www.edf.org/climate/how-cap-and-trade-works
  • 21. 19 Herriges, J. (2010, September). Principles of Microeconomics - Externalities. Wisconsin - Madison, Iowa, USA. Huffington Post. (2014, May 08). Retrieved from huffingtonpost.ca: http://www.huffingtonpost.ca/candice-malcolm/carbon-tax_b_5651491.html insights-resources/ontario-energy-board-decision-on-cap-trade-costs-why-reasons-for-decision- are-essential-to-demonstrate-regulatory-independence. (2016, August 9). Retrieved from gowlingwlg.com/en/canada: https://gowlingwlg.com/en/canada/insights- resources/ontario-energy-board-decision-on-cap-trade-costs-why-reasons-for-decision- are-essential-to-demonstrate-regulatory-independence Investopedia - Cap & Trade. (2017, January). Retrieved from Investopedia: http://www.investopedia.com/terms/c/cap-and-trade.asp issues/climate-change/science/climate-solutions/carbon-tax-or-cap-and-trade/. (2014). Retrieved from davidsuzuki.org: http://www.davidsuzuki.org/issues/climate- change/science/climate-solutions/carbon-tax-or-cap-and-trade/ Klinsky, S. (2013). Bottom-up policy lessons emerging from the Western Climate Initiative's development challenges. Climate Policy, 143-169. Mankiw, G. N. (1997). Principles of Economics. Stamford, CT: Cengage Learning. MOECC. (2014). Climate Change Update Report. Toronto. National Observer. (2017, March 16). Retrieved from nationalobserver.com: http://www.nationalobserver.com/2017/03/16/news/ontario-plans-team-california- against-trump-climate-change Nelson, J. A. (2003). Microeconomics in Context. New York: M E Sharpe. Ontario Govt. (2012). Retrieved from Ontario - MOECC: https://www.ontario.ca/page/cap-and- trade-register-and-participate-citss Ontario Regulation 143/16 - Quatification Reporting & Verification of GHG emissions. (2016, May 19). Retrieved from Onatrio.ca: https://www.ontario.ca/laws/statute Ontario Regulation 144/16 - Cap & Trade Program. (2016, May 19). Retrieved from Ontario.ca: https://www.ontario.ca/laws/statute ontario-disaster-architects. (2016, December 7). Retrieved from cbc.ca/news/opinion: http://www.cbc.ca/news/opinion/ontario-disaster-architects-1.3884108 Ontario's five year climate change action plan 2016-2020. (2016, June 8). Retrieved from Ontario.ca: https://www.ontario.ca/laws/statute ontarios-cap-and-trade-regime-off-to-a-shaky-start. (2016, March 3). Retrieved from www.thestar.com: https://www.thestar.com/opinion/commentary/2016/03/03/ontarios- cap-and-trade-regime-off-to-a-shaky-start.html
  • 22. 20 pros-cons-politics-of-cap-and-trade-versus-co2-taxes. (2009, May 19). Retrieved from www.yaleclimateconnections.org: http://www.yaleclimateconnections.org/2009/05/pros- cons-politics-of-cap-and-trade-versus-co2-taxes/ publications/cap-trade-vs-taxes. (n.d.). Retrieved from www.c2es.org: http://www.c2es.org/publications/cap-trade-vs-taxes The Star. (2016, October 3). Retrieved from thestar.com: https://www.thestar.com/news/canada/2016/10/03/5-things-to-know-about-canadas- carbon-pricing-plans.html The Star. (2016, December 29). Retrieved from thestar.com: https://www.thestar.com/news/queenspark/2016/12/29/ontario-business-groups-want- cap-and-trade-program-delayed.html the-political-history-of-cap-and-trade. (2009, August). Retrieved from www.smithsonianmag.com: http://www.smithsonianmag.com/air/the-political-history-of- cap-and-trade-34711212/