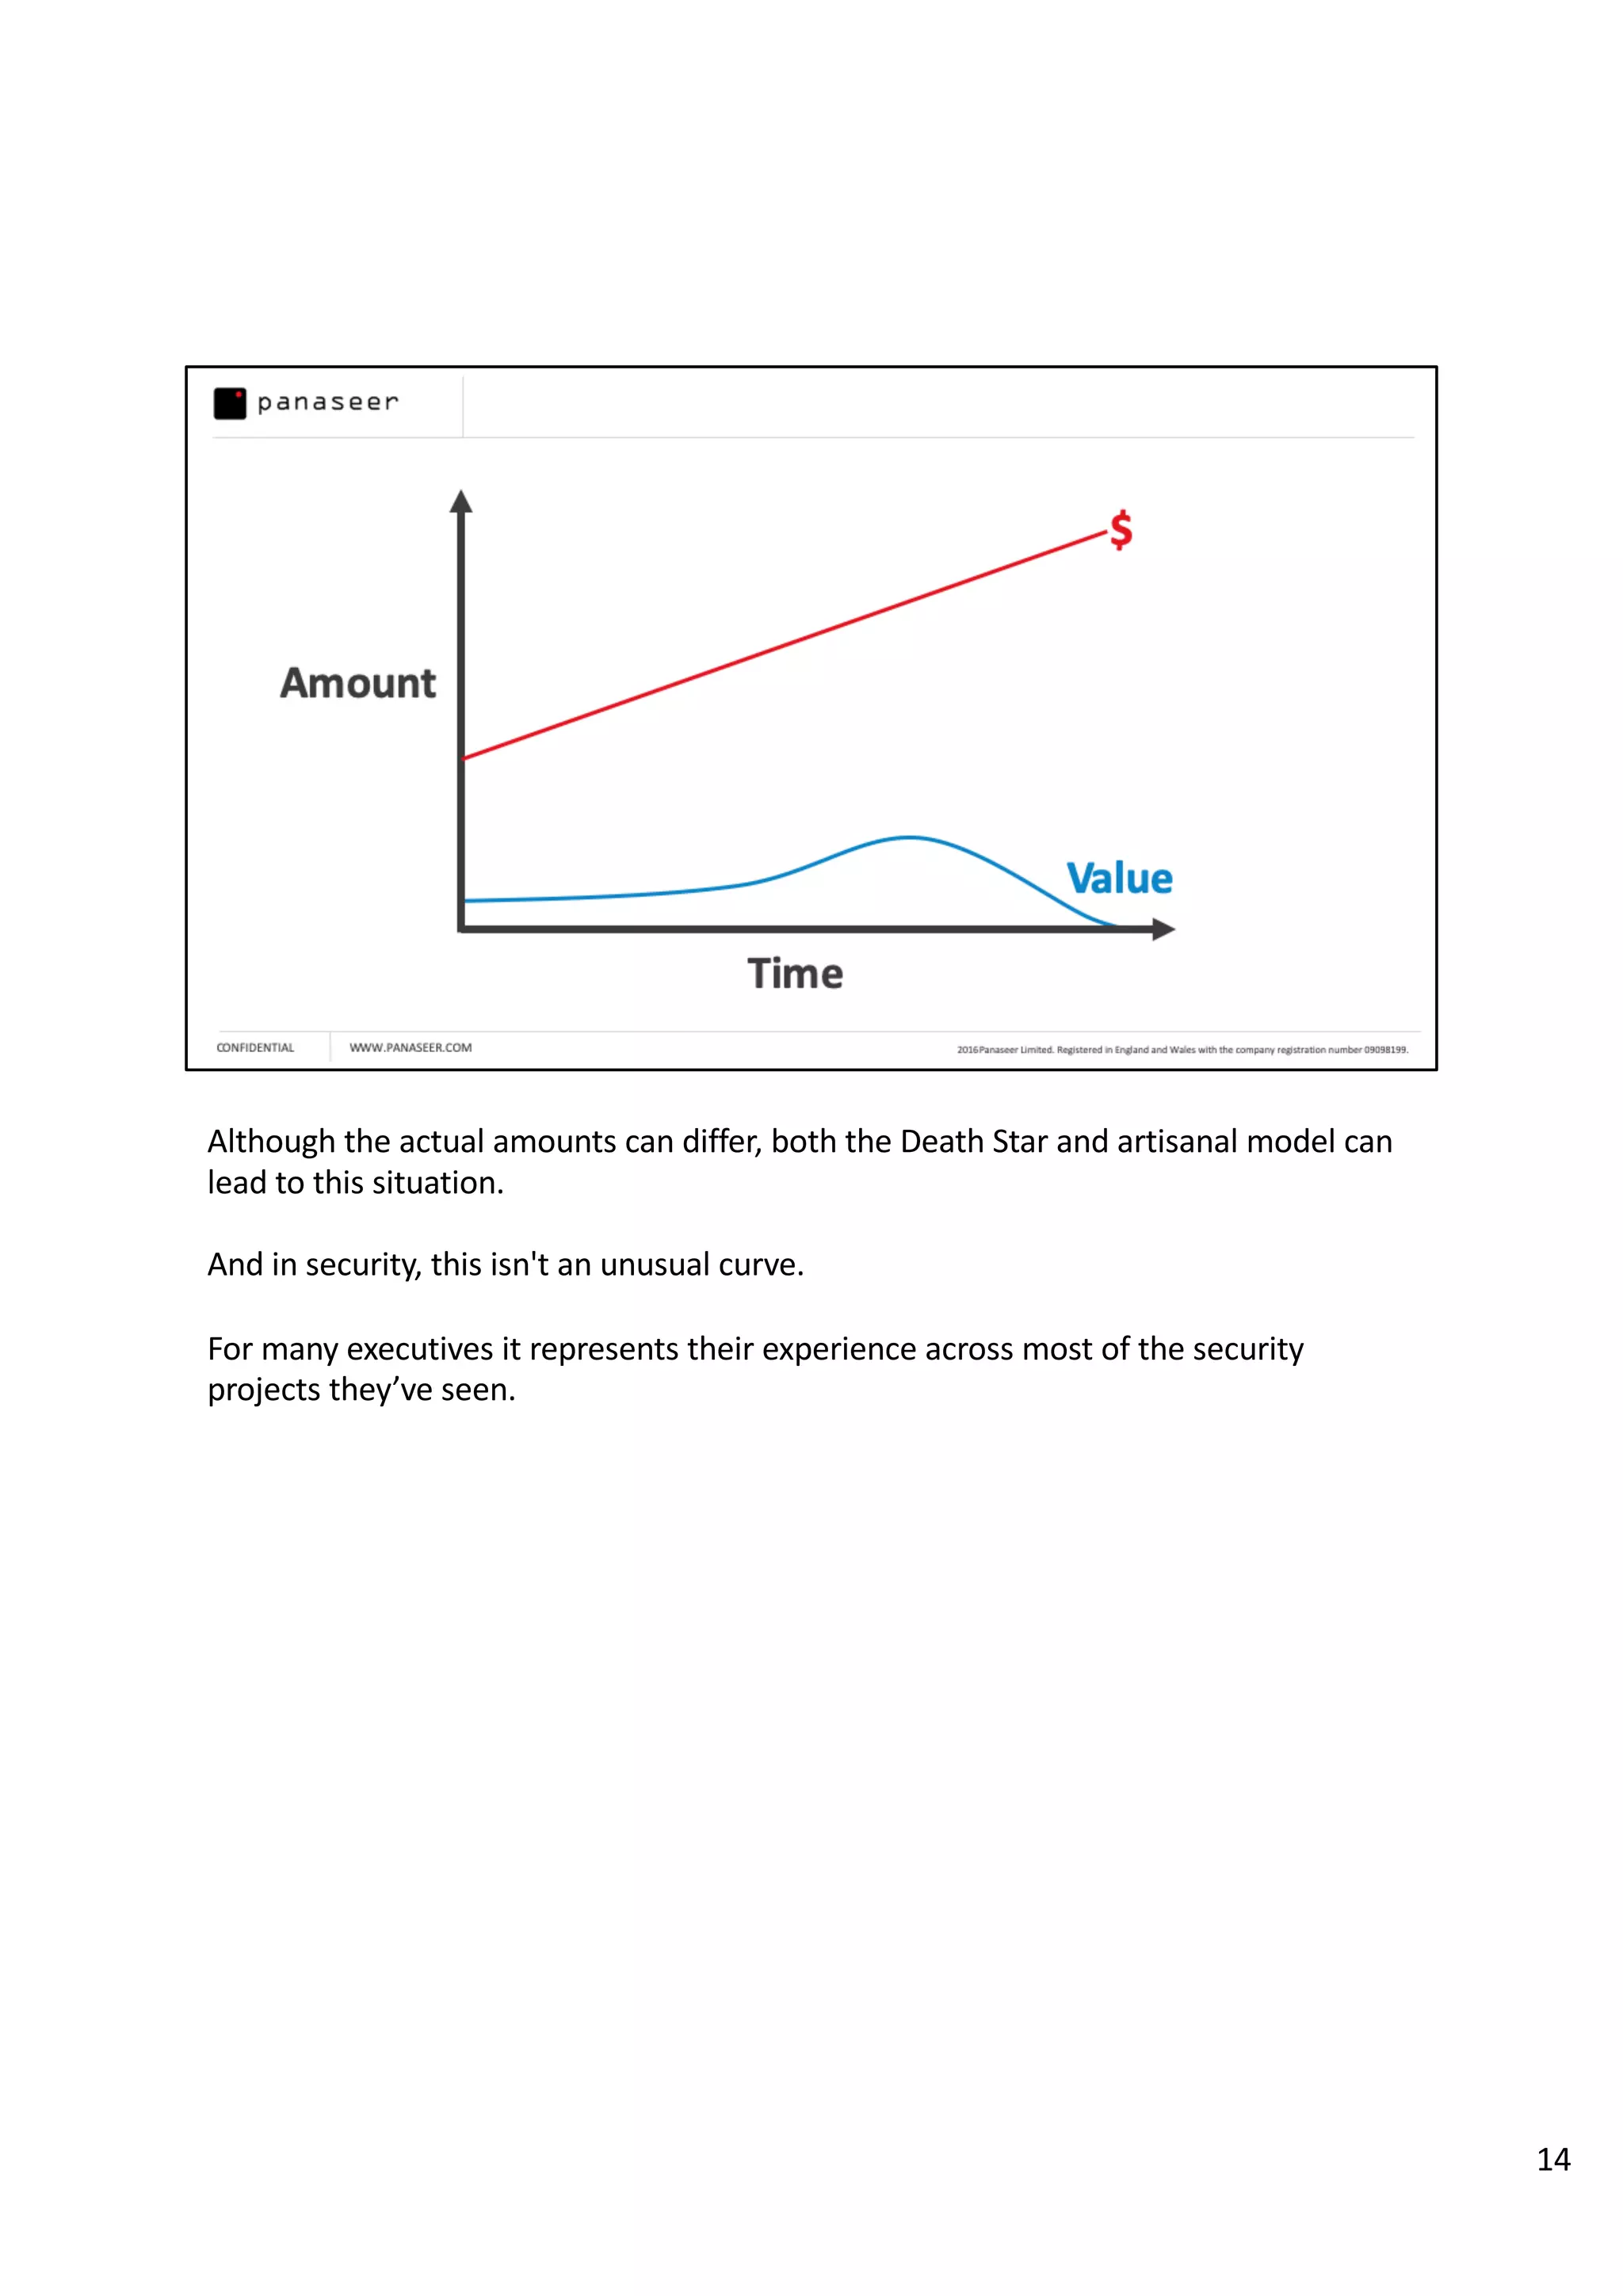
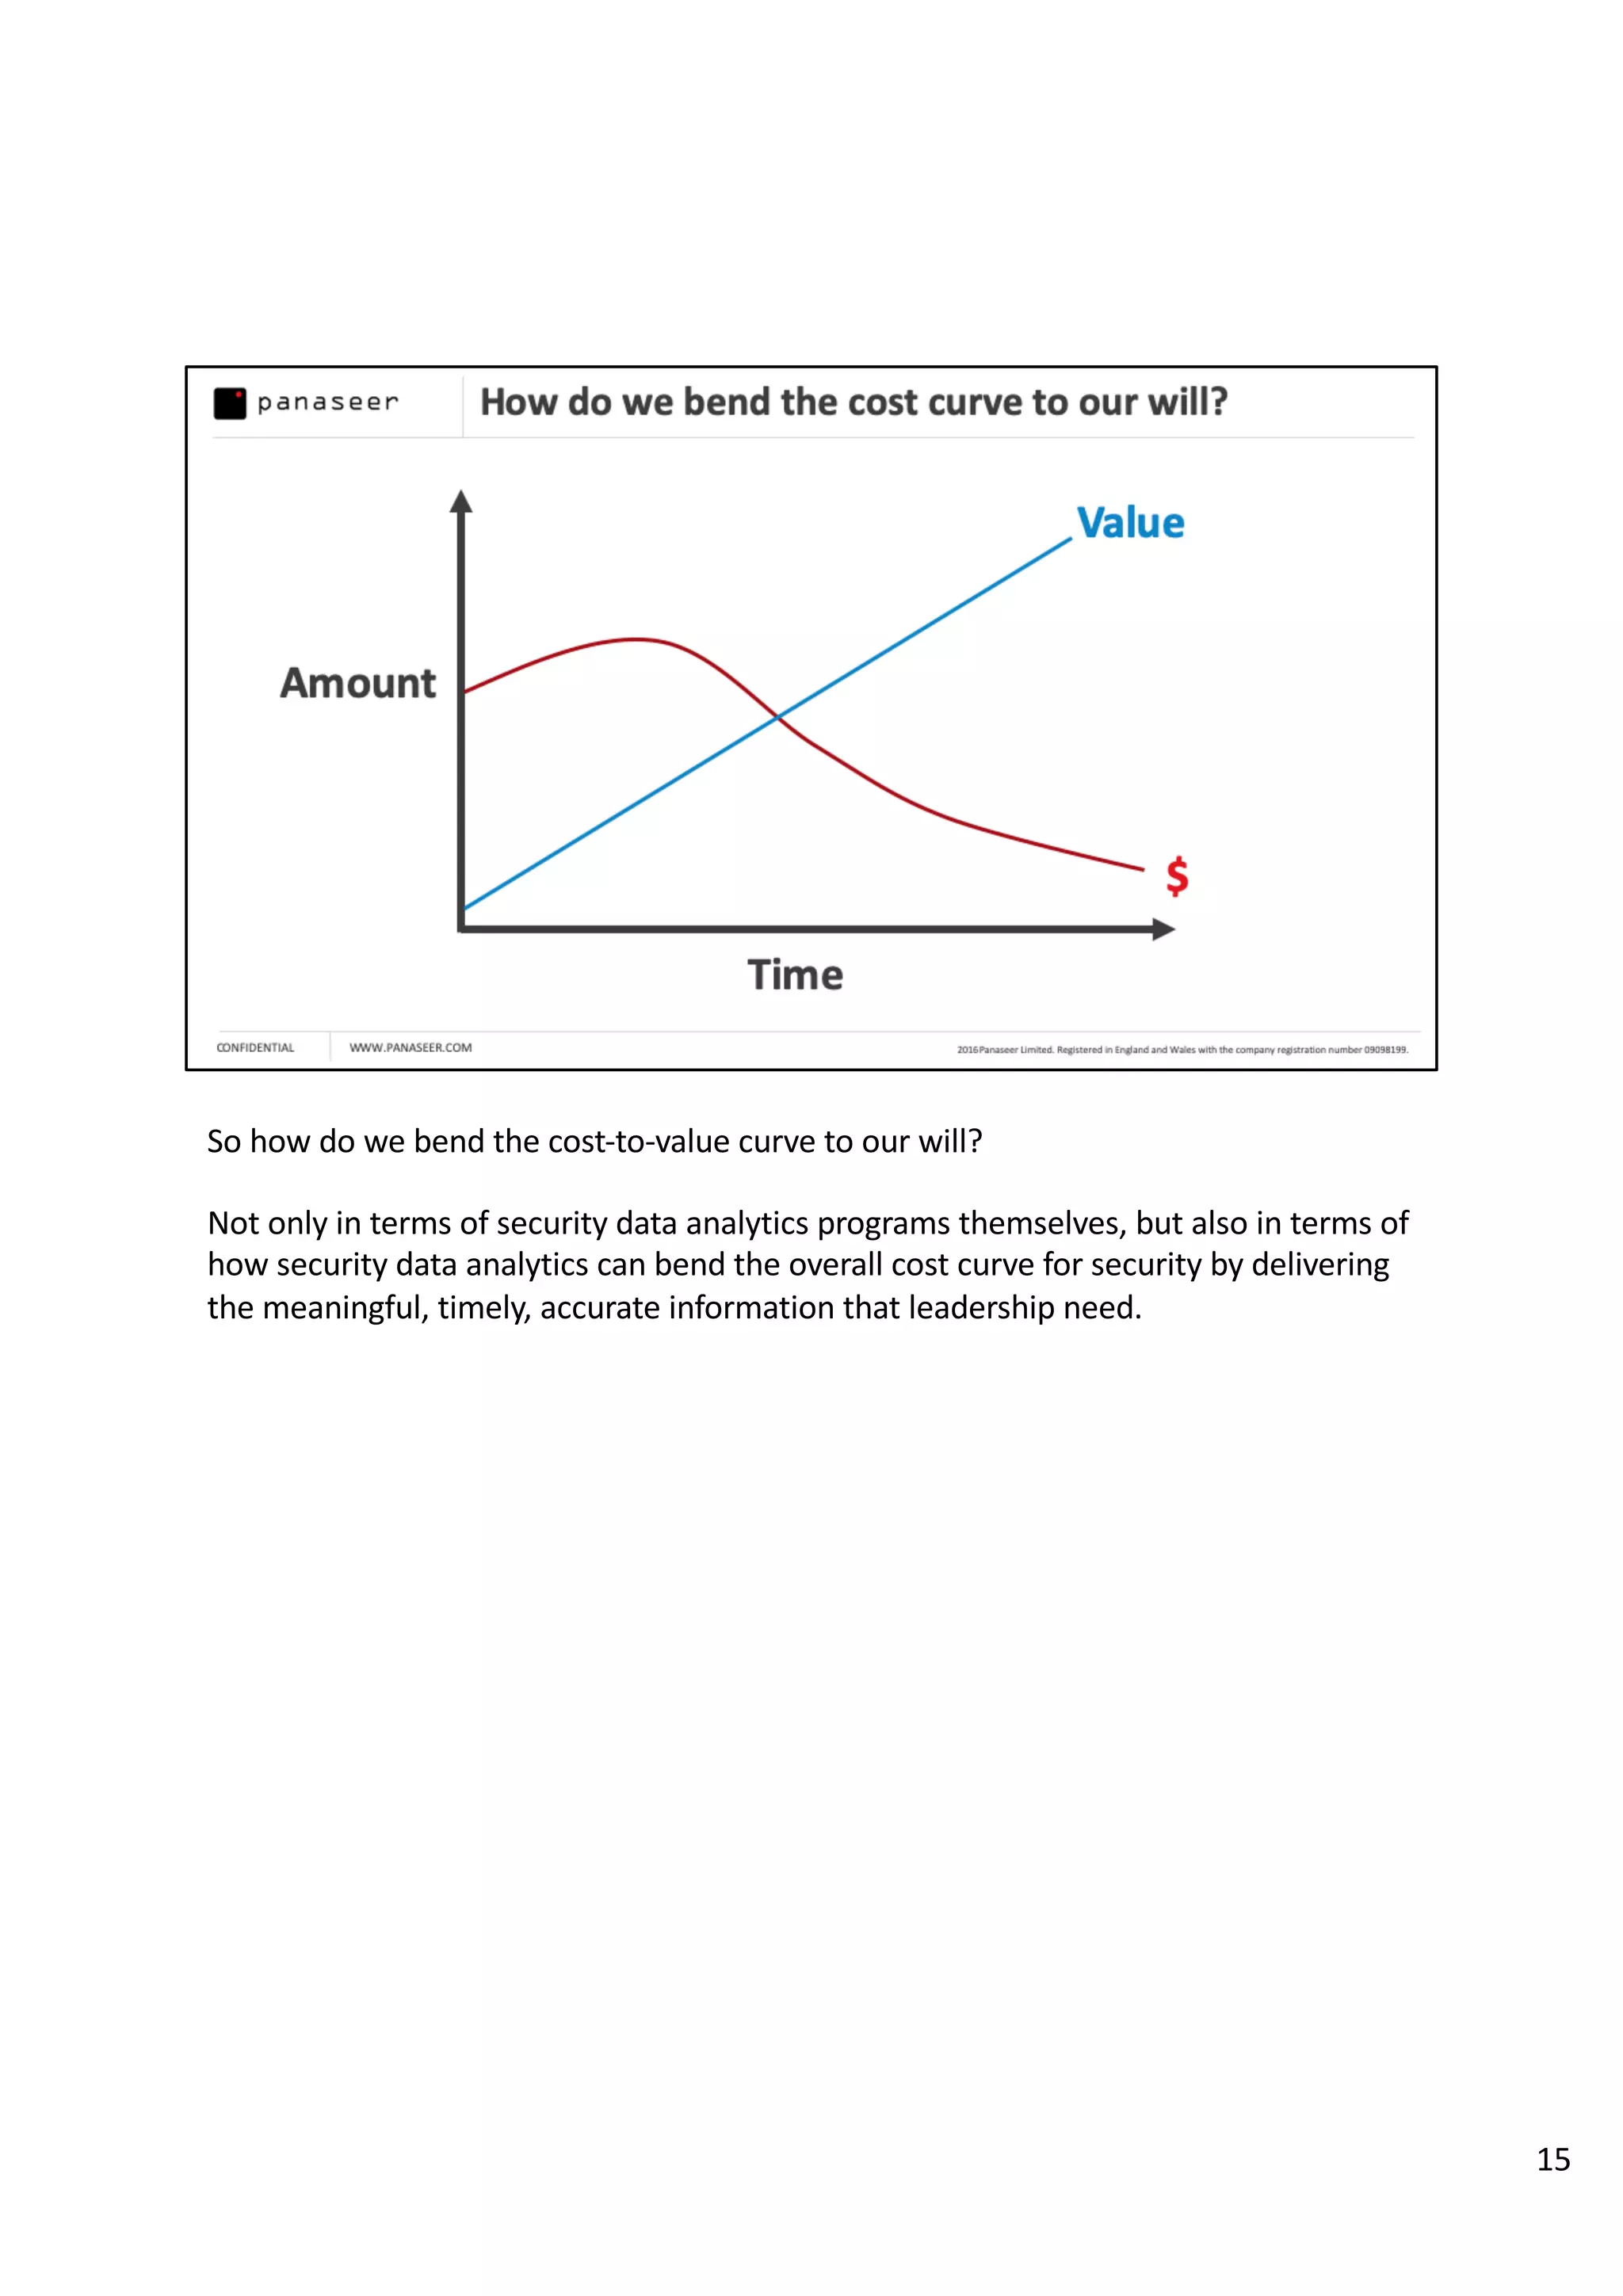
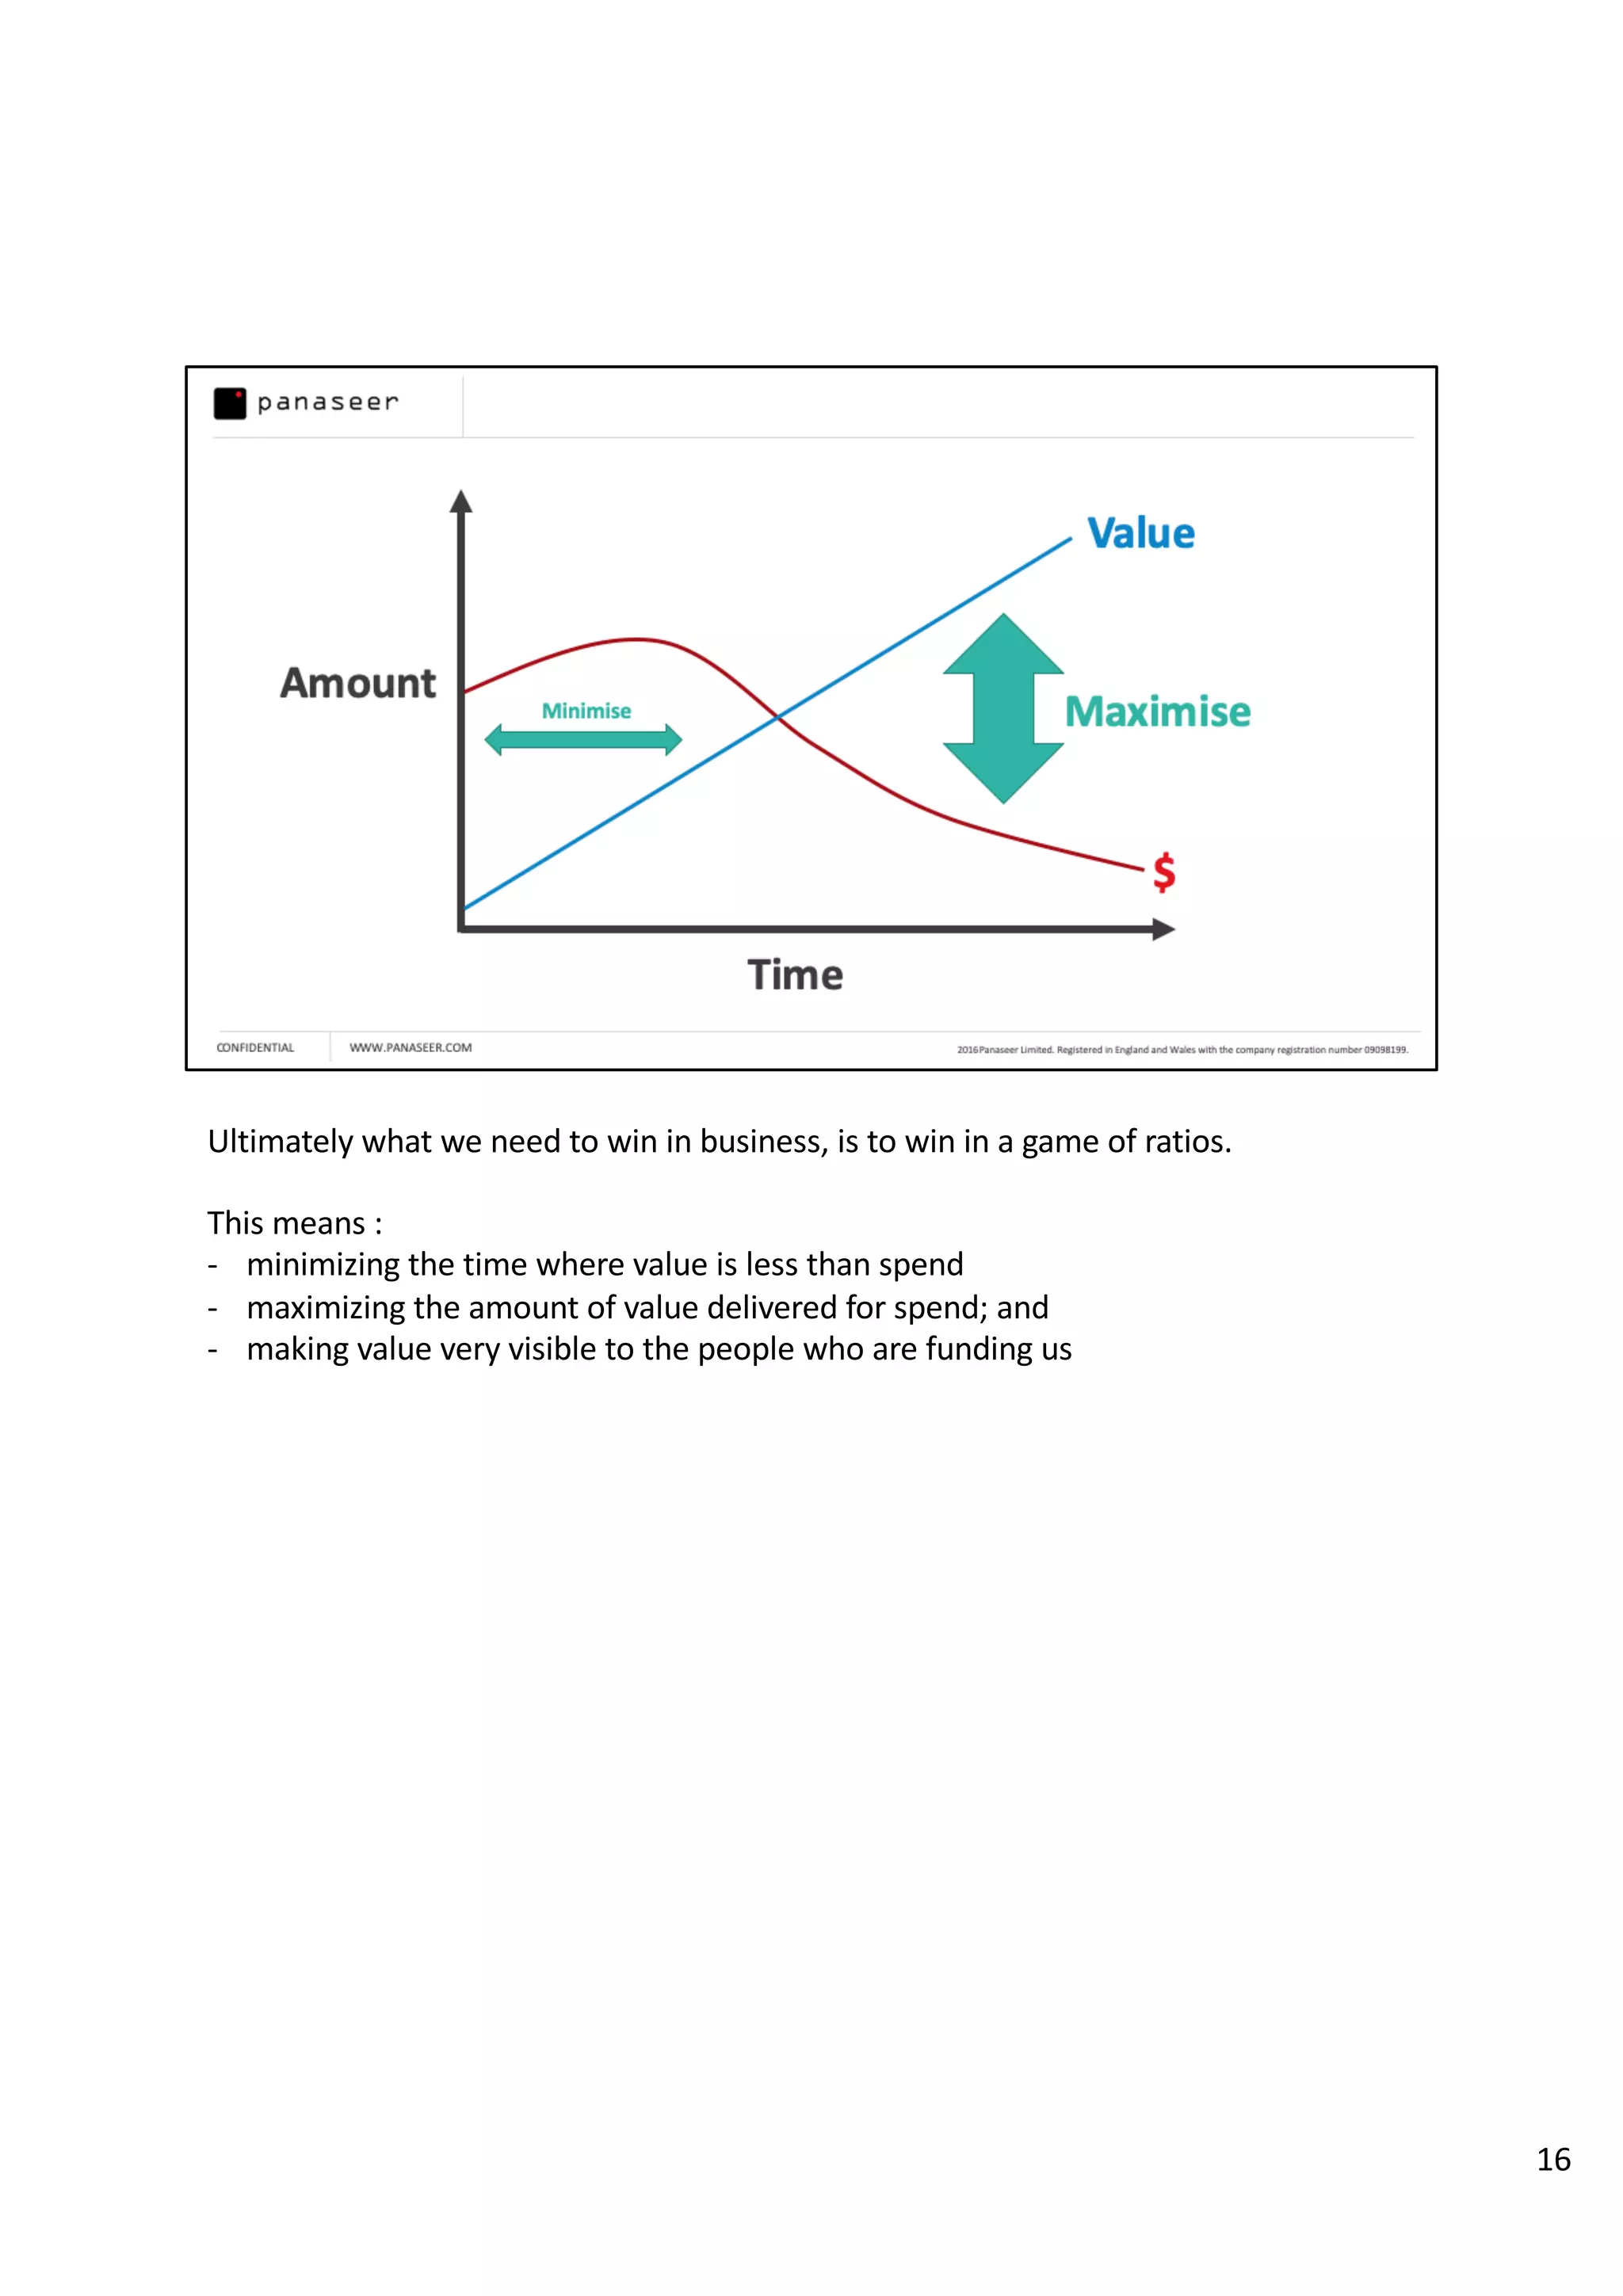
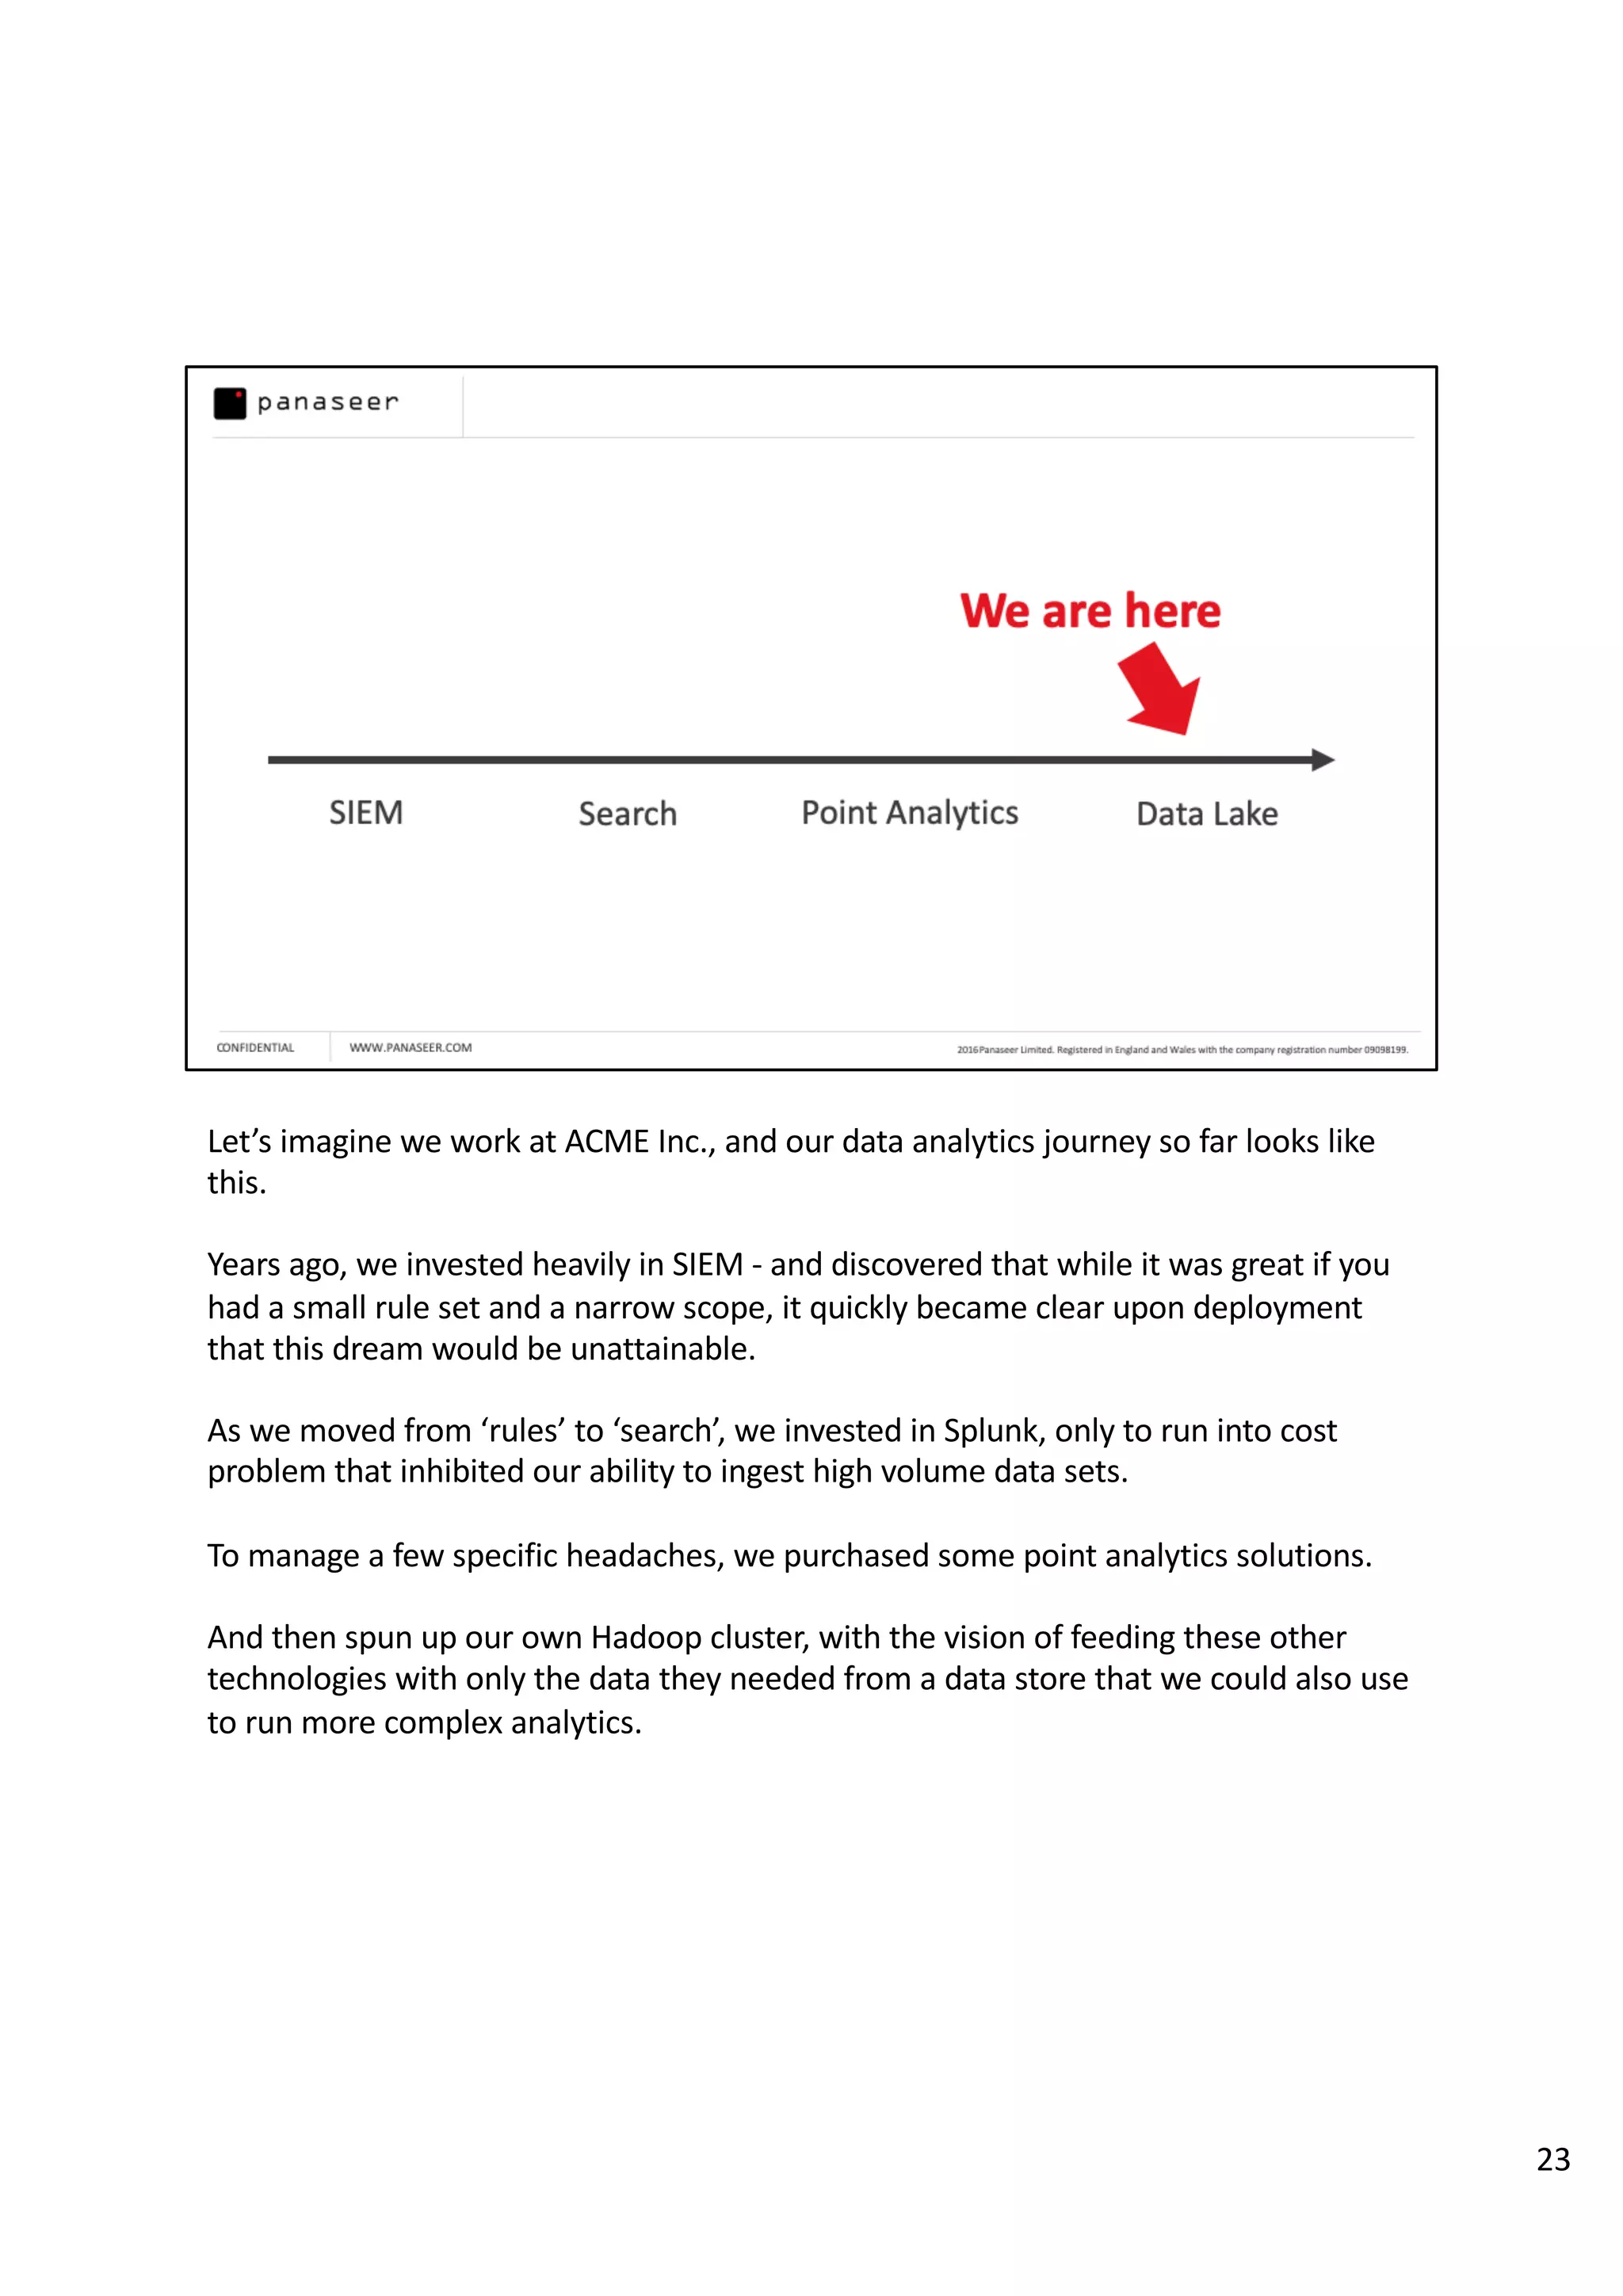
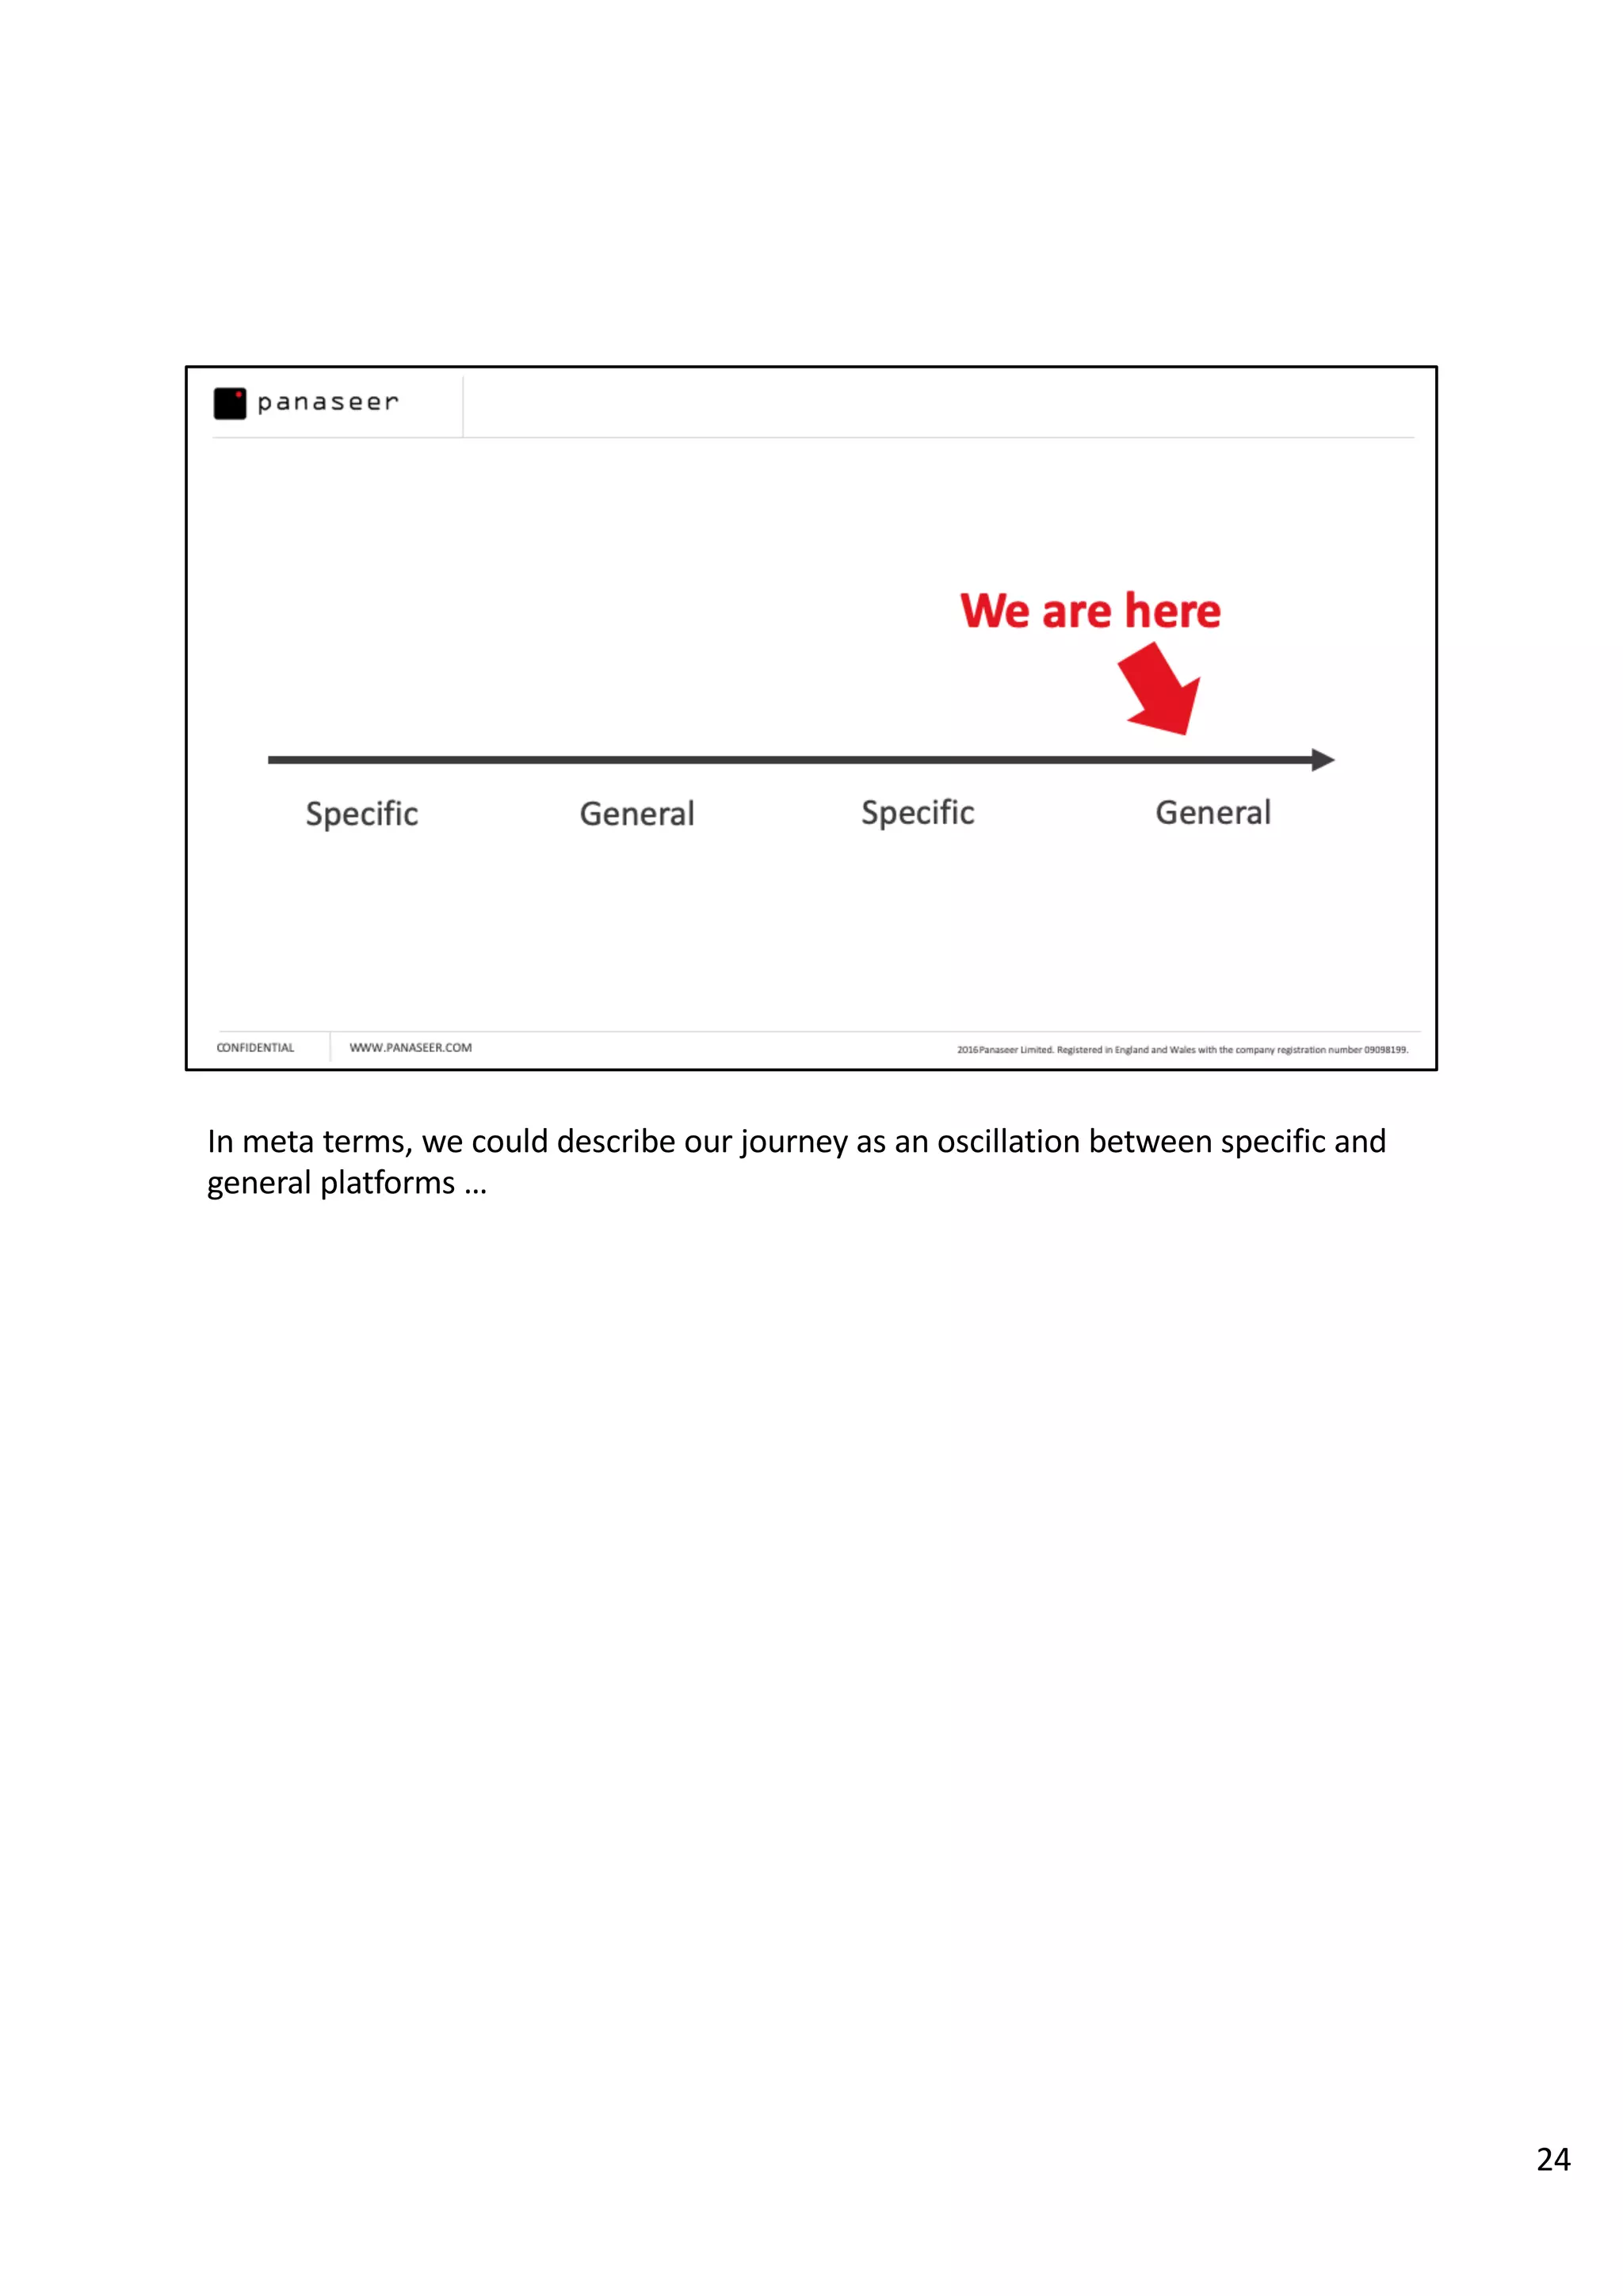
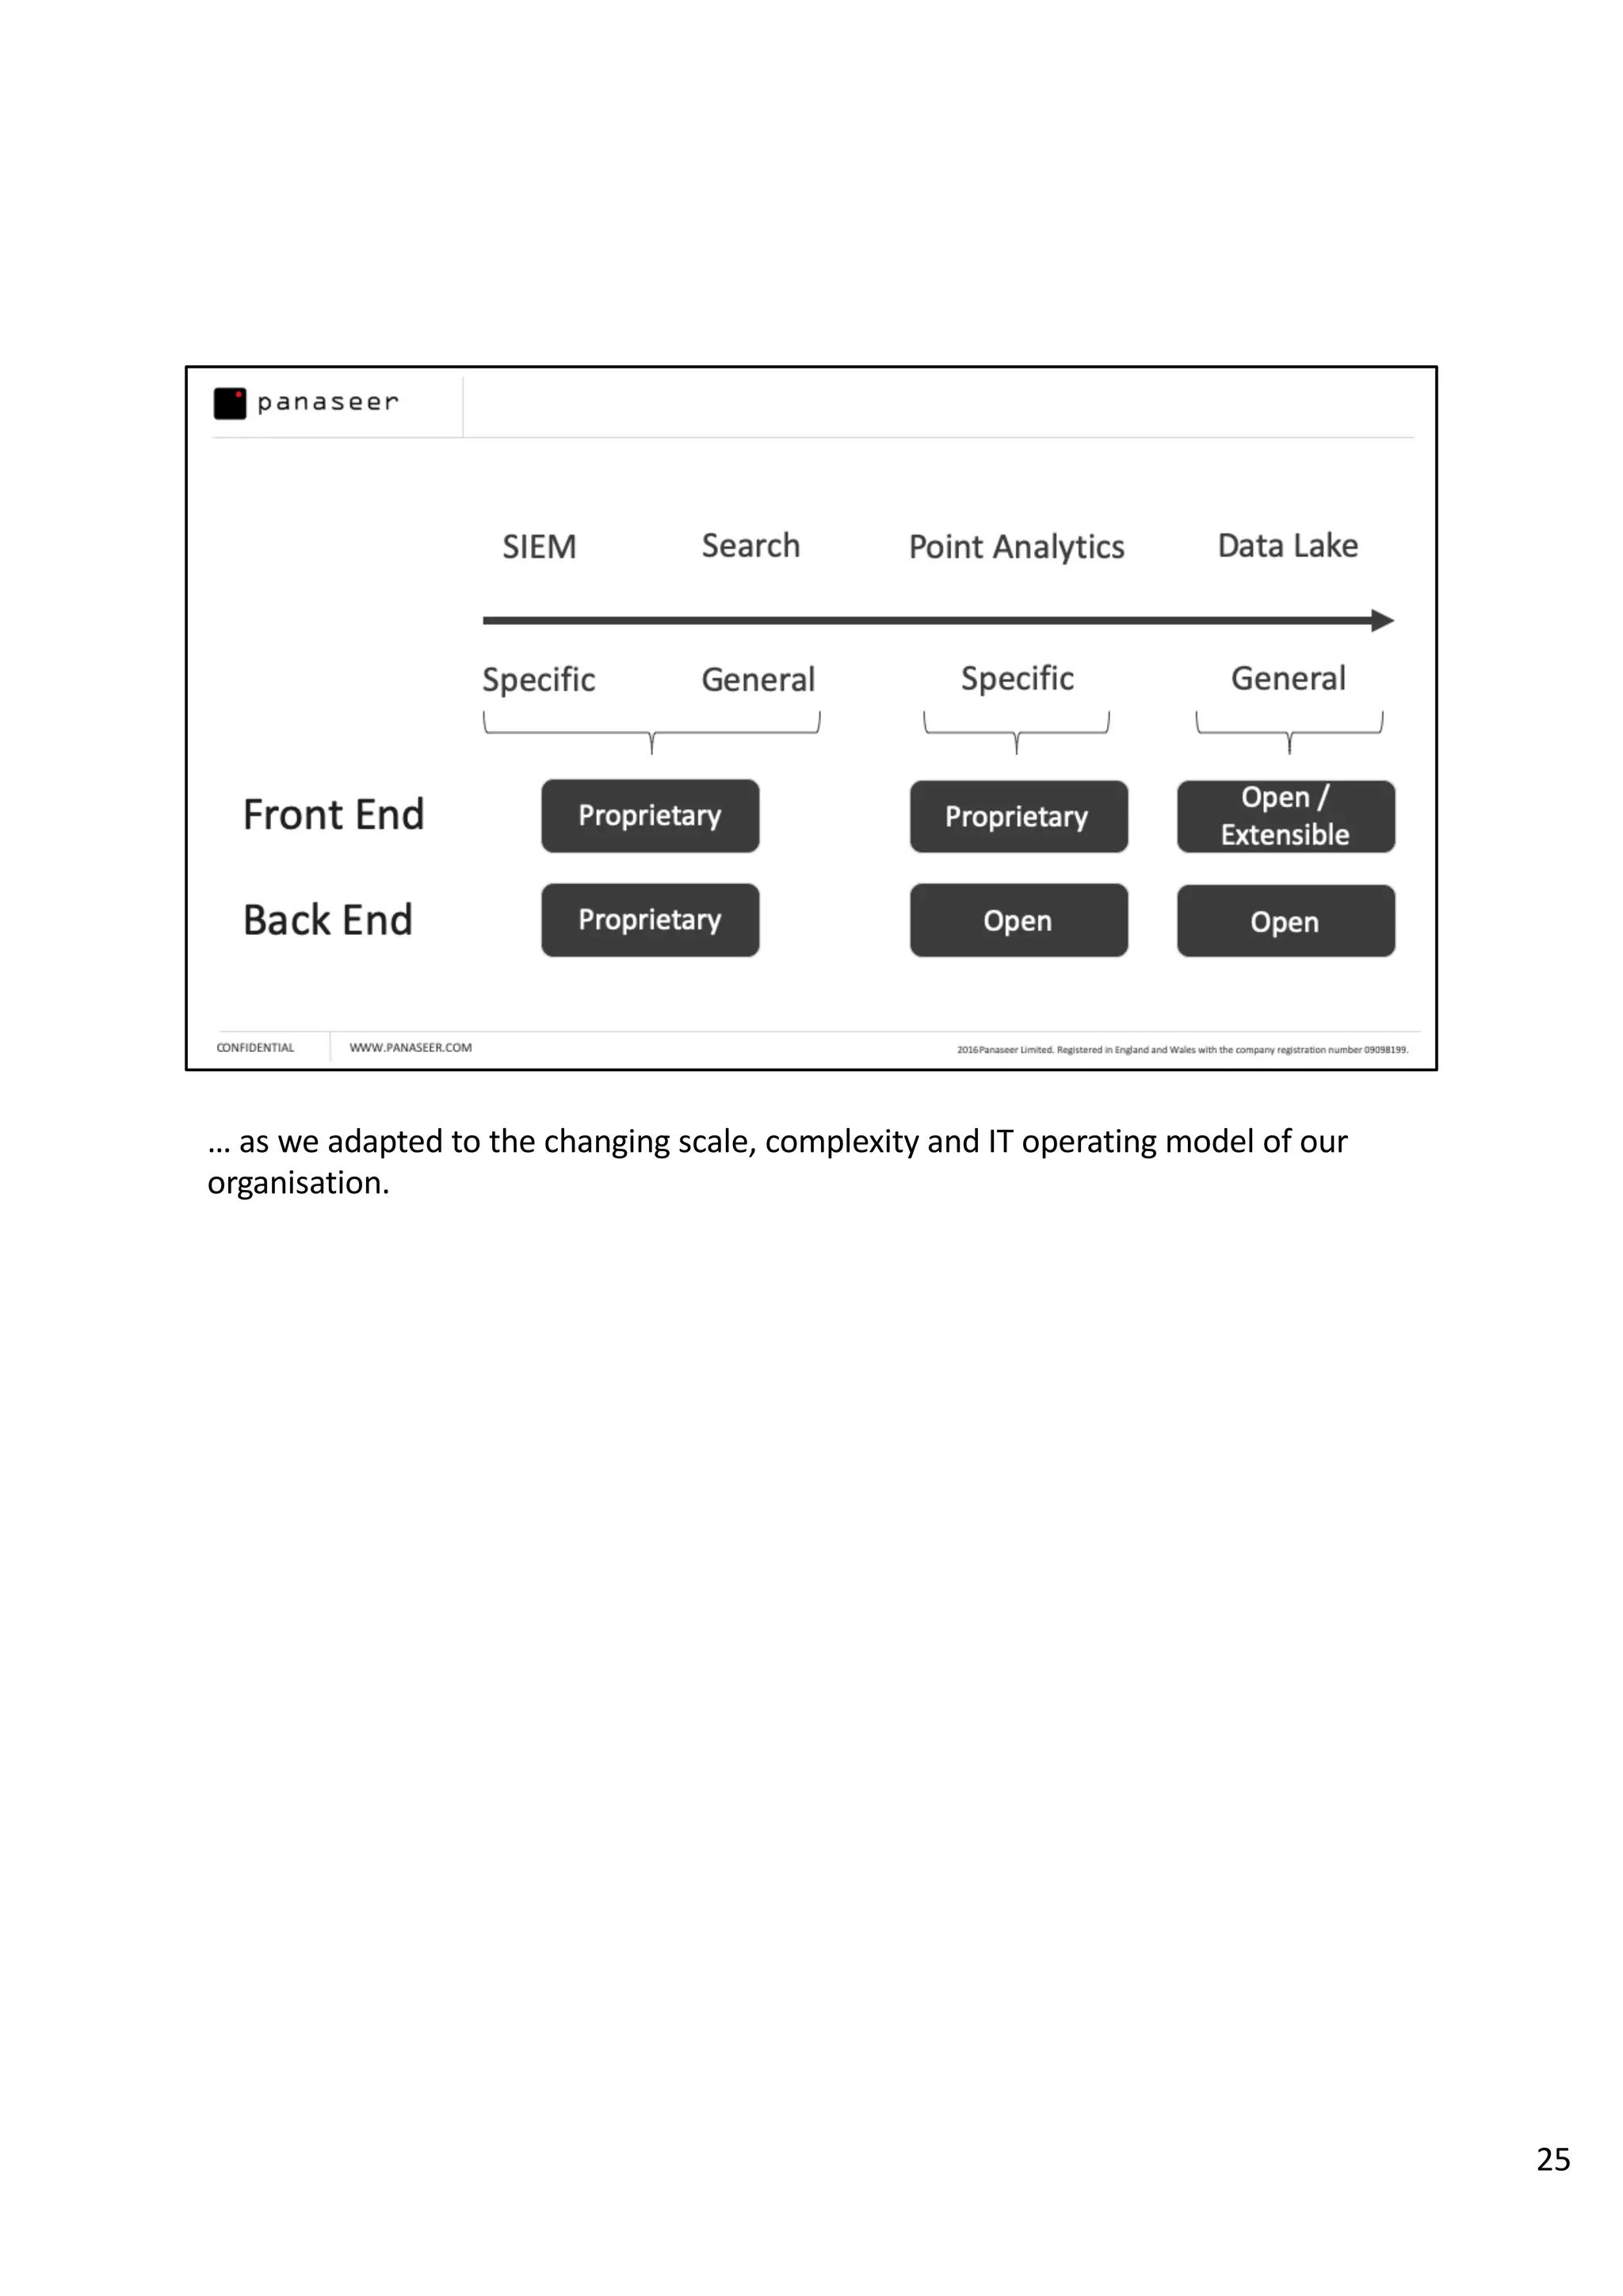
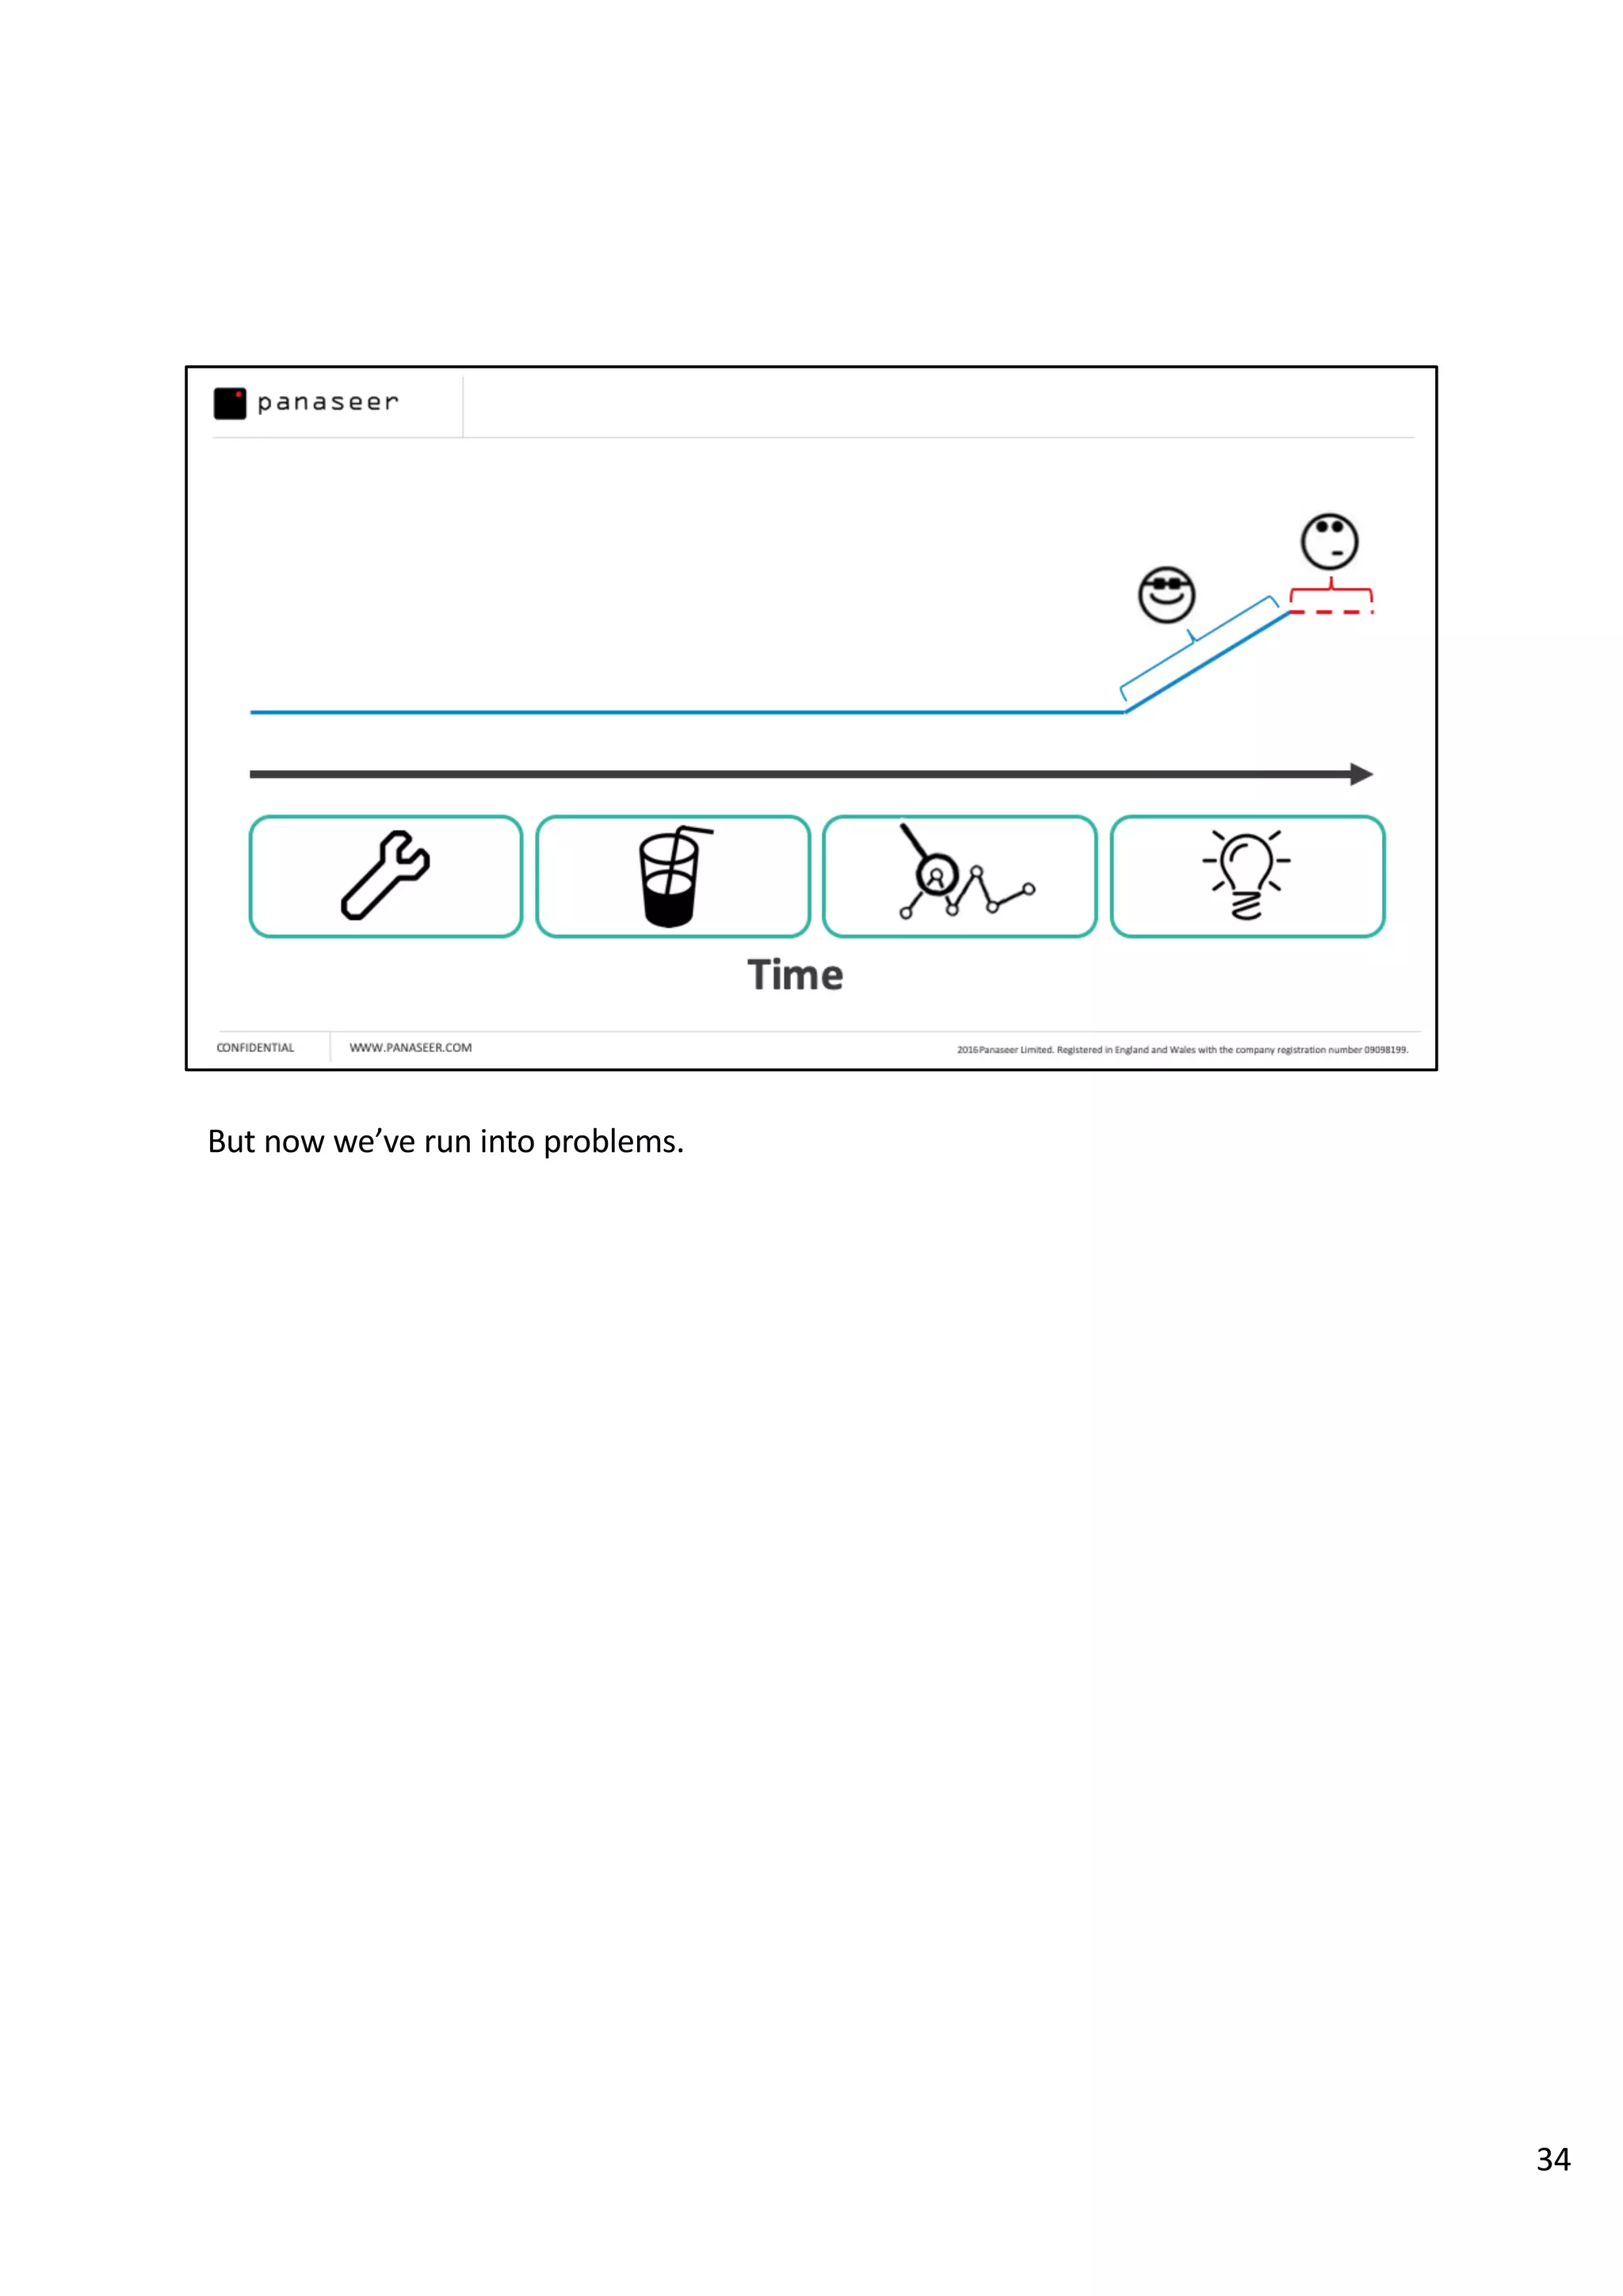
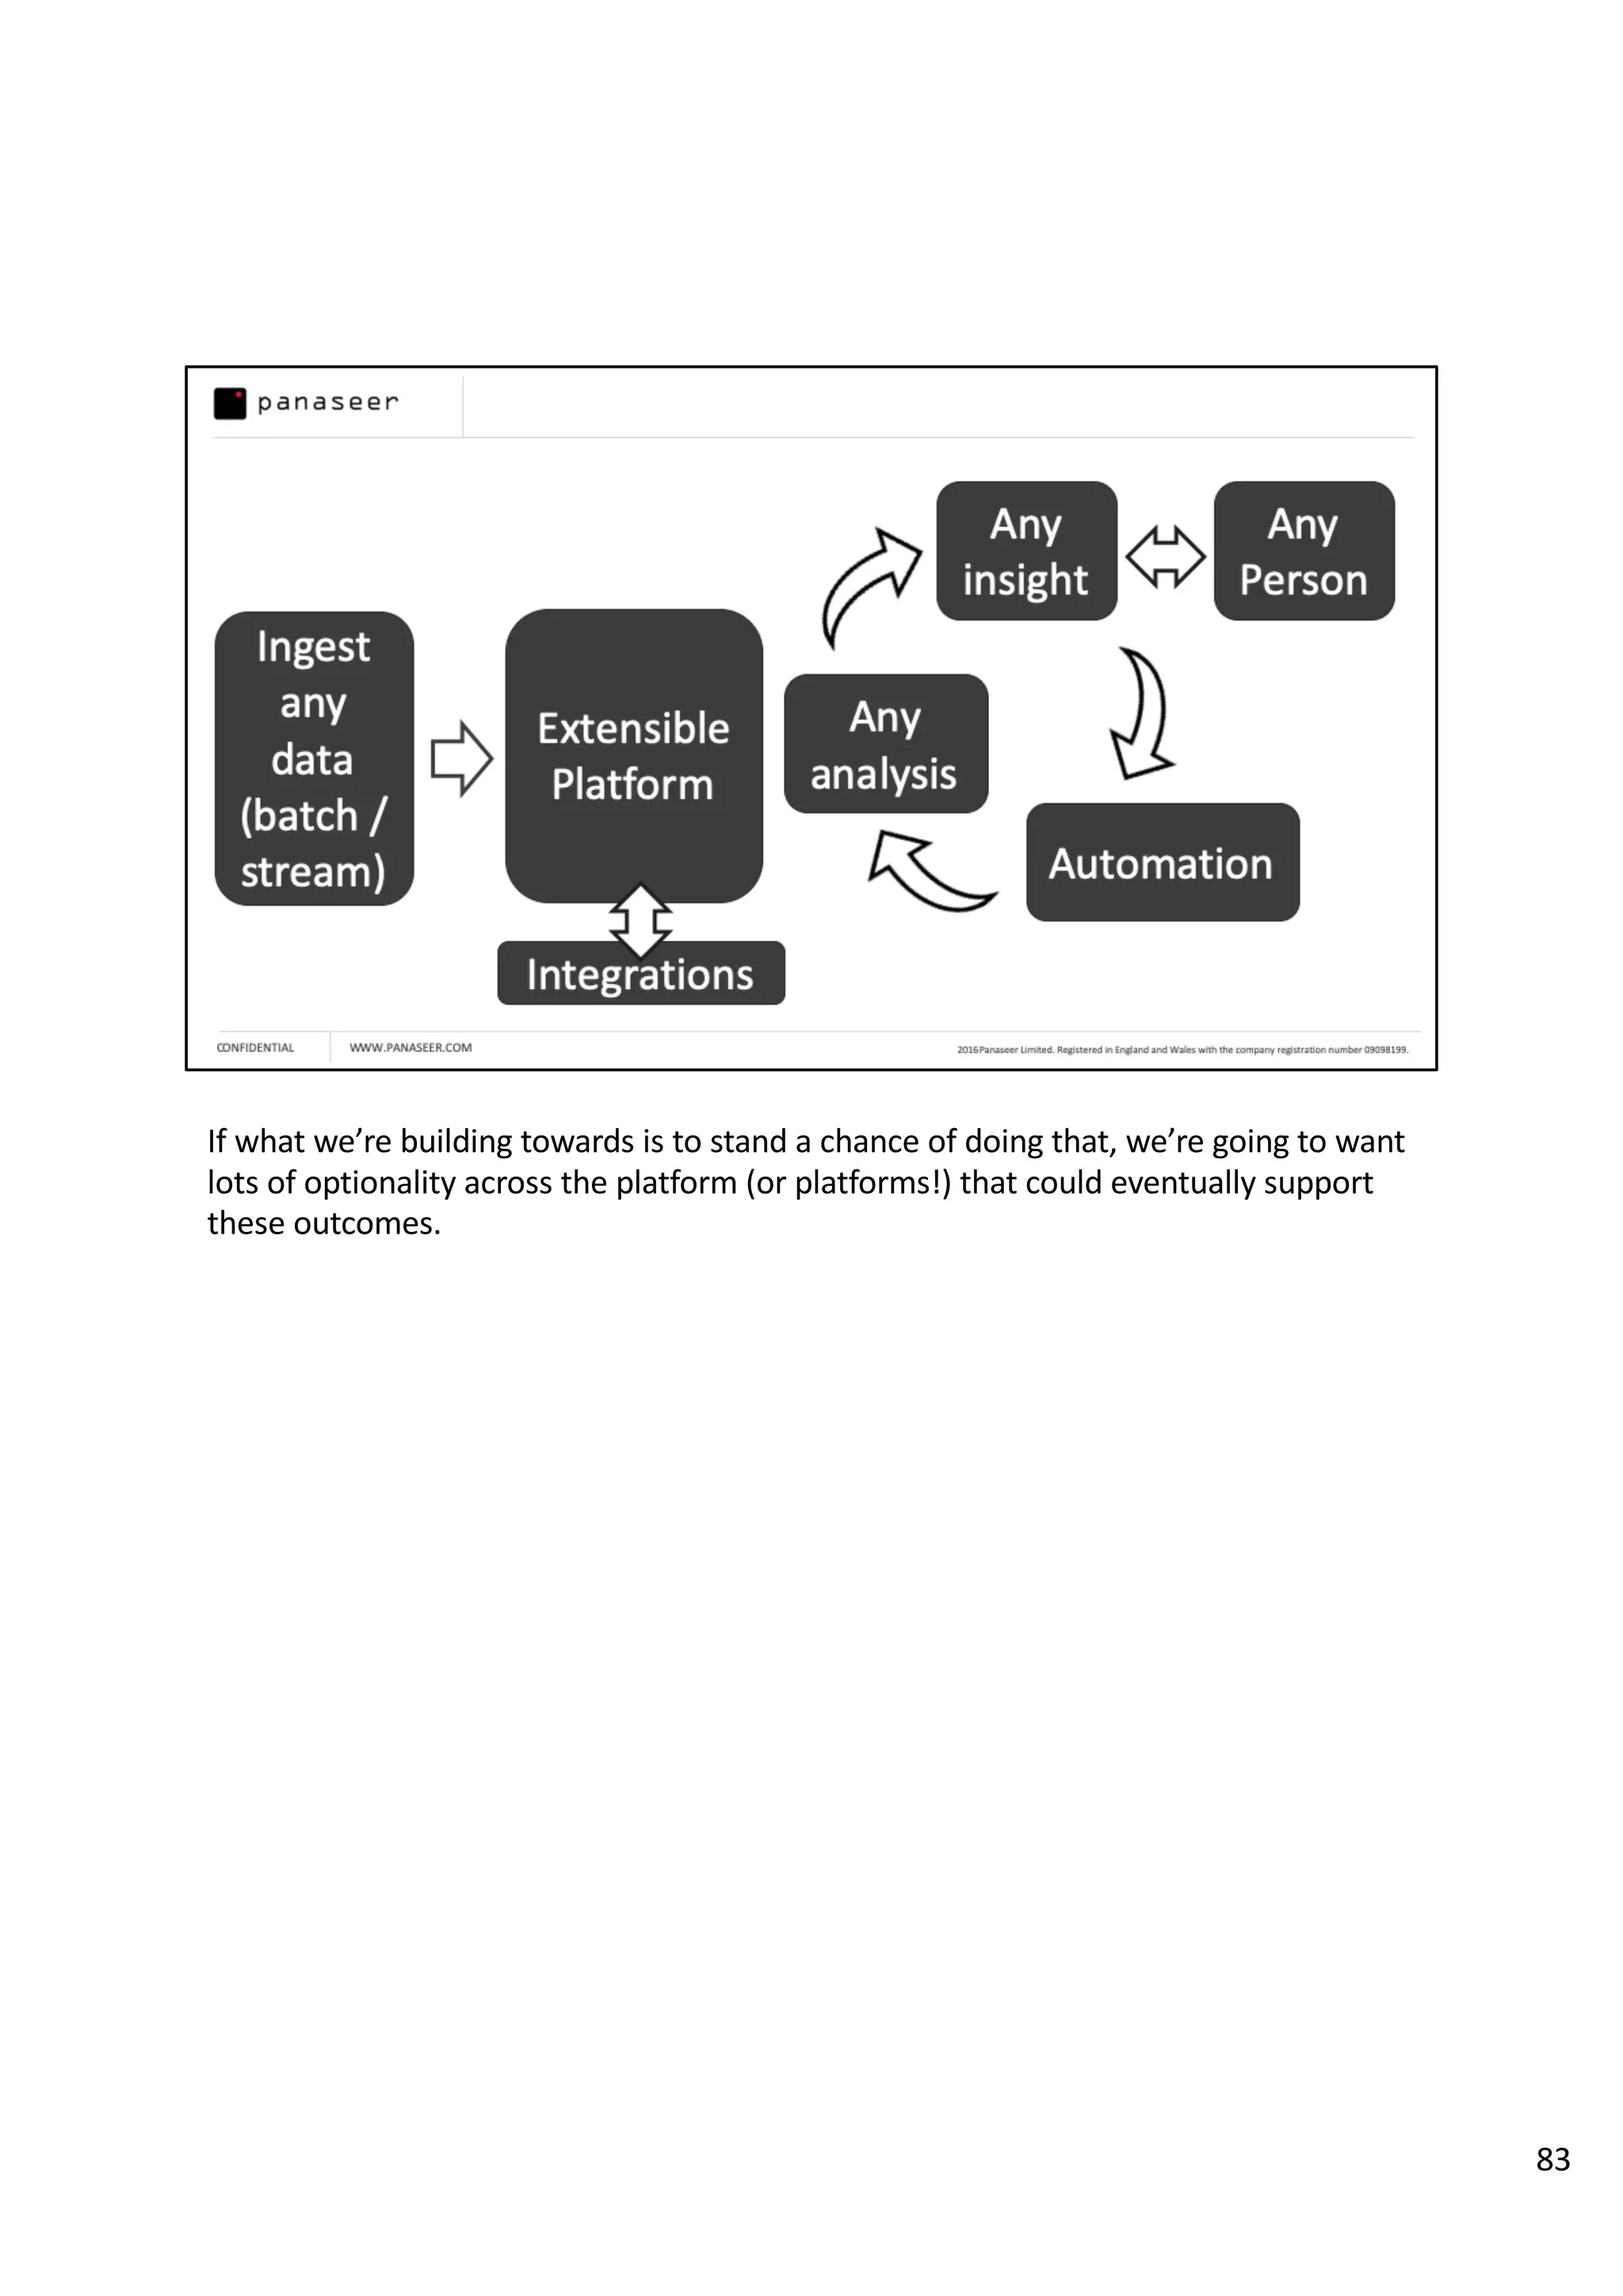
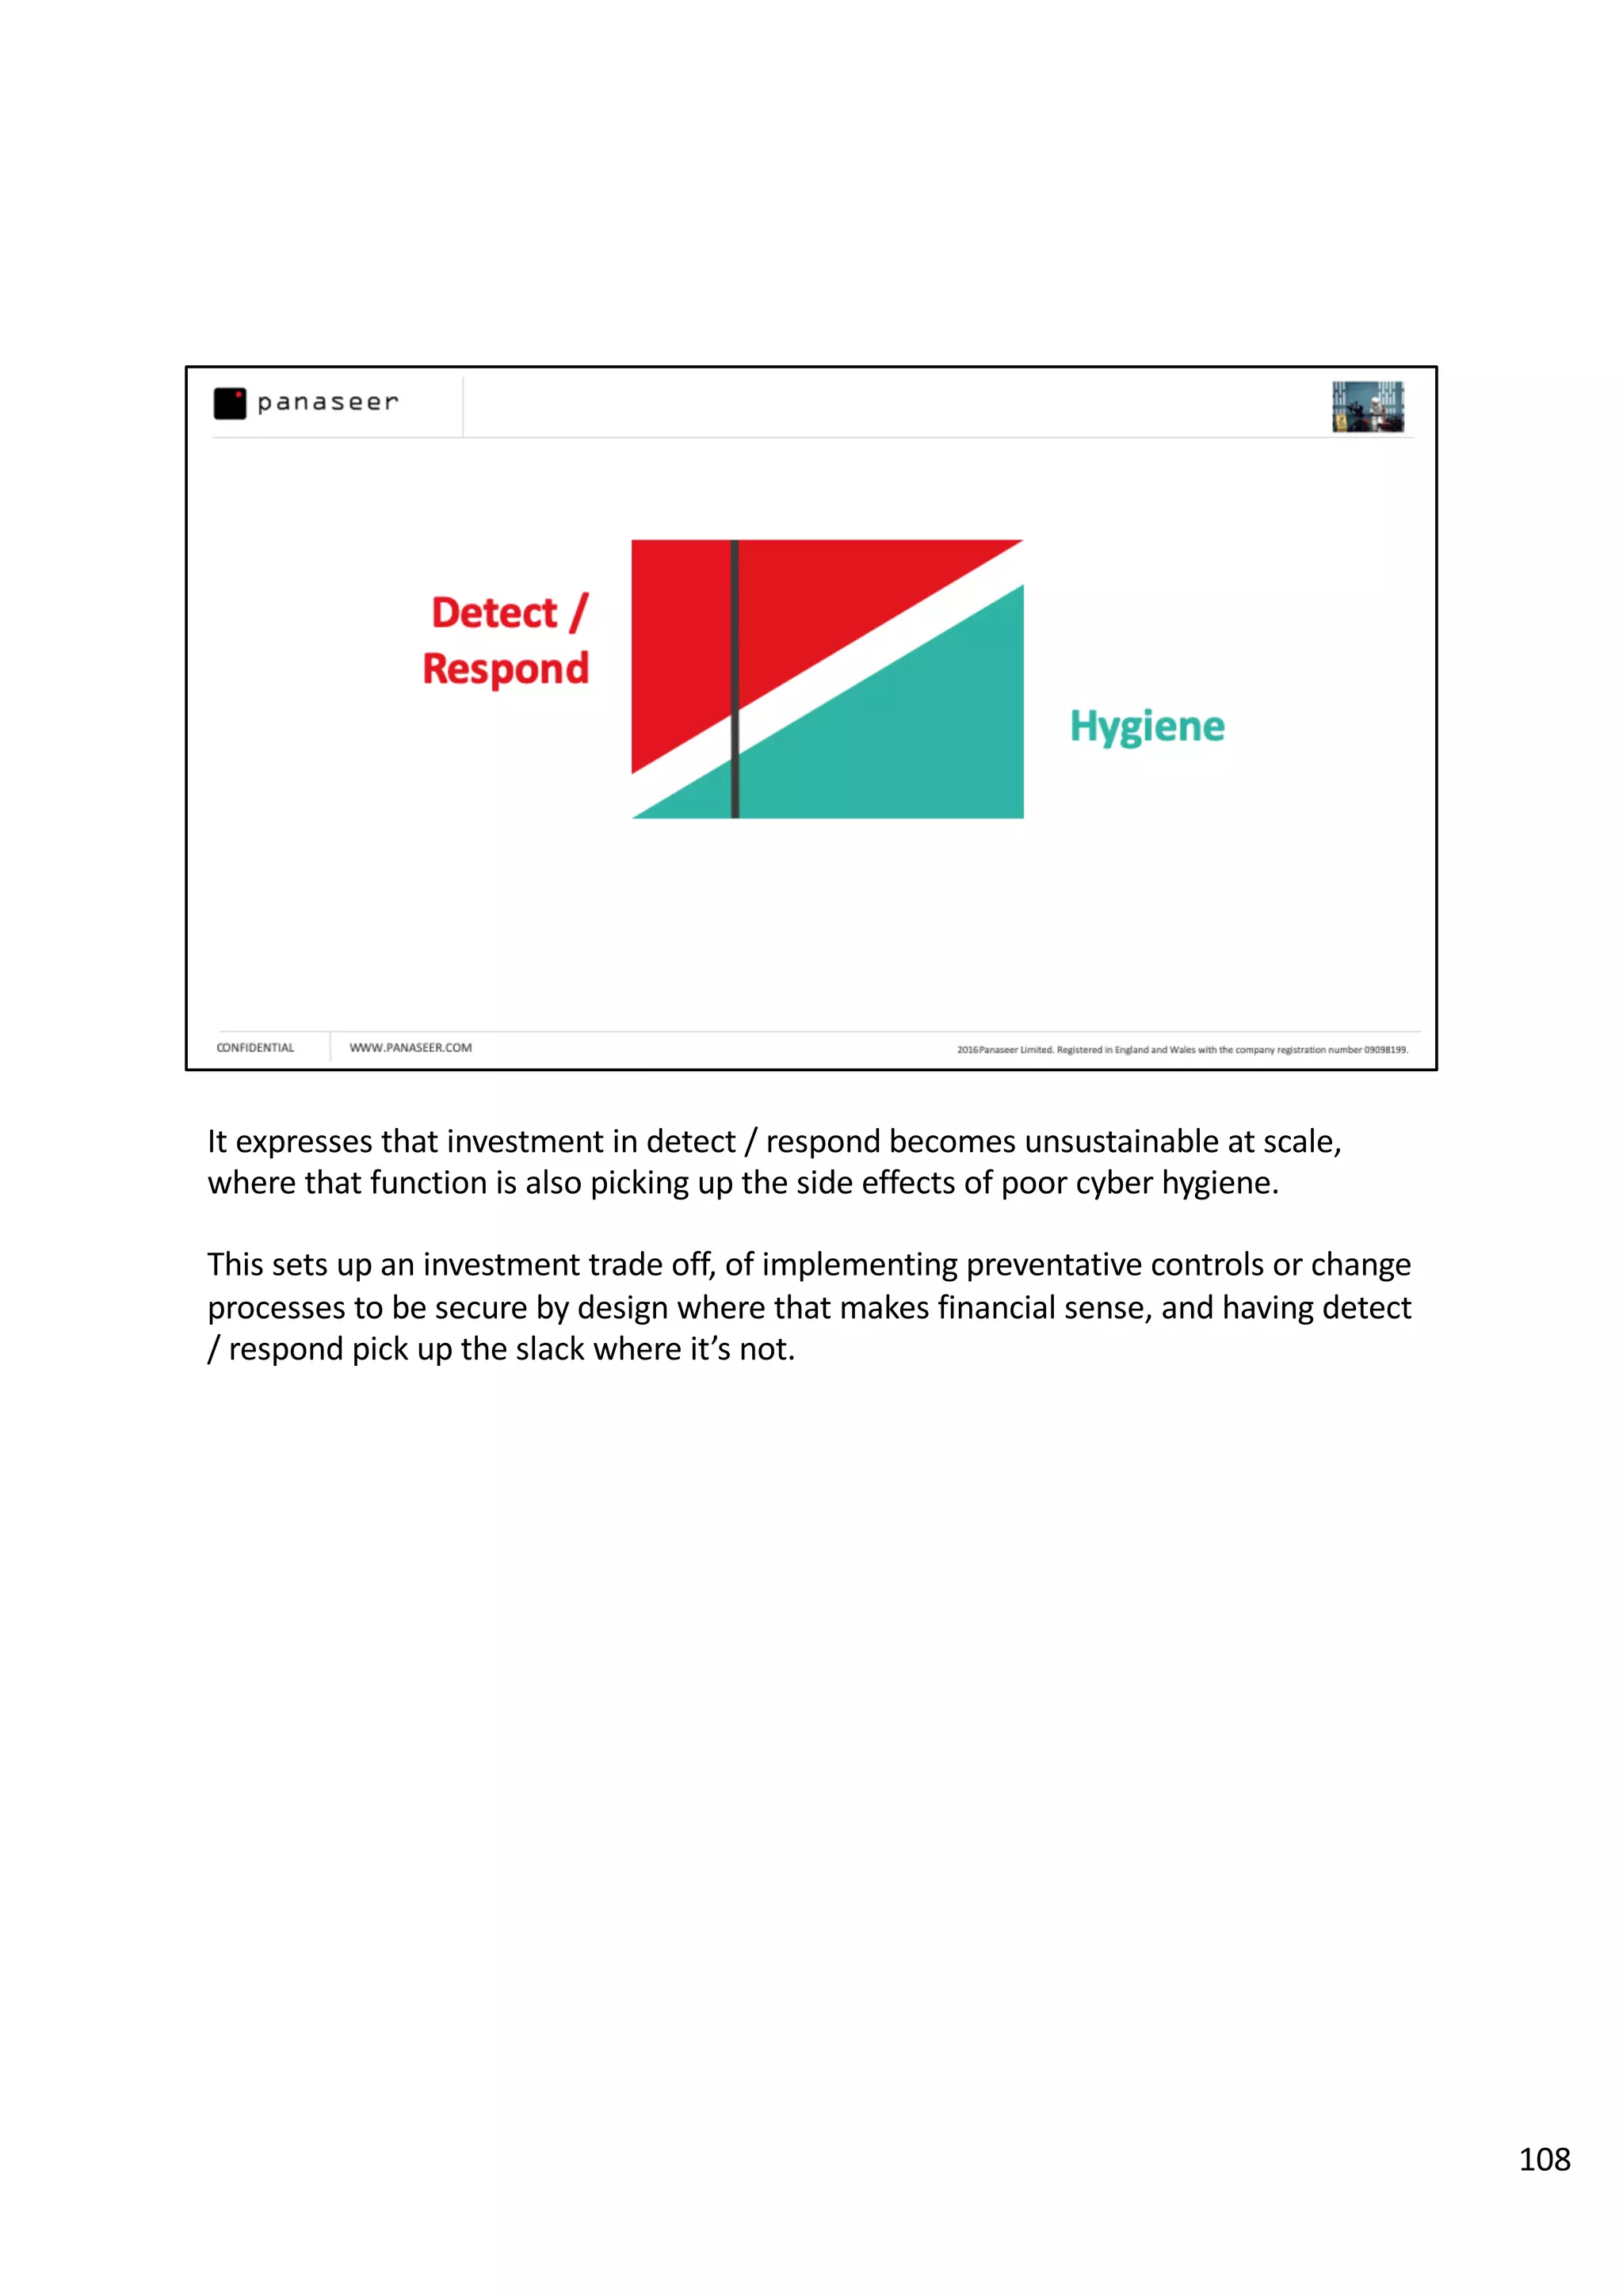
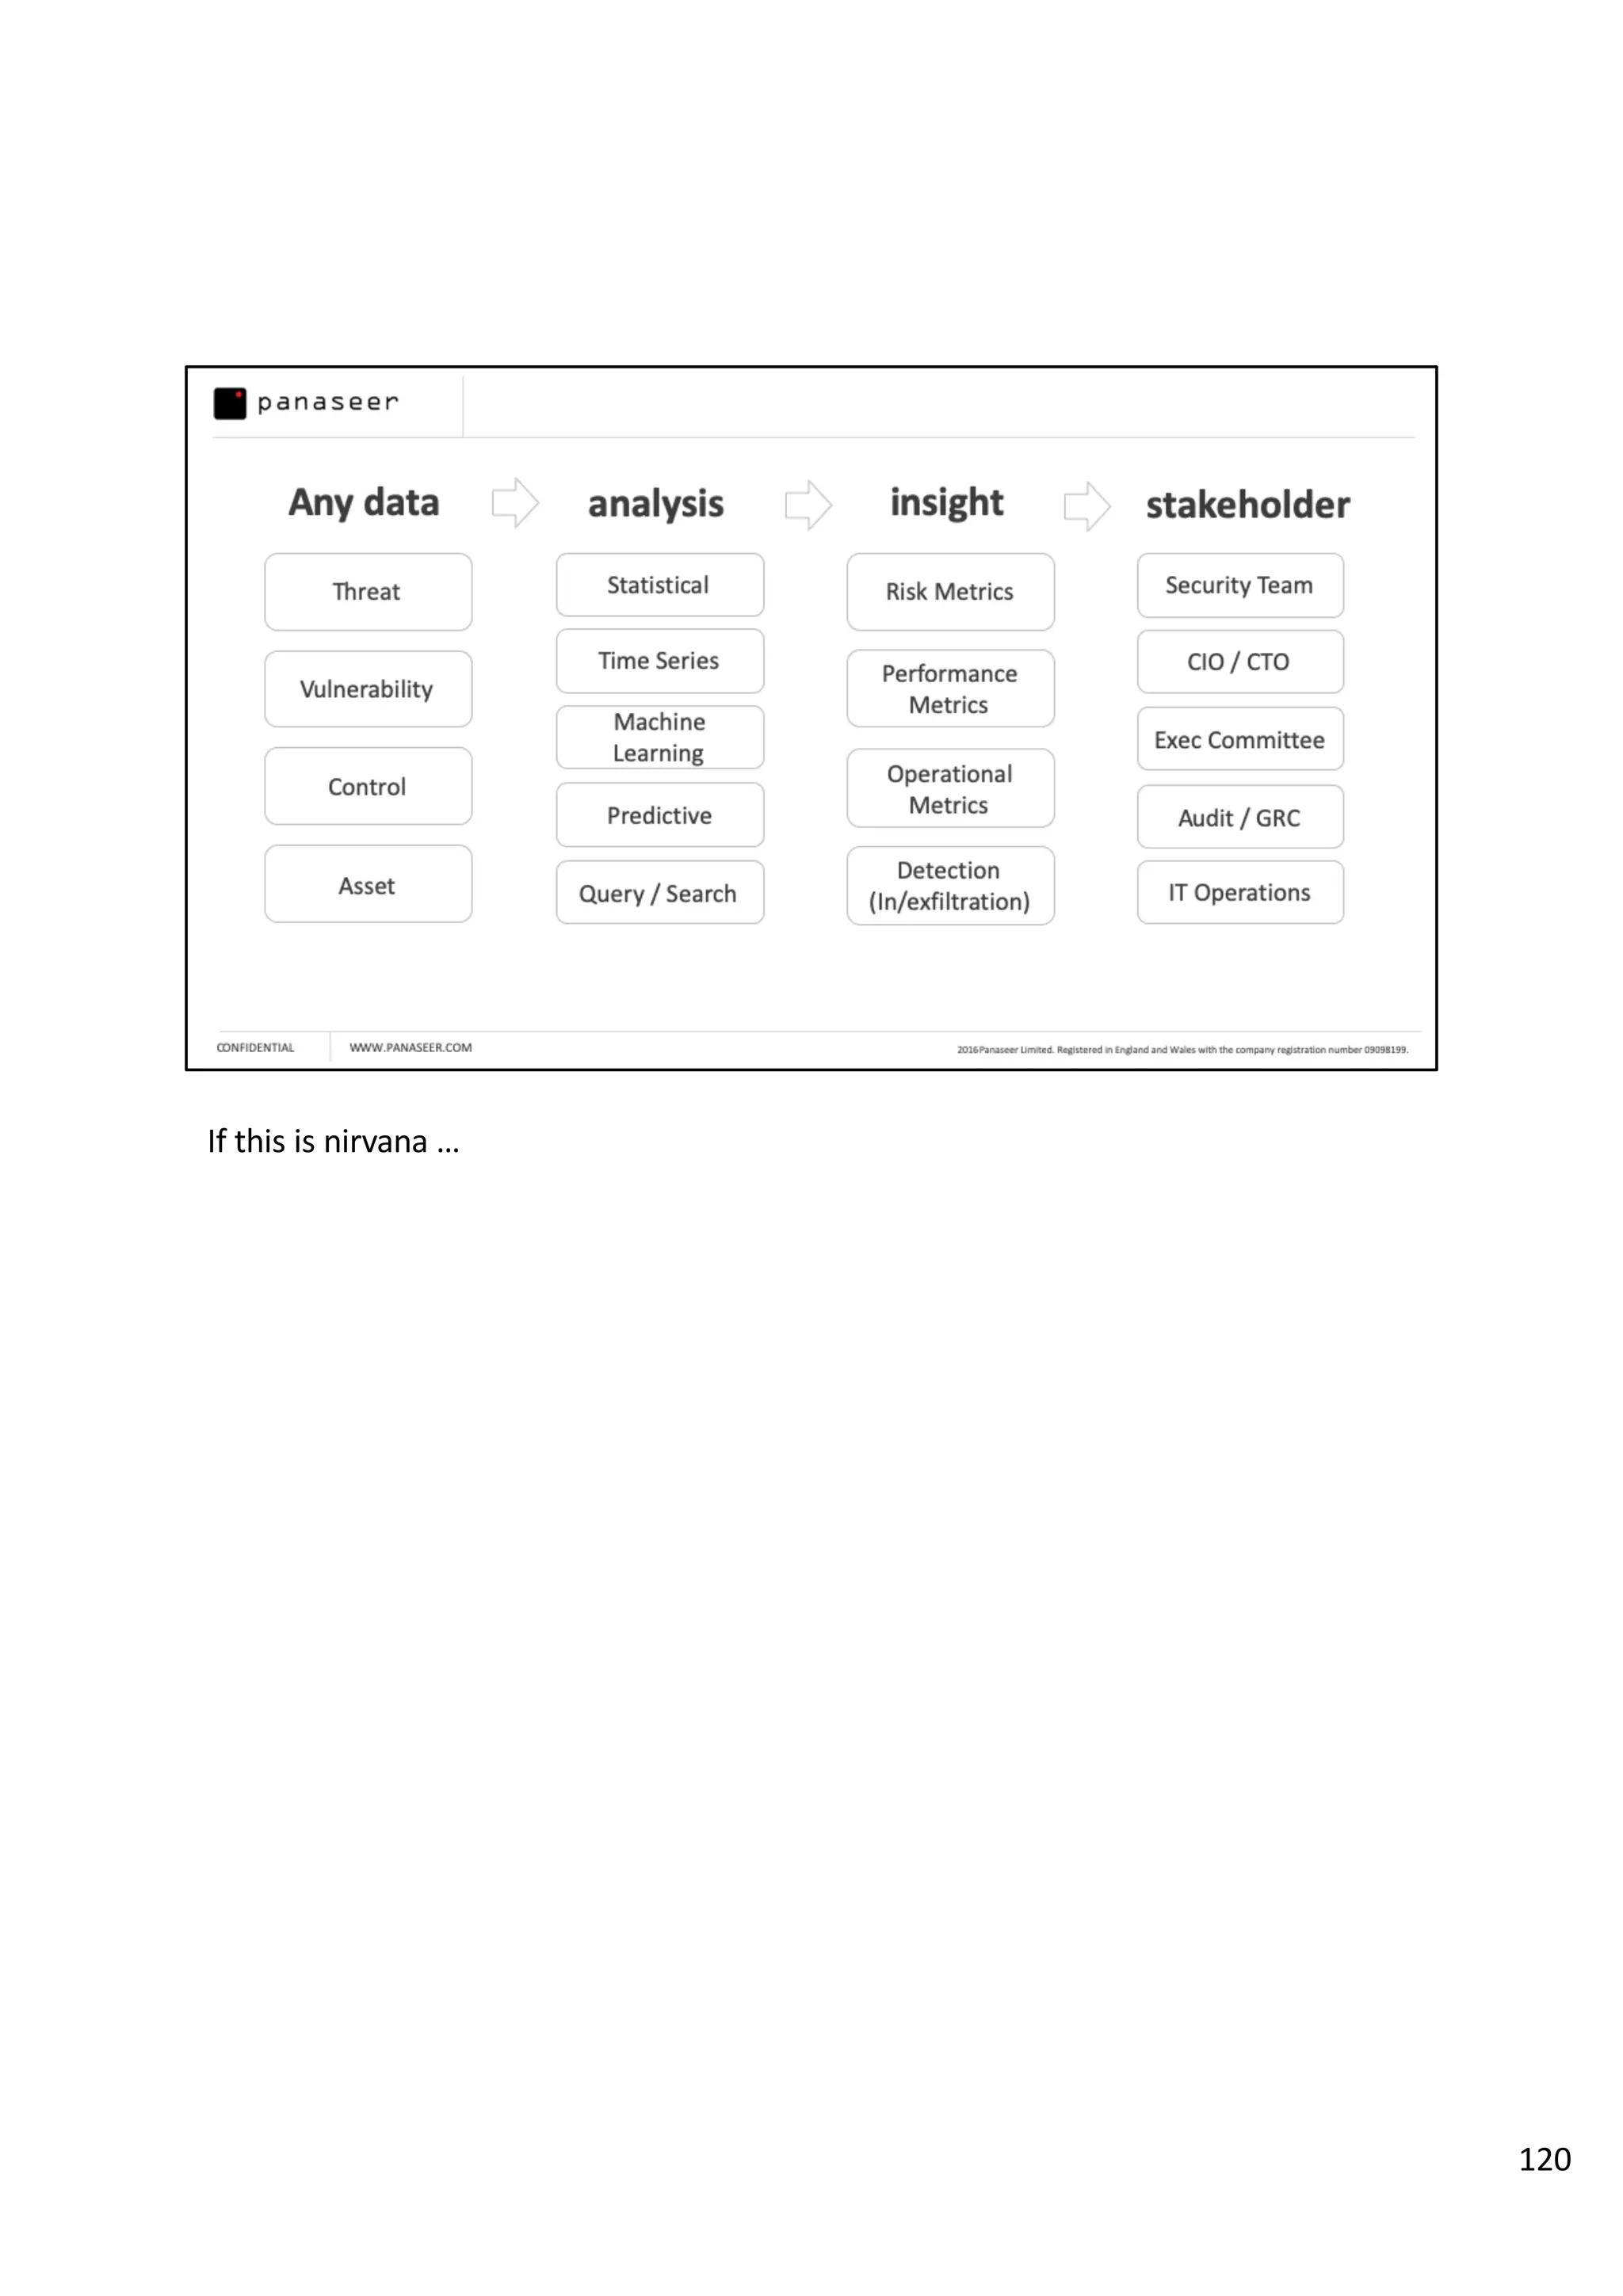
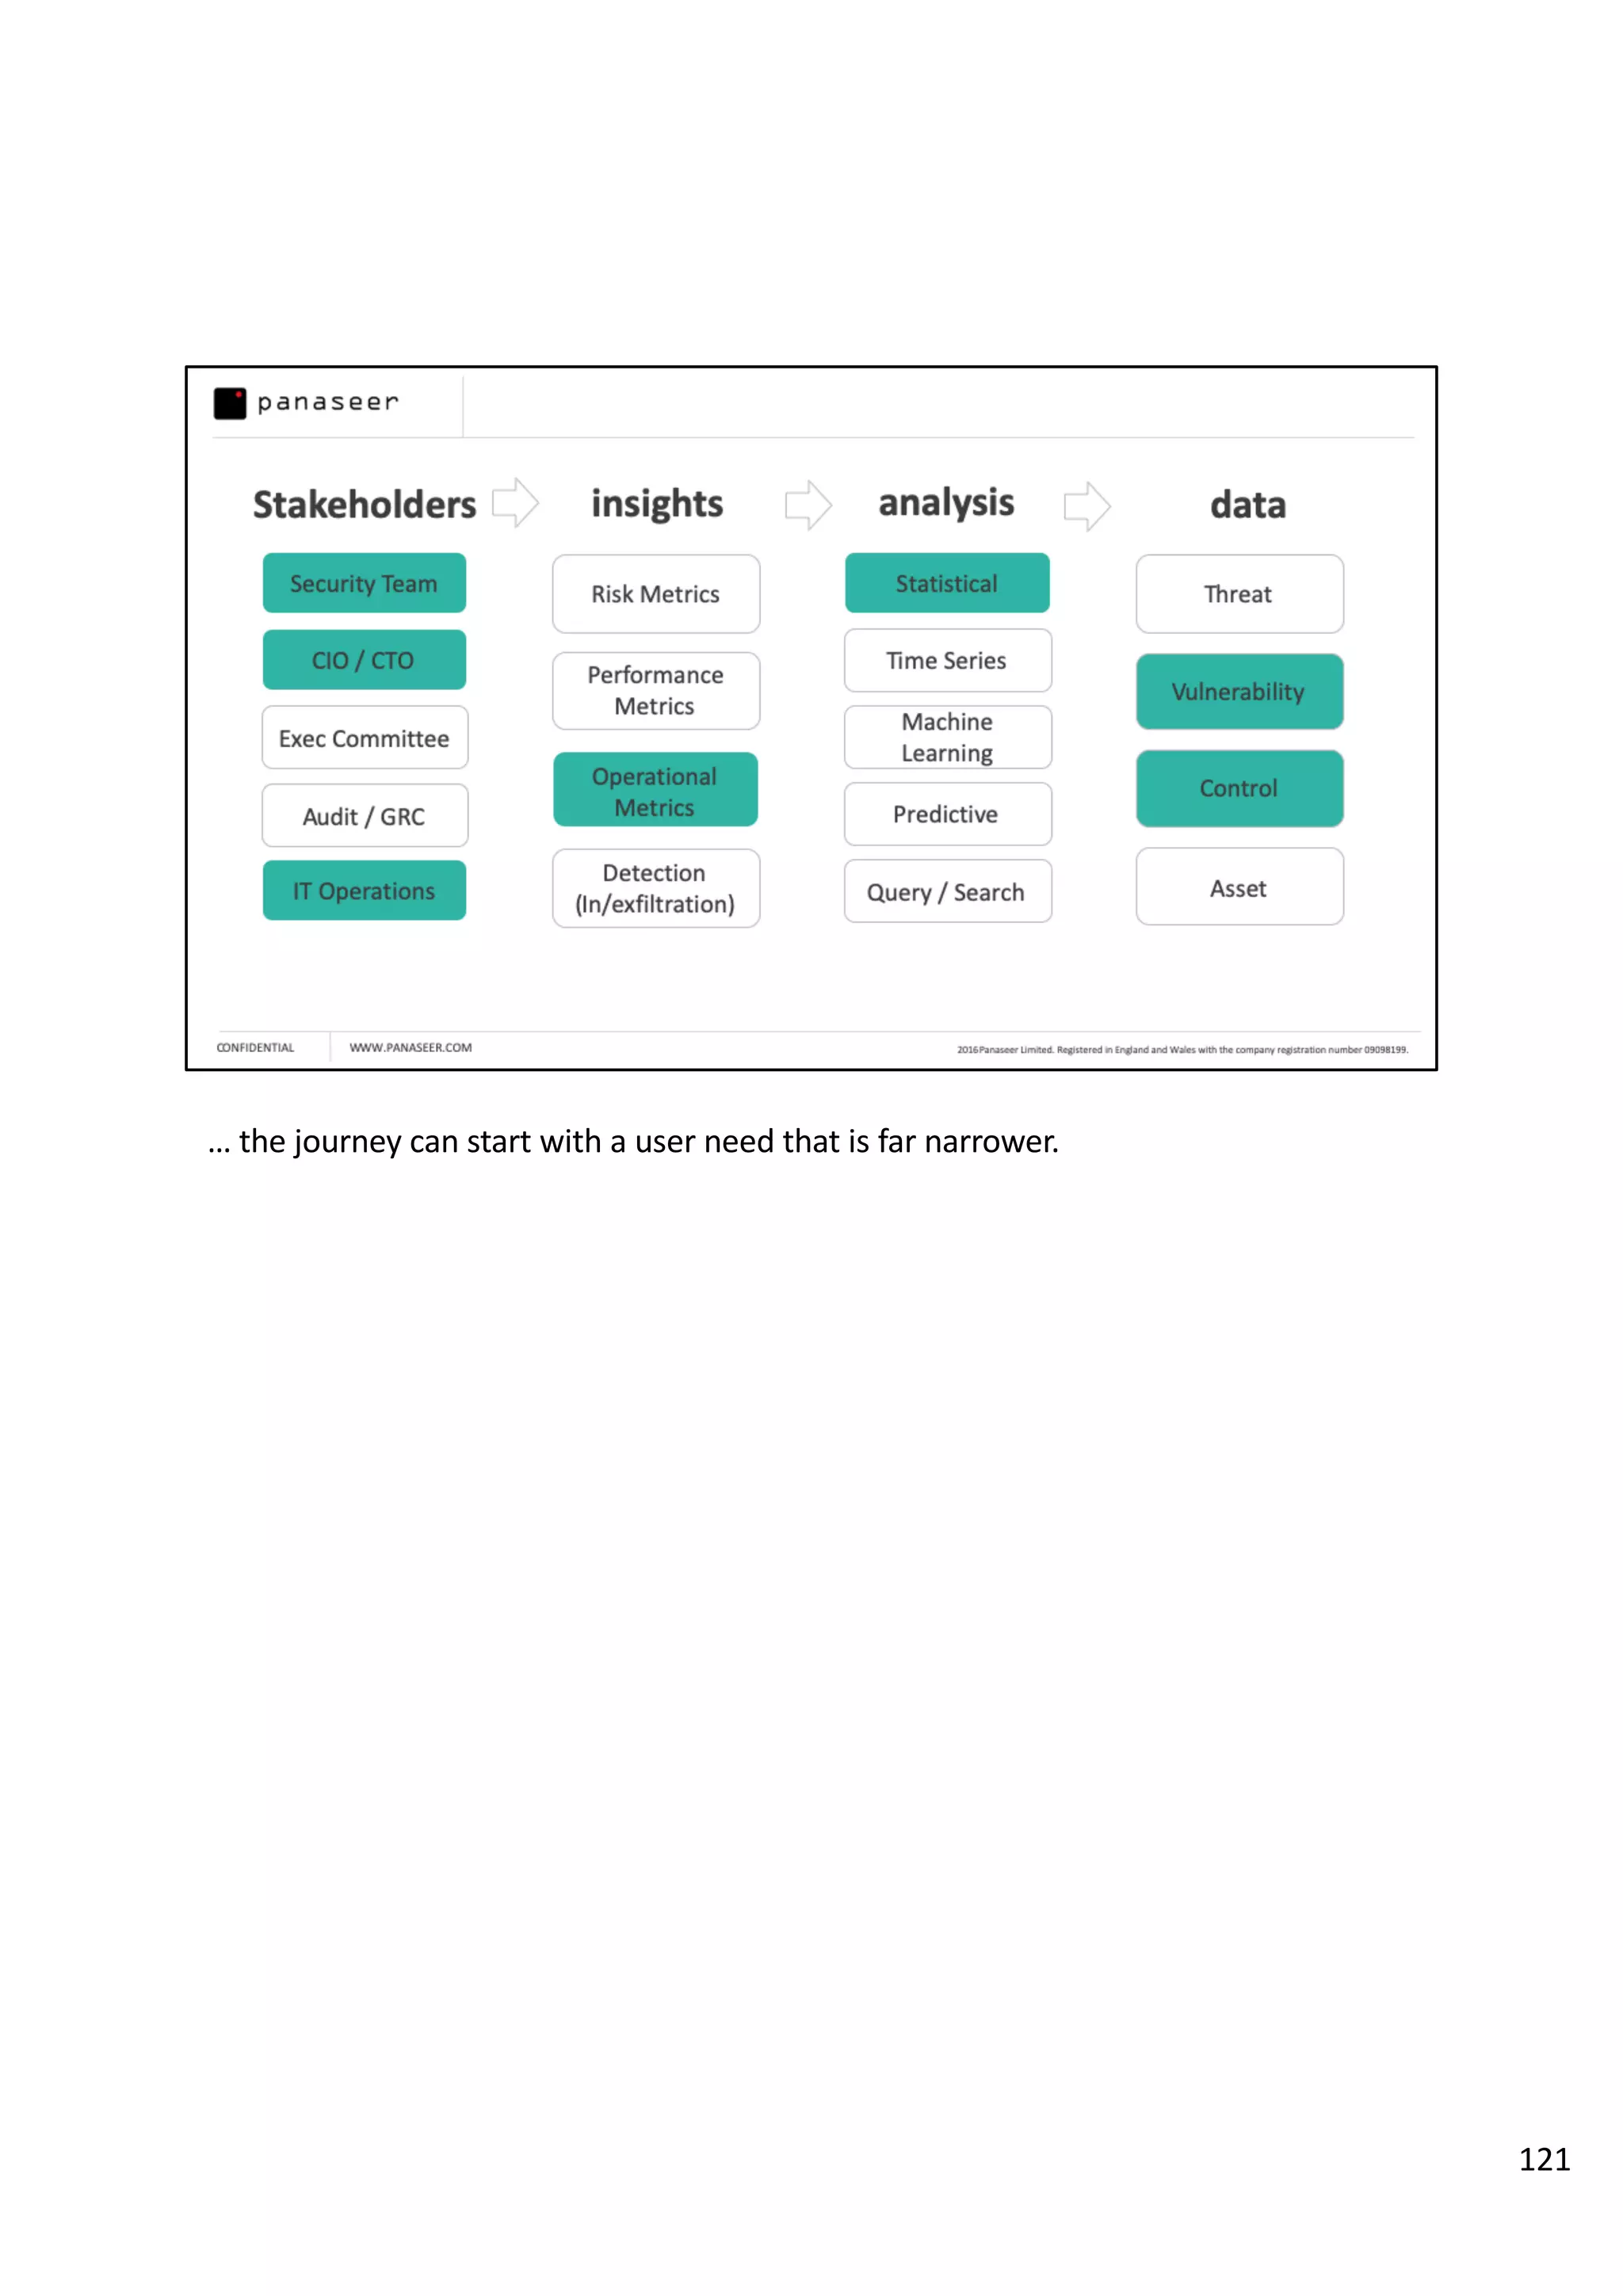
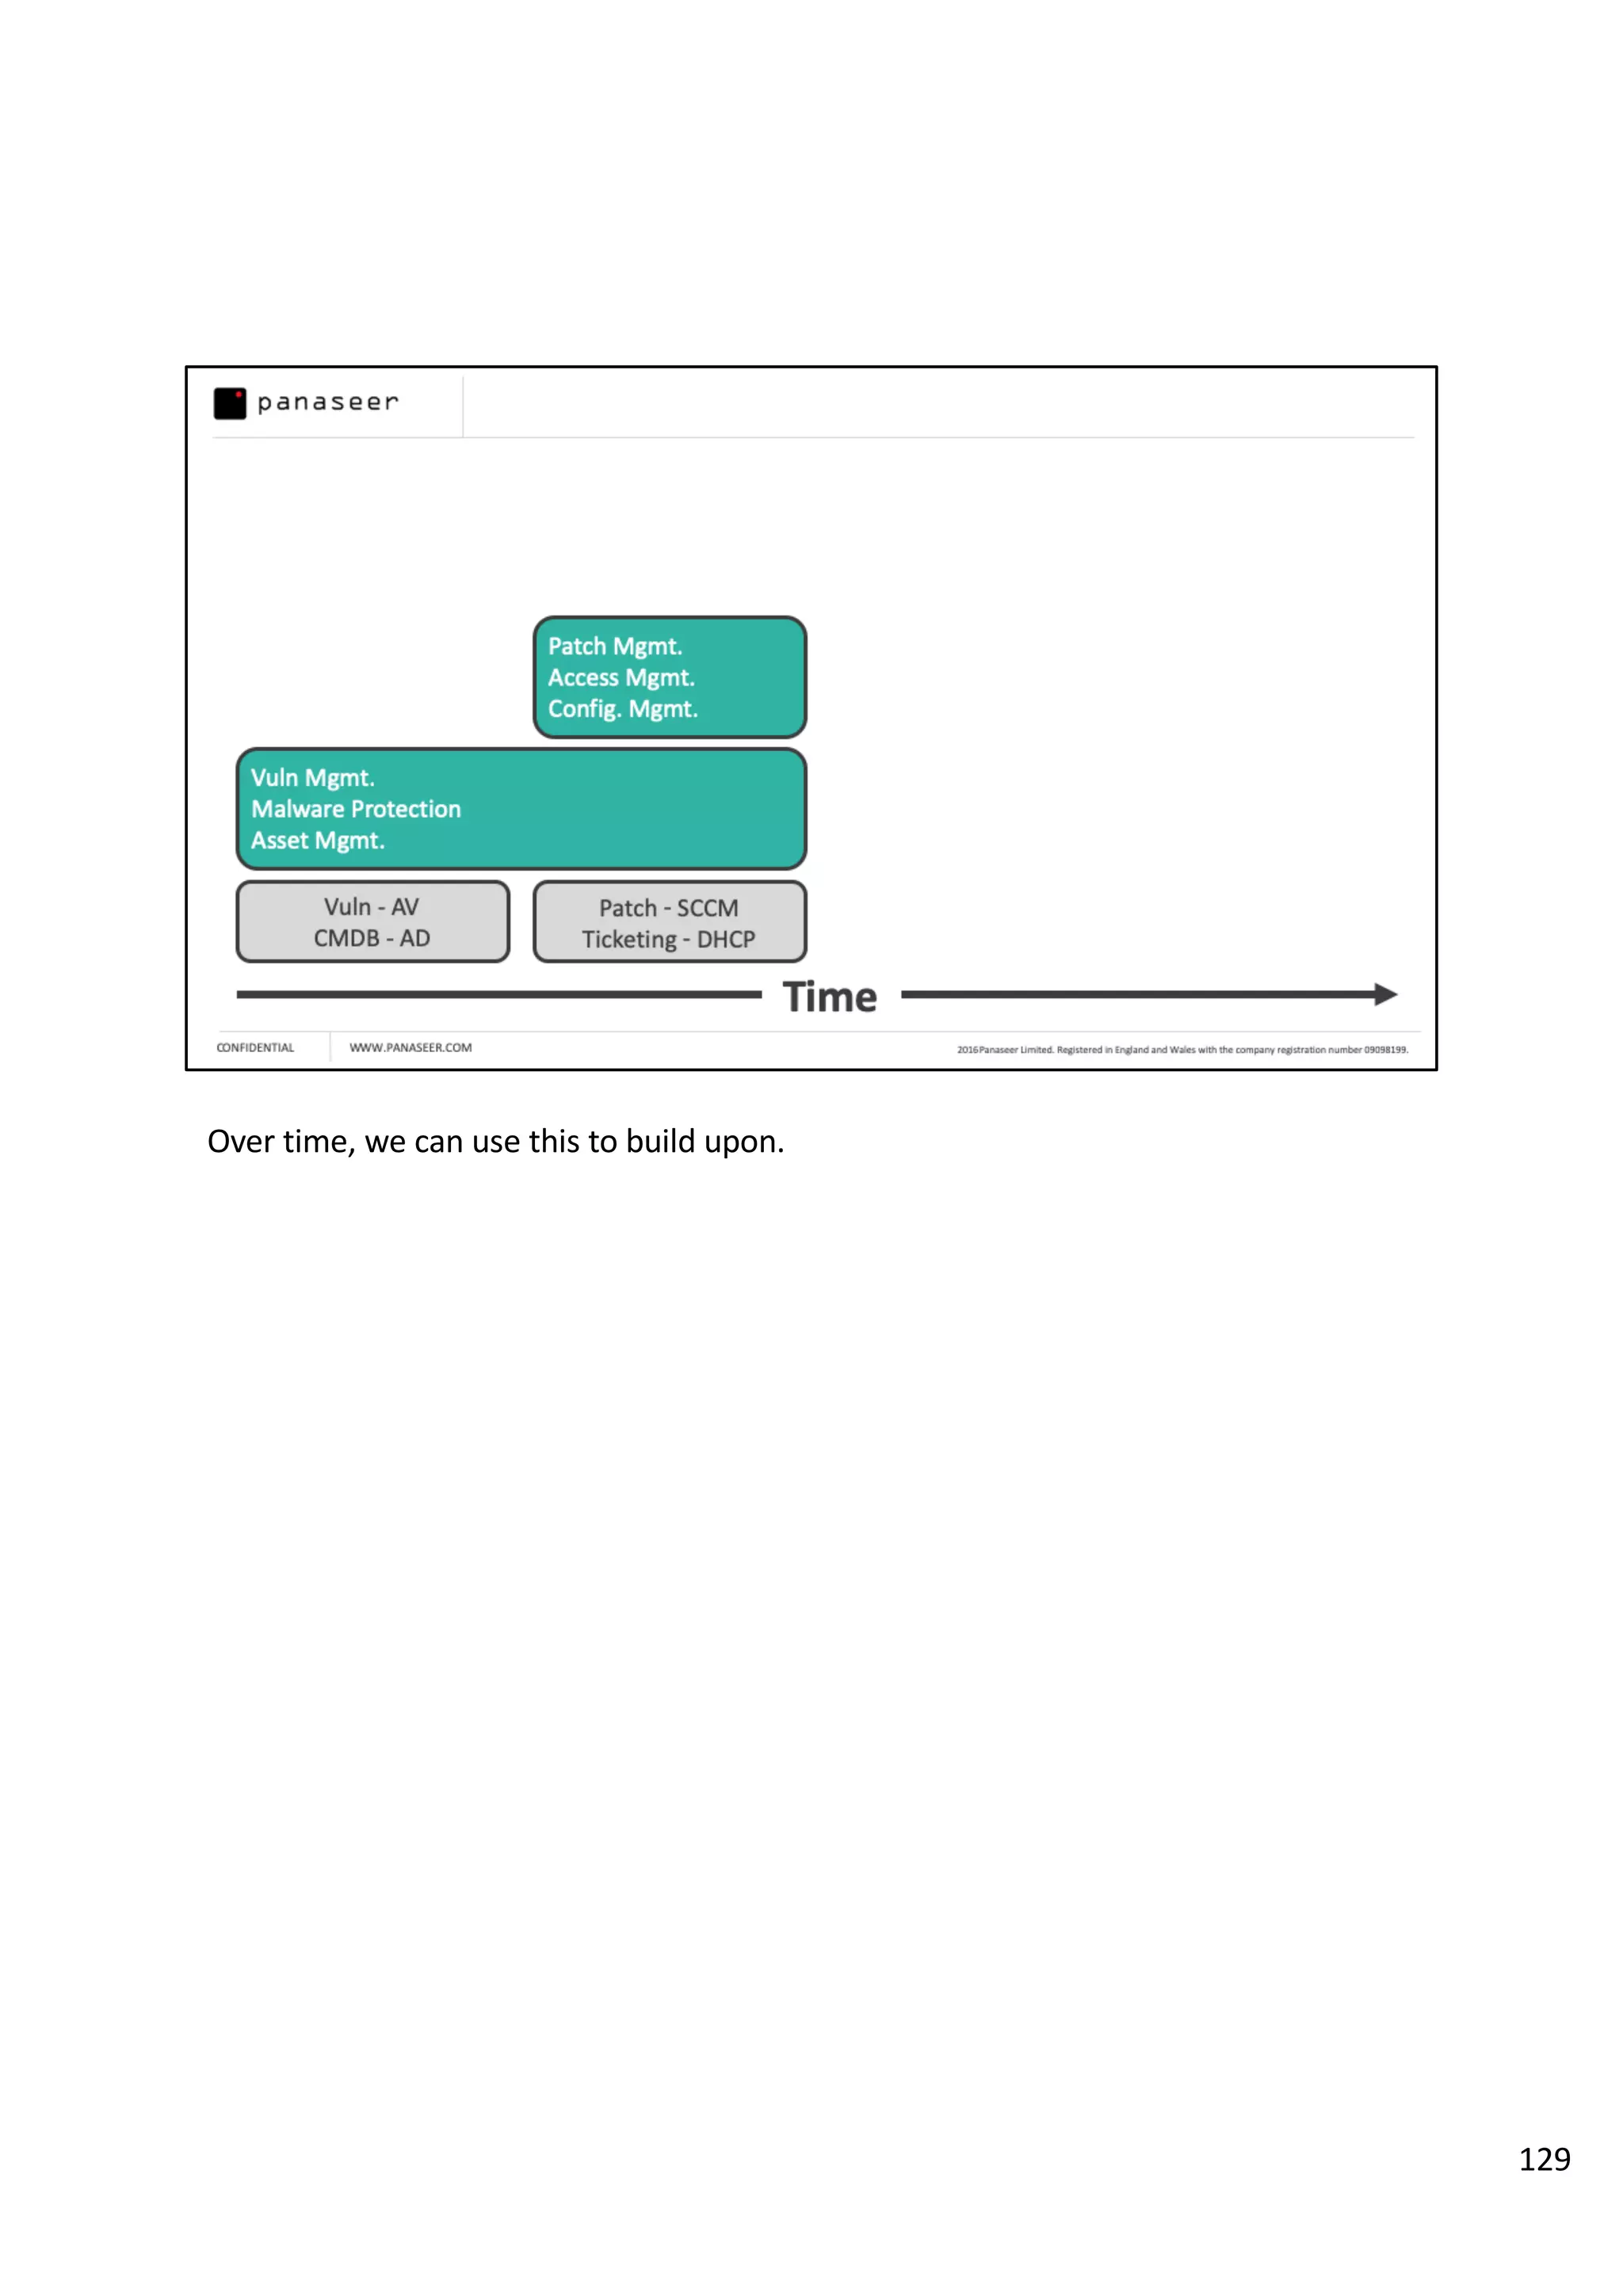
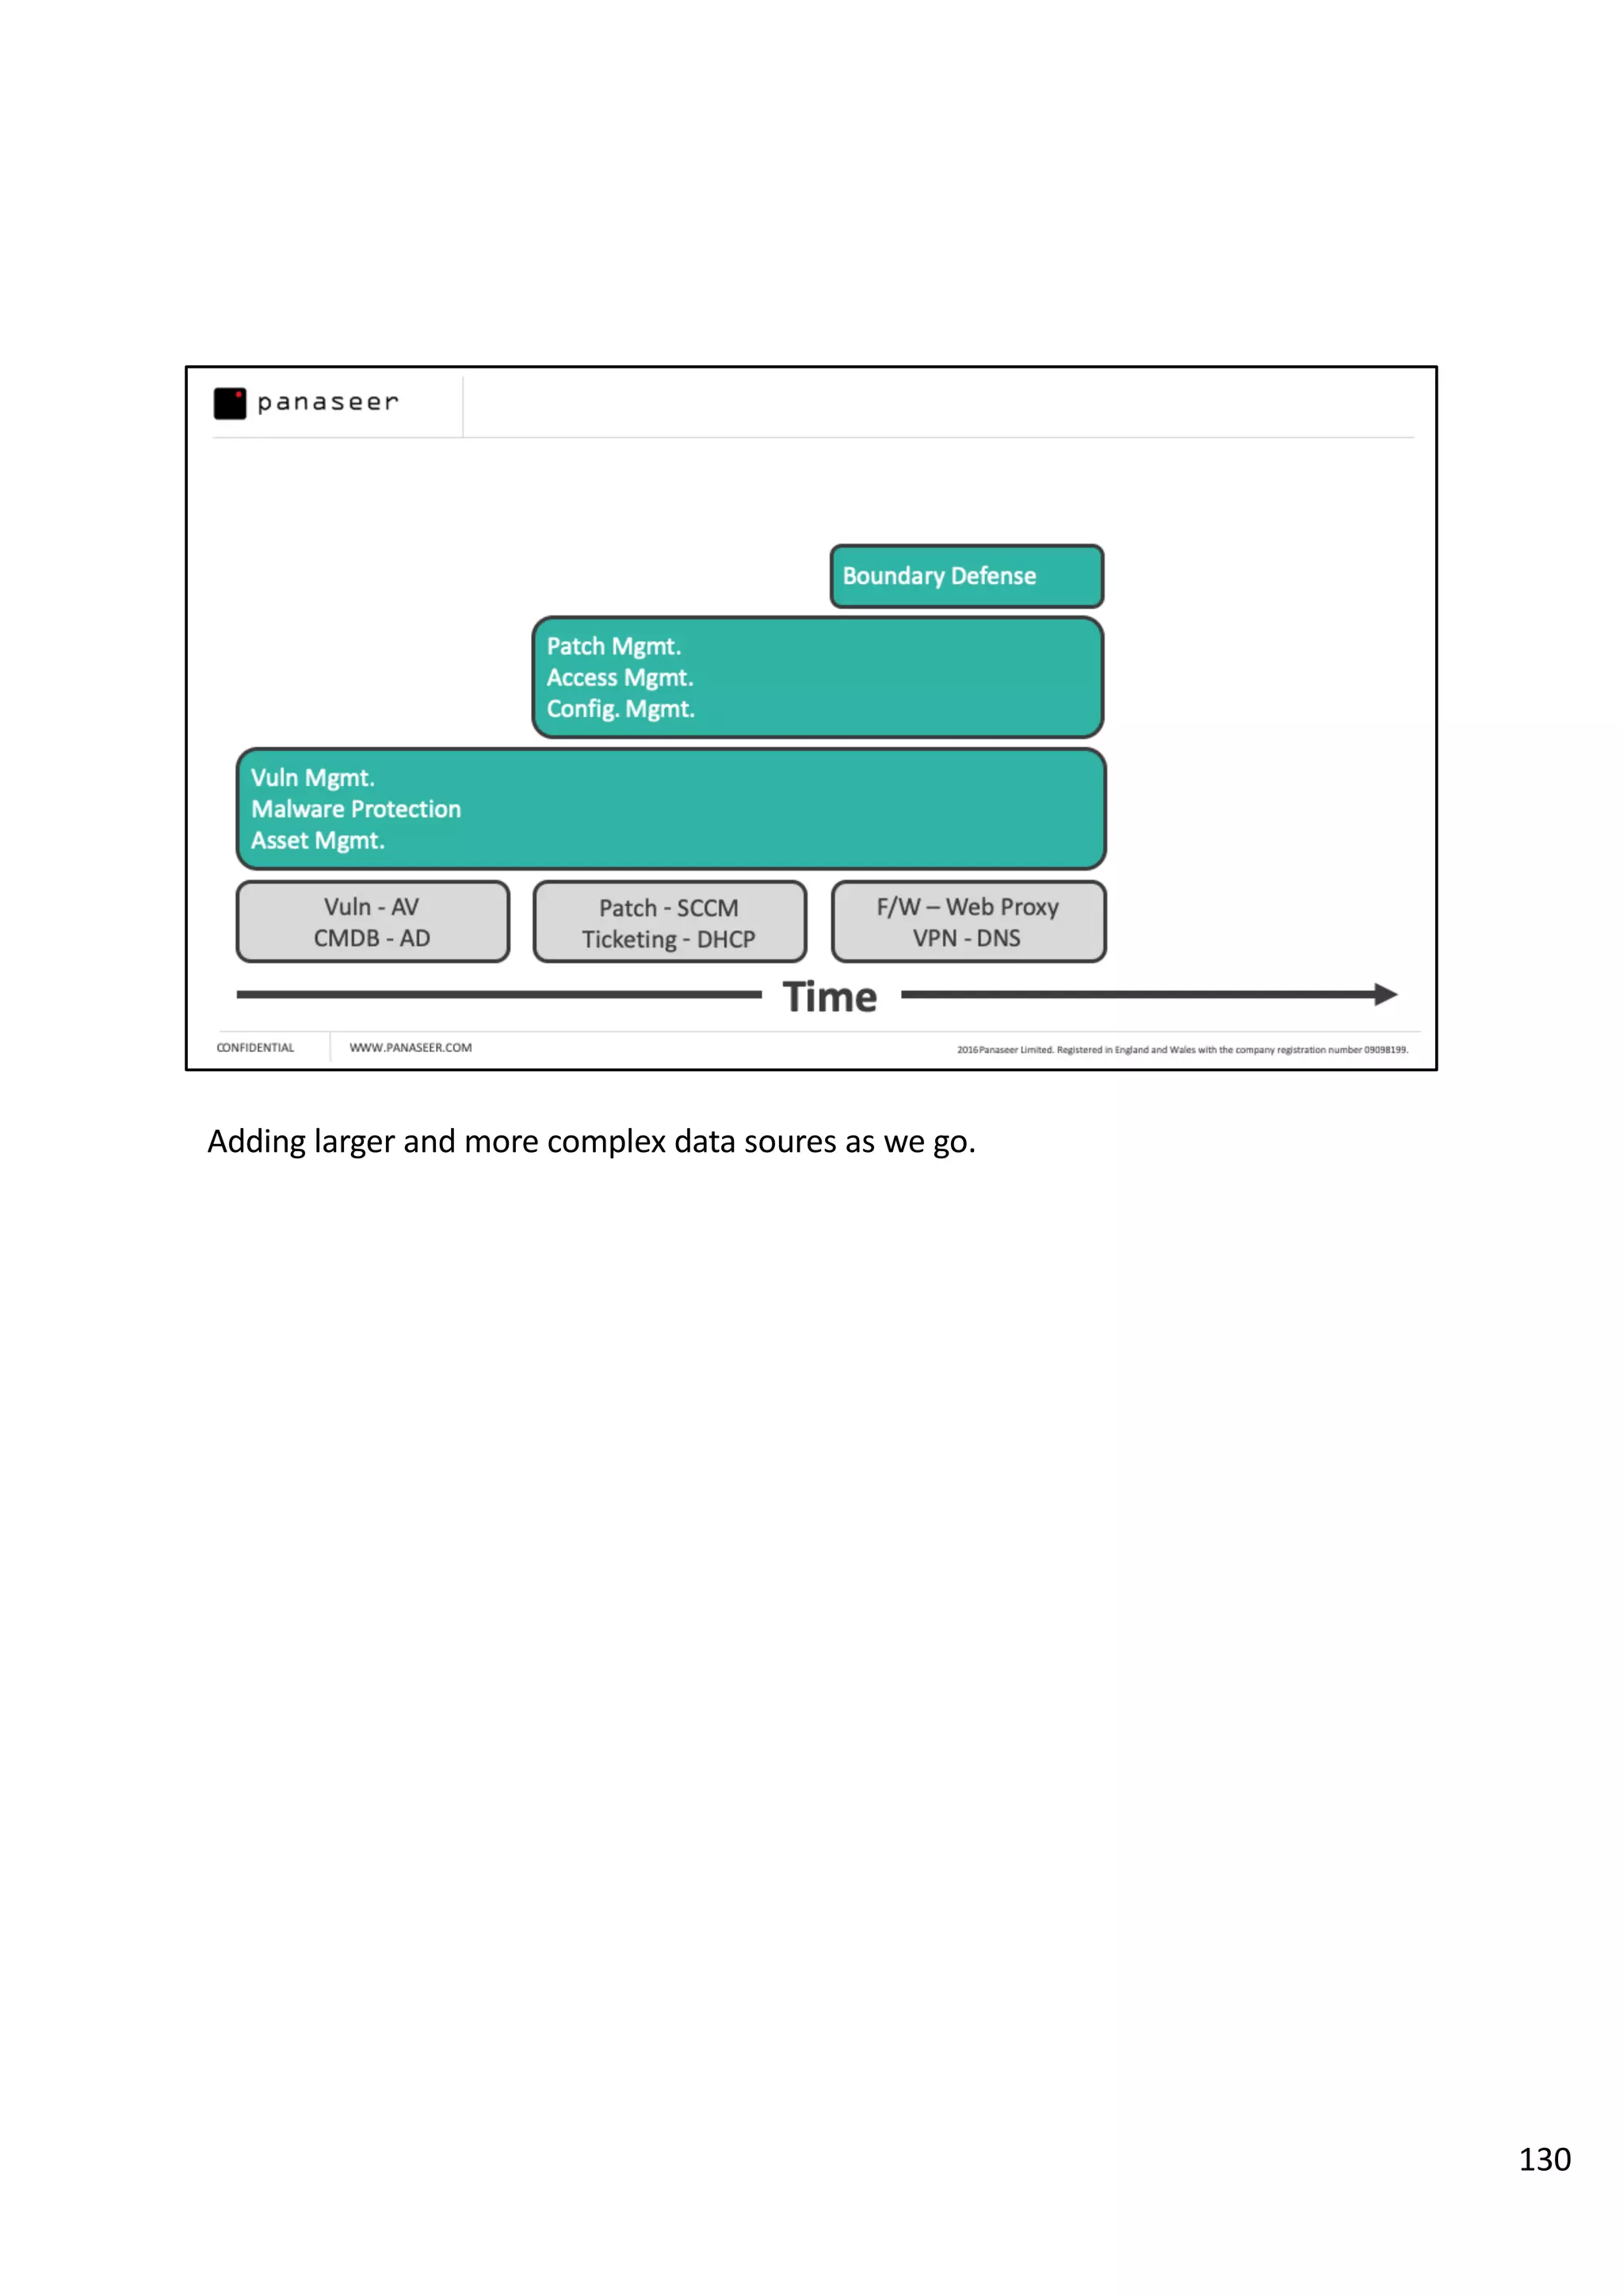
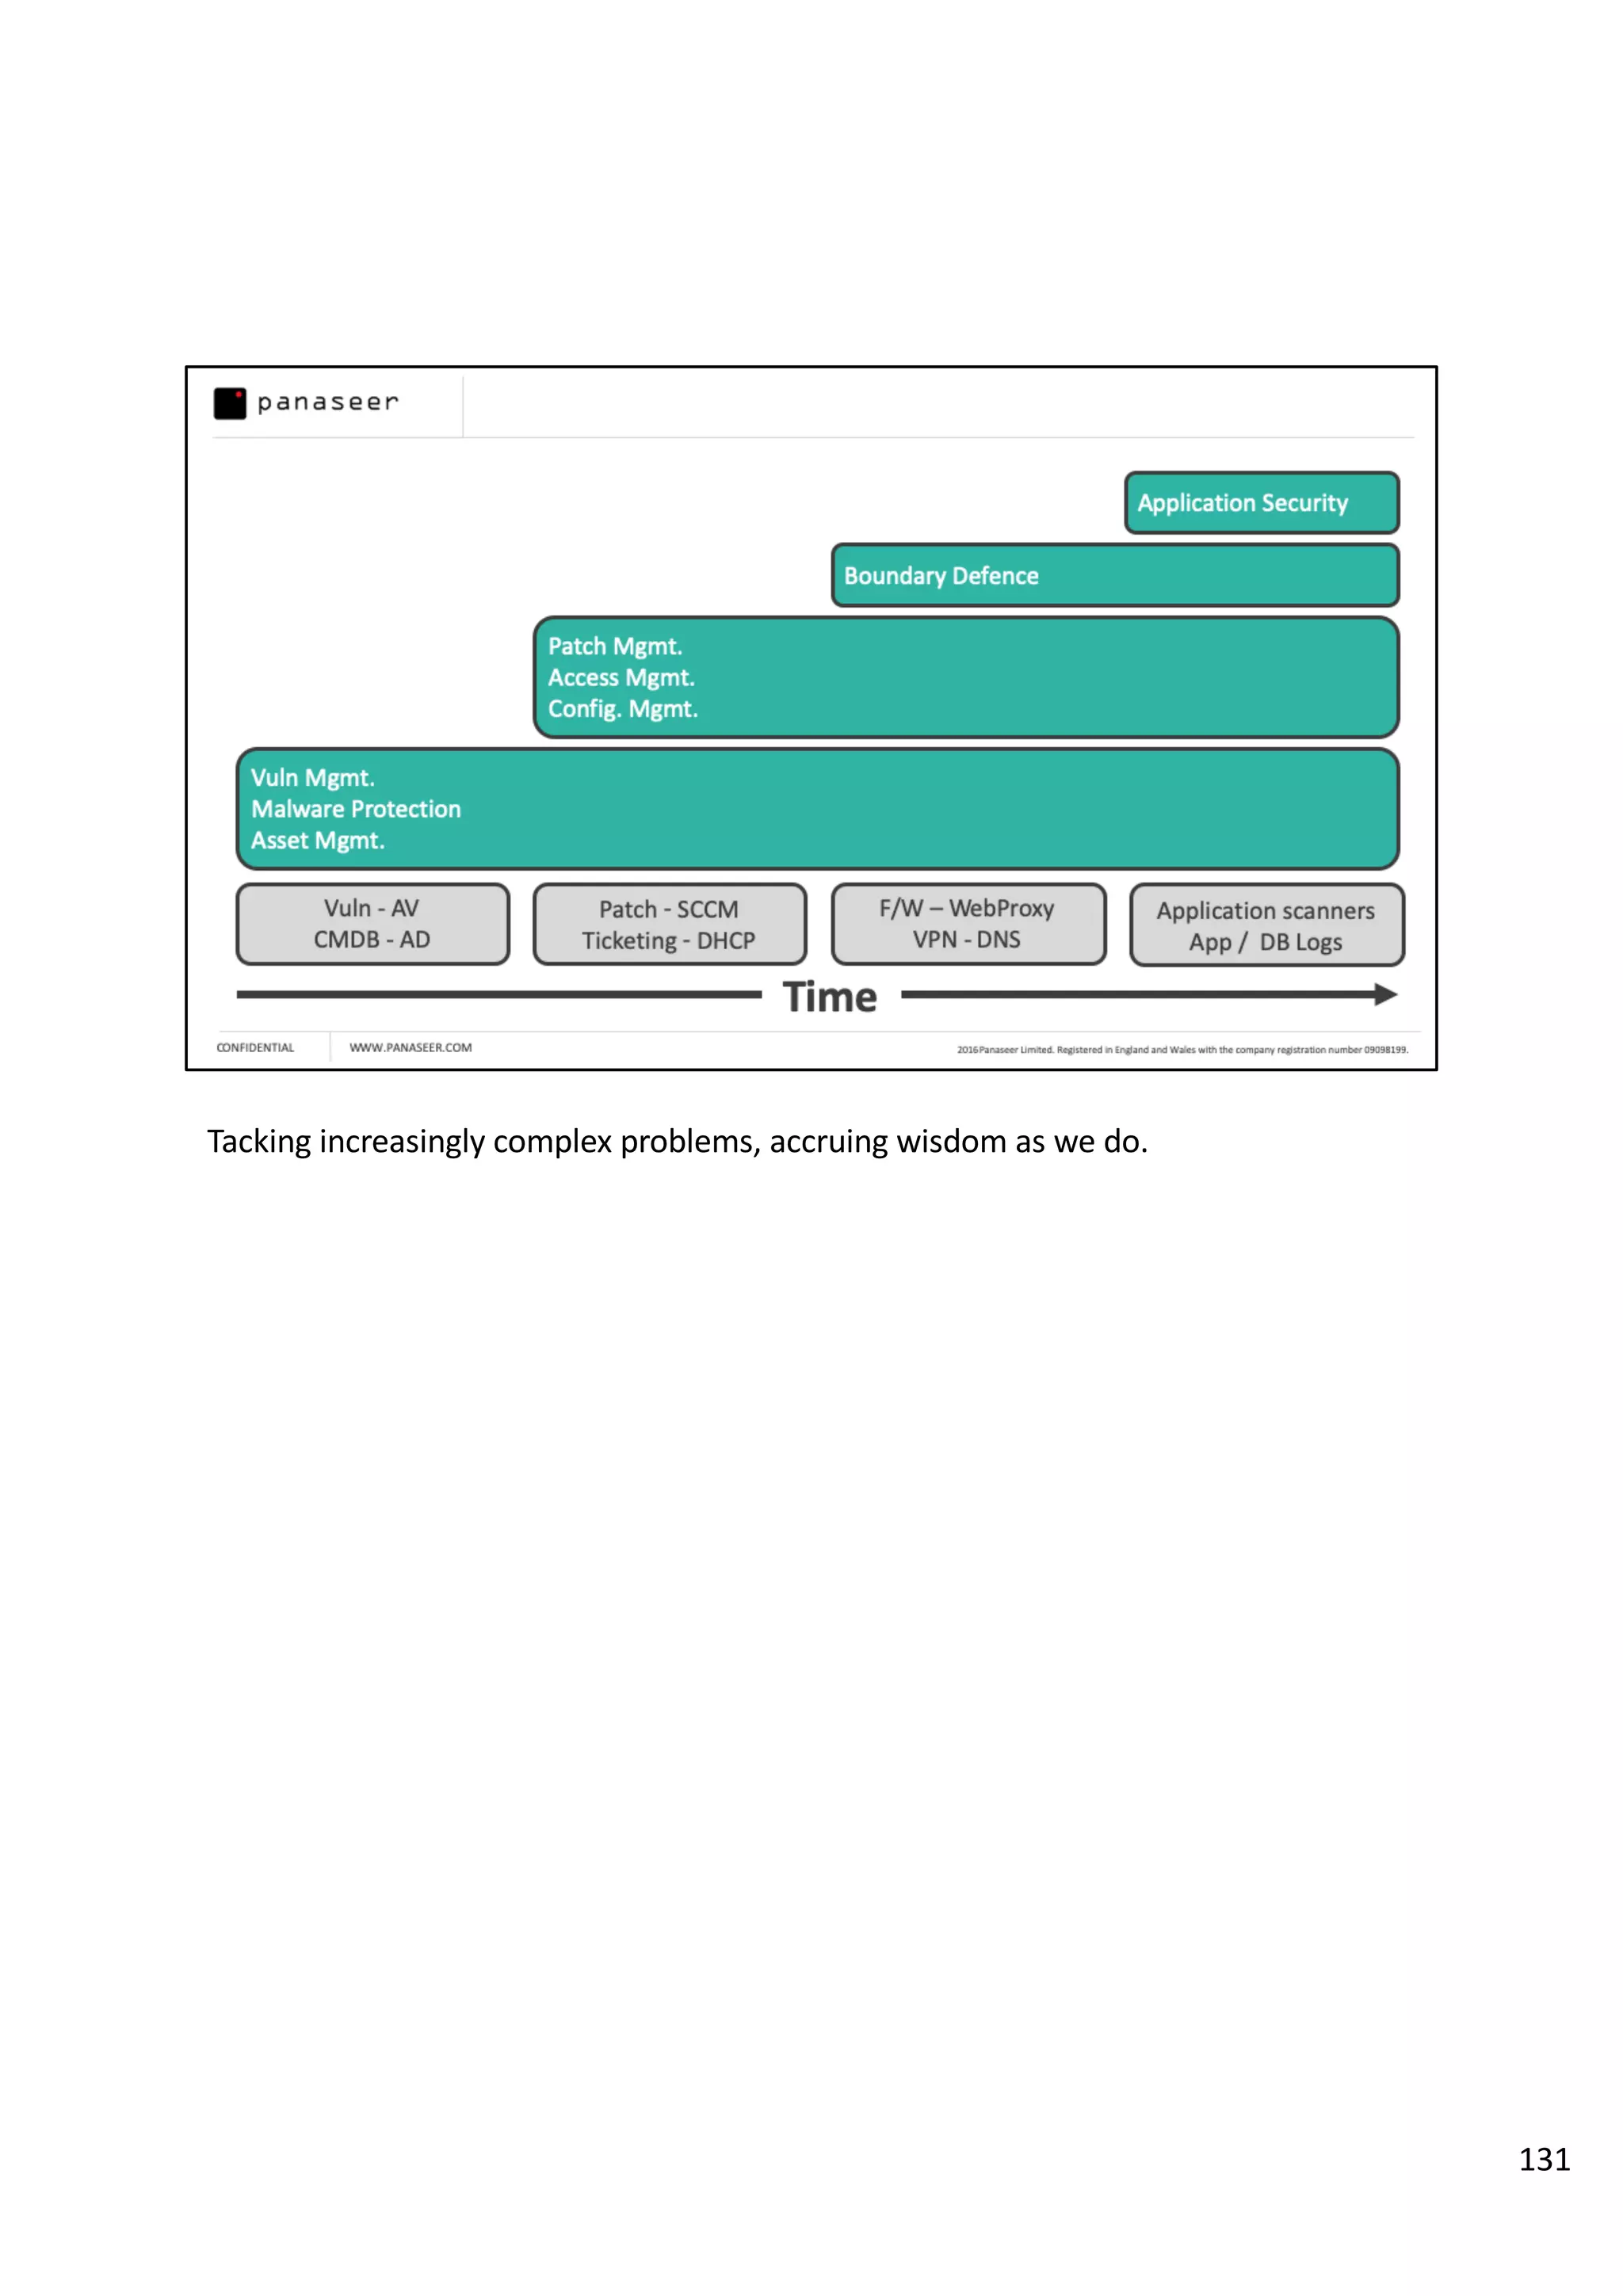
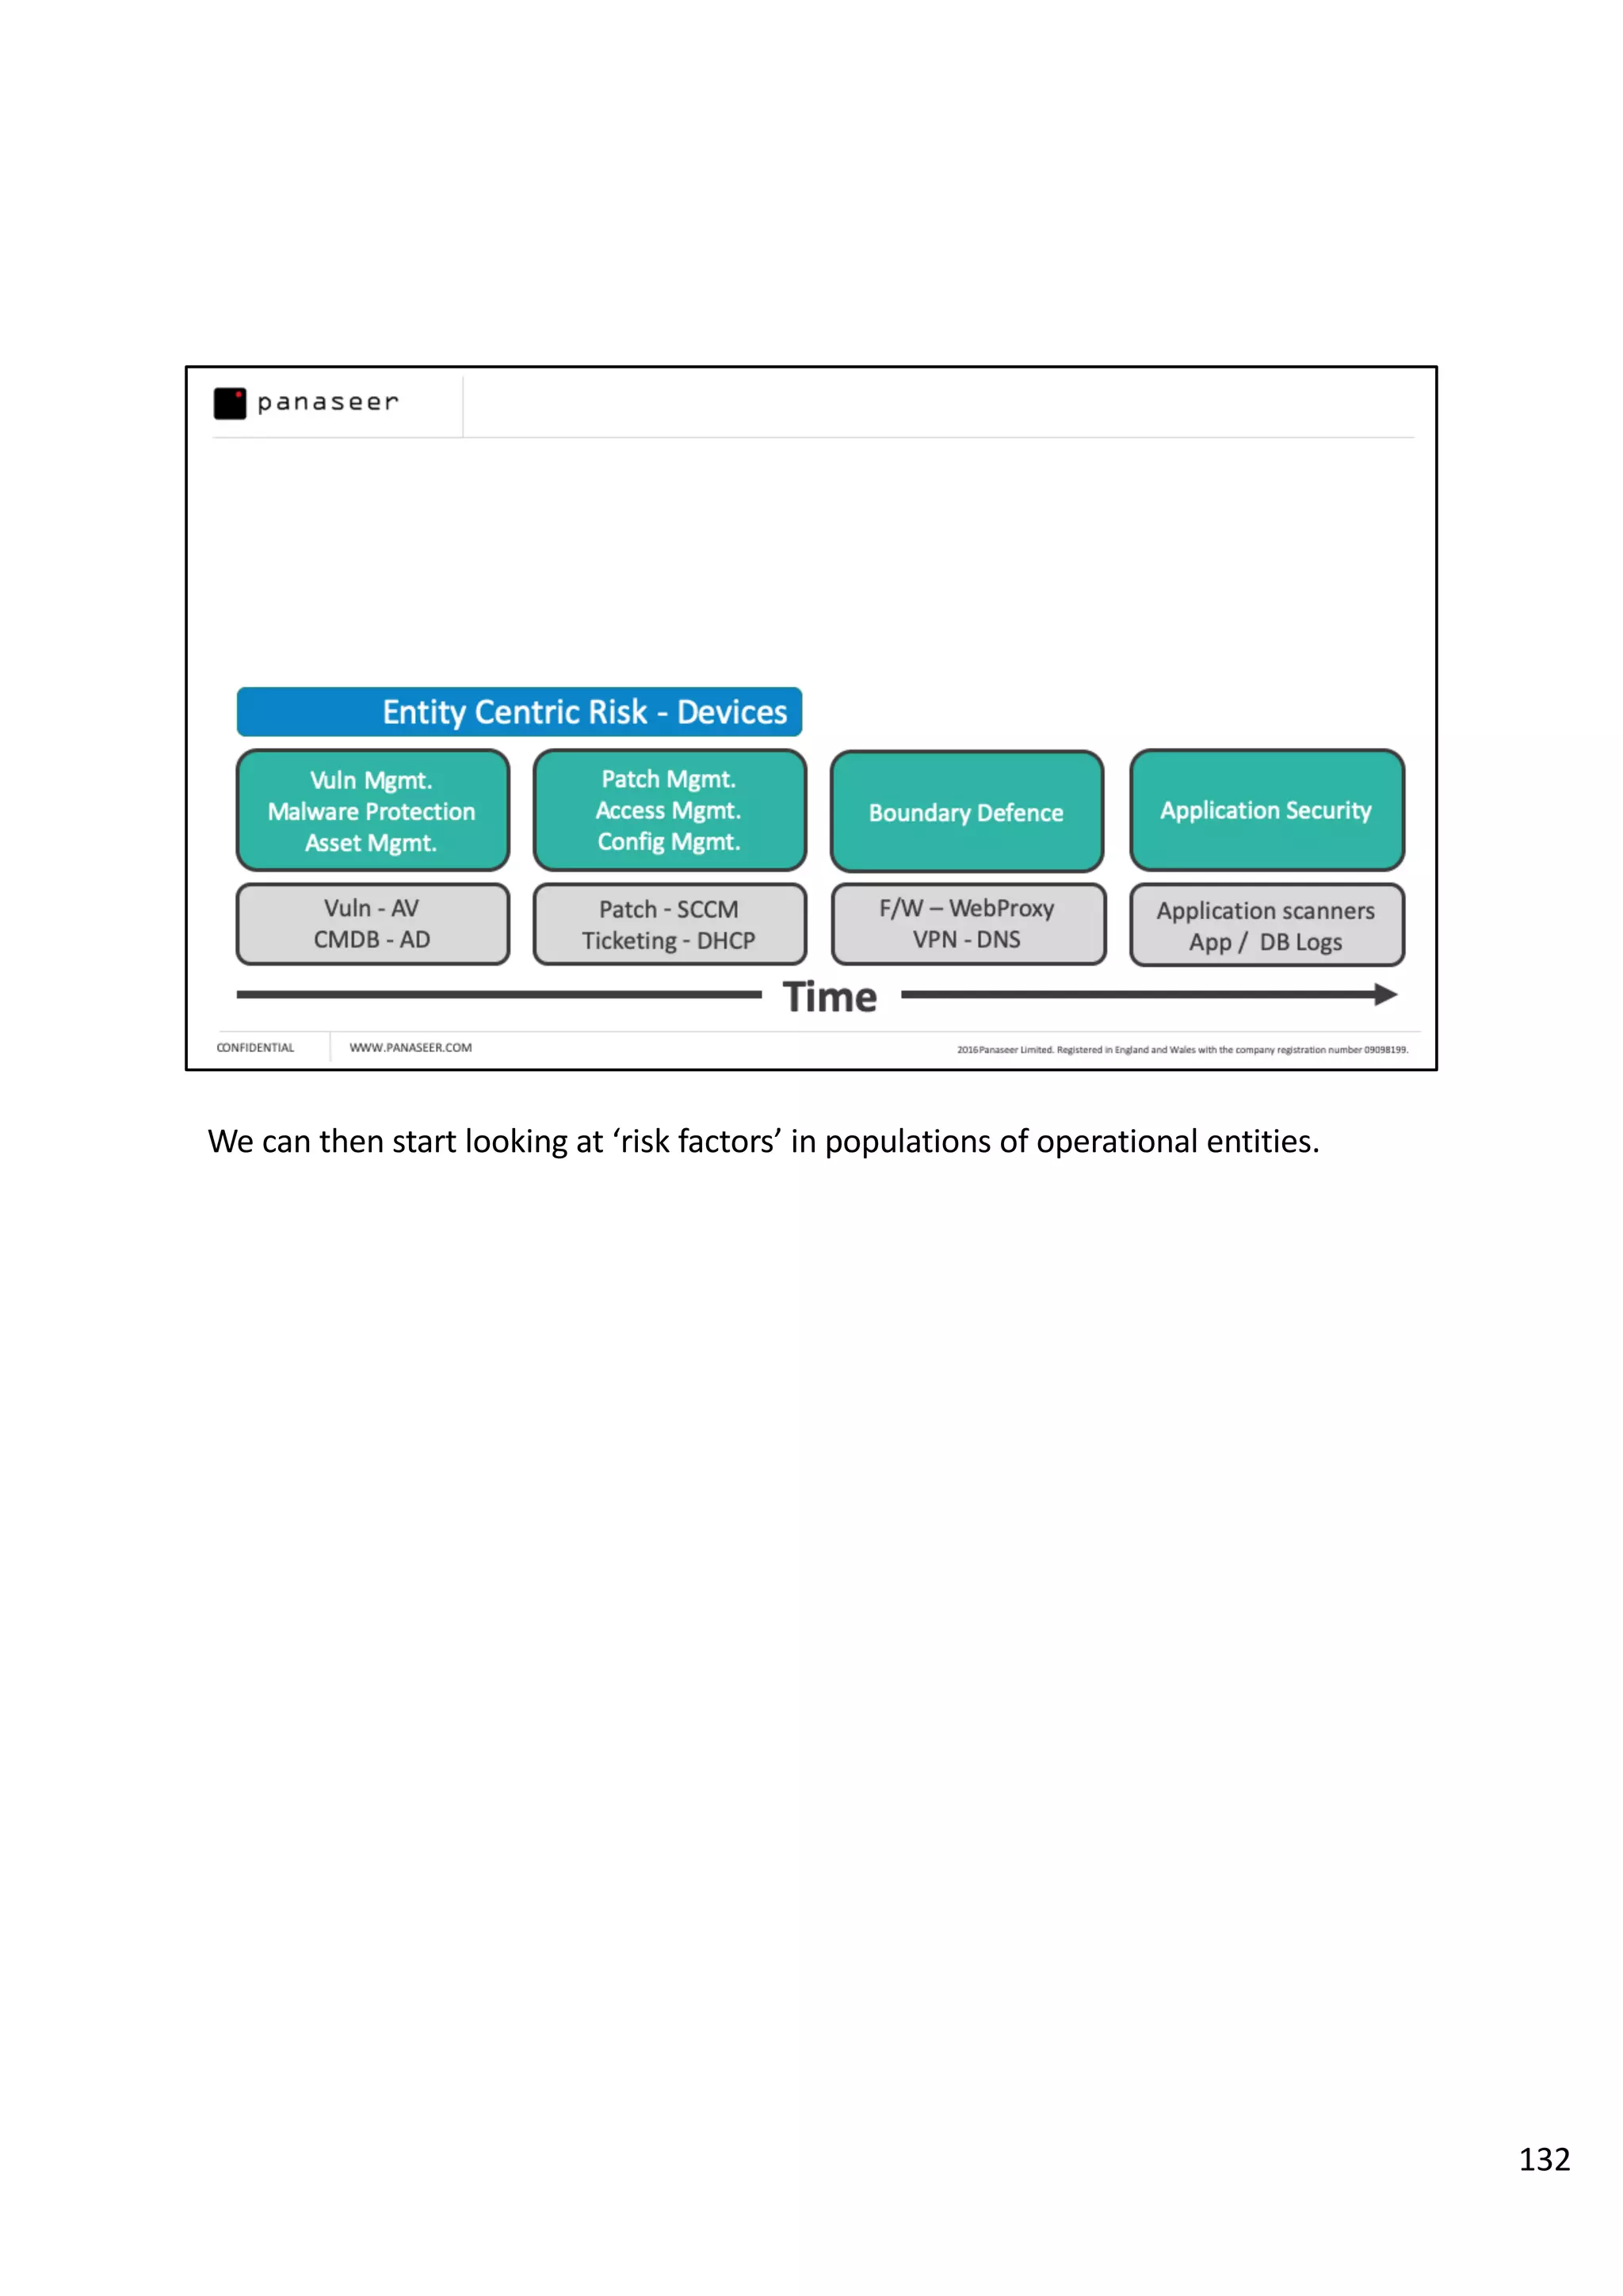
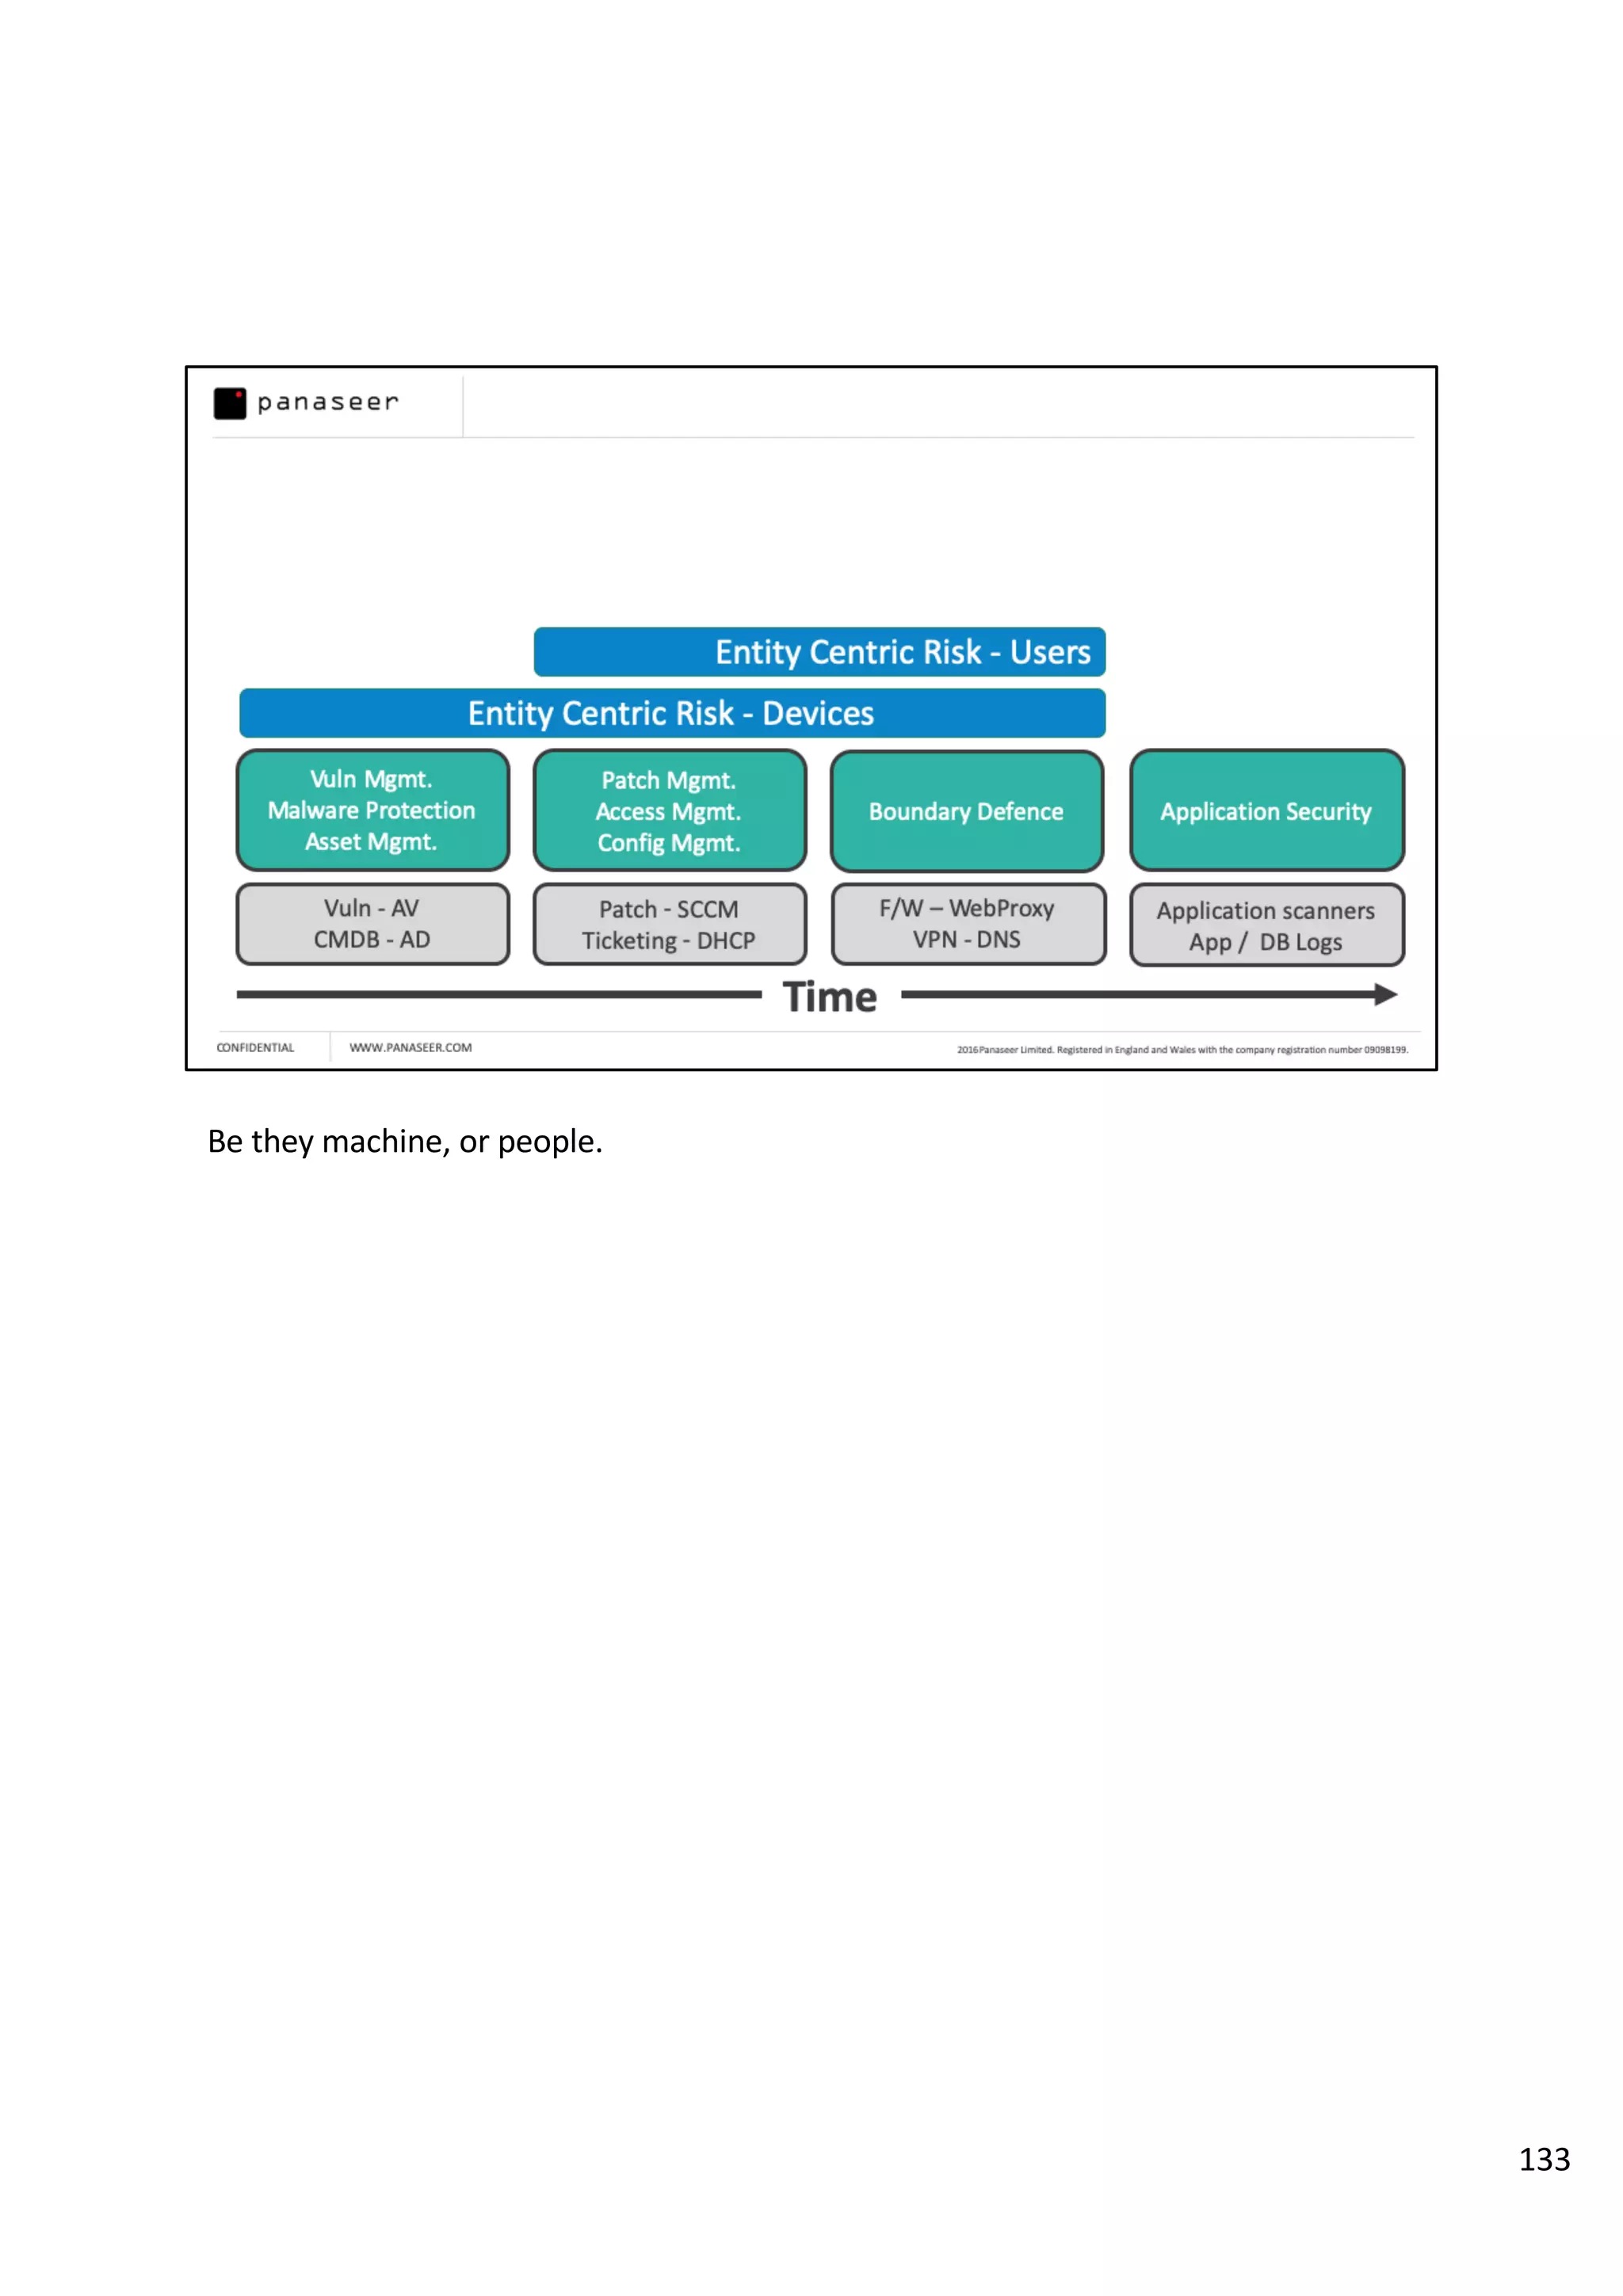
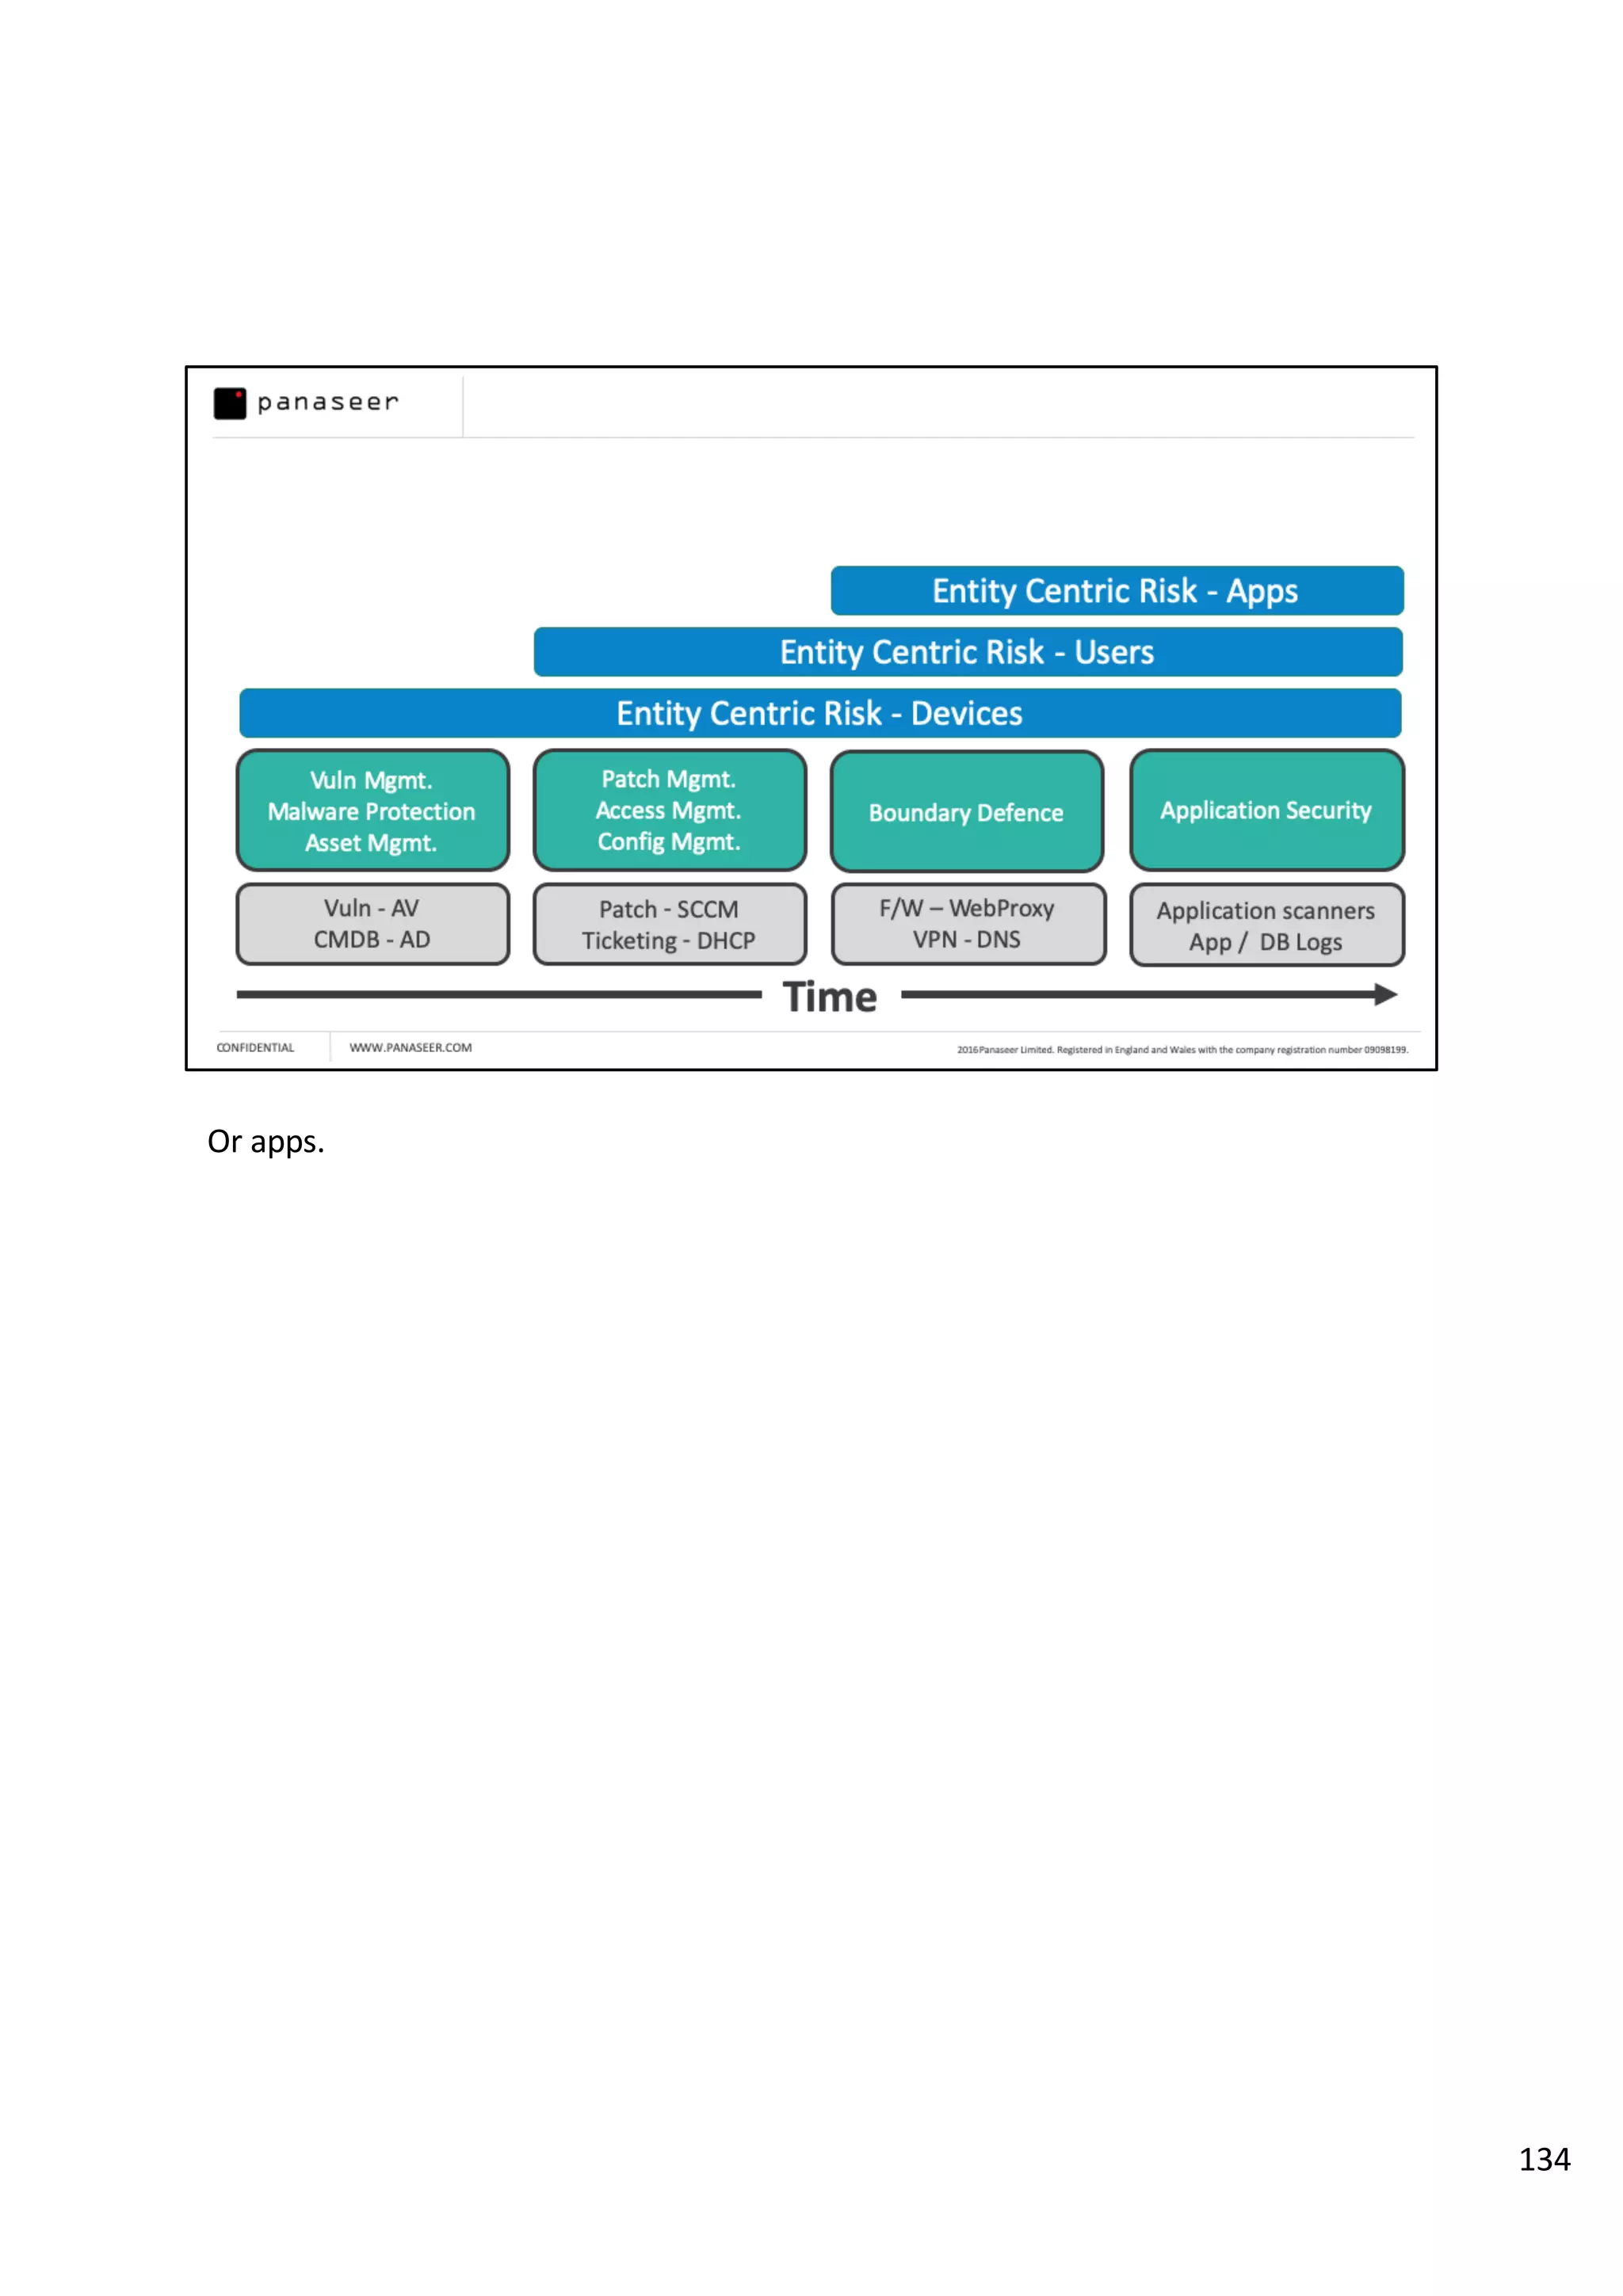
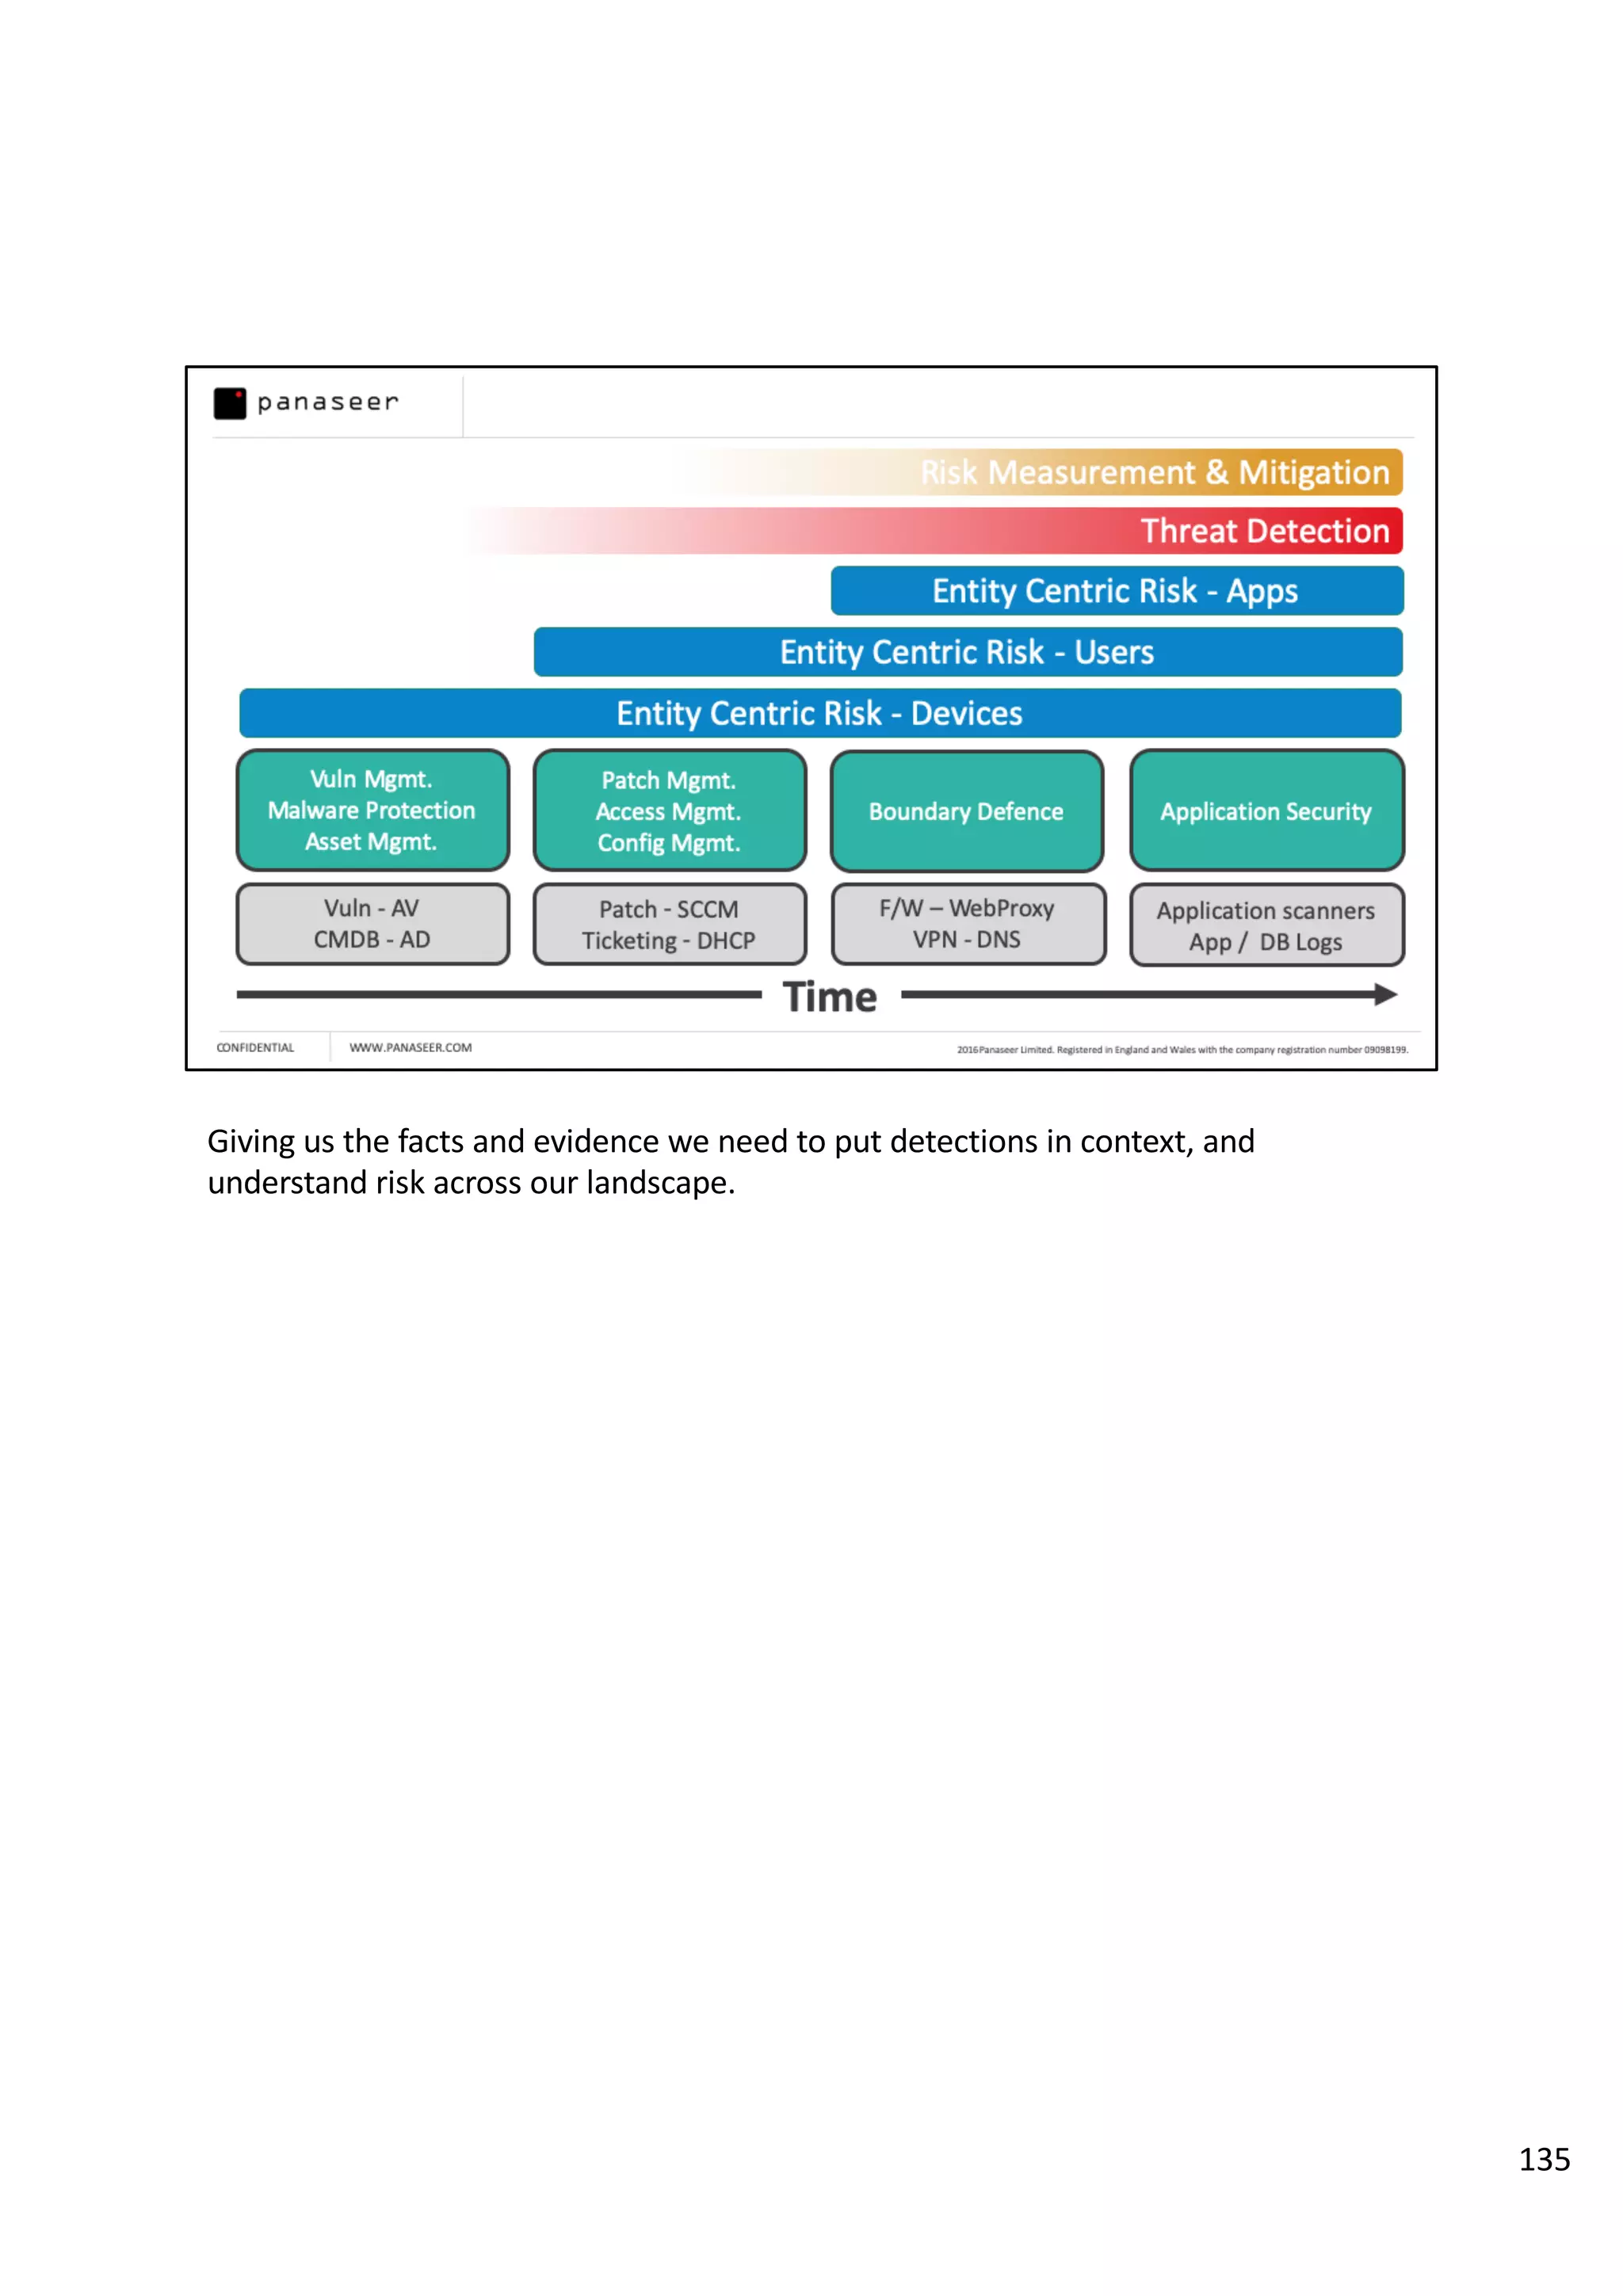
A snag list for 'things that can go wrong' with big data analytics initiatives in security, and ways to think about the problem space to avoid that happening.
Giving Organisations new capabilities to ask the right business questions 1.7OReillyStrata
This presentation takes the seminal work structured analytic techniques work pioneered within US intelligence, and proposes adaptions and simplifications for use within commercial enterprises
Achieving Proactive Spend Management Capabilities (Zycus White Paper)Jon Hansen
Achieving Proactive Spend Management Capabilities Through Adaptive Intelligence In Real-Time (Zycus White Paper)
To learn more about Zycus, e-mail information@zycus.com or visit www.zycus.com
Challenges are consistent in Big Data environments; resource-intensive processes, unwieldy time commitments, and challenging variations in infrastructure. Big Data has grown so large that traditional data analysis and management solutions are too slow, too small and too expensive to handle it. Many companies are in the discovery stage of evaluating the best means of extracting value from it. This Enterprise Tech Journal interview with Kevin Goulet, VP Product Management, CA Technologies, explores the challenges of Big Data, the approach to resolving them. With Big Data environments, the challenges are consistent – resource-intensive processes, unwieldy time commitments, and challenging variations in infrastructure. For more information visit http://www.ca.com/us/products/detail/business-intelligence-and-big-data-management.aspx?mrm=425887
How More Industries Can Cultivate A Culture of Operational ResilienceDana Gardner
A transcript of a discussion on the many ways that businesses can reach a high level of assured business availability despite varied and persistent threats.
Big Data initiatives should focus on outcomes first.
The value of Big Data is the potential change in outcomes. Companies should first evaluate which areas of their business and decision making are receptive to change.
Receptiveness to change dictated or directed by models, black box algorithms needs to be accepted by managers, execution staff (i.e. call these prospects and discuss x becuase the model says so).
This is a cultural change, a mind set change and a governance change. Advanced modeling must also bear the responsibility of scenario testing and multiple outcome hypothesis and simulation testing.
Selling people on the idea that analytics can be a catalyst for creative freedom isn't easy. We have been doing analytics in the "creative" environment of a communications agency for a while and whenever analytics and creative are thrown in the mix together the natural instinct is a right brain, left brain power struggle. Happily, we have found ways for analytics to help partner with the creative teams and the sparks created are usually bigger and richer ideas.
Architecting a Data Platform For Enterprise Use (Strata NY 2018)mark madsen
Building a data lake involves more than installing Hadoop or putting data into AWS. The goal in most organizations is to build multi-use data infrastructure that is not subject to past constraints. This tutorial covers design assumptions, design principles, and how to approach the architecture and planning for multi-use data infrastructure in IT.
Long:
The goal in most organizations is to build multi-use data infrastructure that is not subject to past constraints. This session will discuss hidden design assumptions, review design principles to apply when building multi-use data infrastructure, and provide a reference architecture to use as you work to unify your analytics infrastructure.
The focus in our market has been on acquiring technology, and that ignores the more important part: the larger IT landscape within which this technology lives and the data architecture that lies at its core. If one expects longevity from a platform then it should be a designed rather than accidental architecture.
Architecture is more than just software. It starts from use and includes the data, technology, methods of building and maintaining, and organization of people. What are the design principles that lead to good design and a functional data architecture? What are the assumptions that limit older approaches? How can one integrate with, migrate from or modernize an existing data environment? How will this affect an organization's data management practices? This tutorial will help you answer these questions.
Topics covered:
* A brief history of data infrastructure and past design assumptions
* Categories of data and data use in organizations
* Data architecture
* Functional architecture
* Technology planning assumptions and guidance
Think big data, and think opportunity. That is, think beyond storing and managing data, and leverage analytics to derive more value than imaginable from your business intelligence. This white paper offers a forward thinking, collaborative approach to analyzing data and changing the way you think about business.
The Black Box: Interpretability, Reproducibility, and Data Managementmark madsen
The growing complexity of data science leads to black box solutions that few people in an organization understand. You often hear about the difficulty of interpretability—explaining how an analytic model works—and that you need it to deploy models. But people use many black boxes without understanding them…if they’re reliable. It’s when the black box becomes unreliable that people lose trust.
Mistrust is more likely to be created by the lack of reliability, and the lack of reliability is often the result of misunderstanding essential elements of analytics infrastructure and practice. The concept of reproducibility—the ability to get the same results given the same information—extends your view to include the environment and the data used to build and execute models.
Mark Madsen examines reproducibility and the areas that underlie production analytics and explores the most frequently ignored and yet most essential capability, data management. The industry needs to consider its practices so that systems are more transparent and reliable, improving trust and increasing the likelihood that your analytic solutions will succeed.
This talk will treat the black boxed of ML the way management perceives them, as black boxes.
There is much work on explainable models, interpretability, etc. that are important to the task of reproducibility. Much of that is relevant to the practitioner, but the practitioner can become too focused on the part they are most familiar with and focused on. Reproducing the results needs more.
Infochimps Survey: What IT Teams Want CIOs to Know About Big Data - Learn the top items that IT team members would like their CIOs to understand concerning their Big Data projects.
The report - CIOs & Big Data: What Your IT Team Wants You to Know - is based on a survey of more than 300 IT department employees, 58% of whom are currently engaged in Big Data projects, and aims to identify pitfalls that implementation teams encounter, and could avoid, if top management had a more complete view.
Drinking from the Fire Hose: Practical Approaches to Big Data Preparation and...Inside Analysis
The Briefing Room with Robin Bloor and Pervasive Software
Slides from the Live Webcast on May 1, 2012
The old methods of delivering data for analysts and other business users will simply not scale to meet new demands. Hadoop is rapidly emerging as a powerful and economic platform for storing and processing Big Data. And yet, the biggest obstacle to implementing Hadoop solutions is the scarcity of Hadoop programming skills.
Check out this episode of The Briefing Room to learn from veteran Analyst Robin Bloor, who will explain why modern information architectures must embrace the new, massively parallel world of computing as it relates to several enterprise roles: traditional business analysts, data scientists, and line-of-business workers. He'll be briefed by David Inbar and Jim Falgout of Pervasive Software, who will explain how Pervasive RushAnalyzer™ was designed to accommodate the new reality of Big Data.
For more information visit: http://www.insideanalysis.com
Watch us on YouTube: http://www.youtube.com/playlist?list=PL5EE76E2EEEC8CF9E
spocto's unique machine learning algorithms & artificial learning which provides solution to create persona.
spocto analytics has improved the Contact Rate, Debt Collections and Non Performing Asset Management for a leading Bank in India
How HTC Centralizes Storage Management to Gain Visibility, Reduce Costs and I...Dana Gardner
Transcript of a Briefings Direct podcast on why bringing a common management view in to play improves problem resolution and automates resource allocation more fully.
Architecting a Platform for Enterprise Use - Strata London 2018mark madsen
The goal in most organizations is to build multi-use data infrastructure that is not subject to past constraints. This session will discuss hidden design assumptions, review design principles to apply when building multi-use data infrastructure, and provide a reference architecture to use as you work to unify your analytics infrastructure.
The focus in our market has been on acquiring technology, and that ignores the more important part: the larger IT landscape within which this technology lives and the data architecture that lies at its core. If one expects longevity from a platform then it should be a designed rather than accidental architecture.
Architecture is more than just software. It starts from use and includes the data, technology, methods of building and maintaining, and organization of people. What are the design principles that lead to good design and a functional data architecture? What are the assumptions that limit older approaches? How can one integrate with, migrate from or modernize an existing data environment? How will this affect an organization's data management practices? This tutorial will help you answer these questions.
Topics covered:
* A brief history of data infrastructure and past design assumptions
* Categories of data and data use in organizations
* Analytic workload characteristics and constraints
* Data architecture
* Functional architecture
* Tradeoffs between different classes of technology
* Technology planning assumptions and guidance
#strataconf
Presentation of IBM Watson, the components of Watson, how it works and examples of where Watson is being put to use, today. Finally links and information about, how you can get to work with Watson as a software developer.
Presentation given in te conference 'Driving IT' in Copenhagen, November 14, 2014
How HudsonAlpha Innovates on IT for Research-Driven Education, Genomic Medici...Dana Gardner
Transcript of a discussion on how HudsonAlpha leverages modern IT infrastructure and big data analytics to power research projects as well as pioneering genomic medicine findings.
Loyalty Management Innovator AIMIA's Transformation Journey to Modernized and...Dana Gardner
Transcript of a discussion on how improving end-user experiences and using big data analytics helps head off digital disruption and improve core operations.
Data analytics for the mid-market: myth vs. realityDeloitte Canada
Every mid-market company has data. Data that offers insight to help solve the business issues that matter most.
So why have so few mid-market companies taken the first step? Lack of comfort? Unclear outcomes? Not sure where to start? Analytics helps mid-market companies make smarter business decisions leading to increased productivity, profitability and competitiveness.
Dispel the myths. Recognize the possibilities. Squeeze more out of your data.
The pioneers in the big data space have battle scars and have learnt many of the lessons in this report the hard way. But if you are a general manger & just embarking on the big data journey, you should now have what they call the 'second mover advantage’. My hope is that this report helps you better leverage your second mover advantage. The goal here is to shed some light on the people & process issues in building a central big data analytics function
Building an enterprise security knowledge graph to fuel better decisions, fas...Jon Hawes
A talk from BSides Las Vegas 2019, offering a field guide for how security teams can move from thinking in lists, to both thinking and operating in graphs.
Third presentation in our seminar on business intelligence dashboards. Derek Murphy works for National Grid and related learning points from over 30 years experience of delivering business intelligence projects
Presentation also available on YouTube https://www.youtube.com/watch?v=Er90qIA2S7U
To be sure you can succesfully use the Agile methodology on your next software development project, simply ask yourself these four important questions.
[DSC Europe 22] Next-Wave of Value – Operating Model for Scaling Data Science...DataScienceConferenc1
The generation of value using machine learning and artificial intelligence for companies and their customers is now undeniable. Many companies have successfully completed the first phase of data-driven transformation and are now facing the task of creating sustainable value for the organization through scaling. With the advance of hyperscalers, automation and democratization of AI, many skills that were previously relevant and difficult to access are becoming “commodities”. The interaction between the data scientists and business departments is becoming even more important. The central question of many companies is now: "What should the organization for efficient scaling of data-driven solutions look like in the future?" In this talk, the question will be considered from an organizational and technological point of view using "Lessons Learned" with the aim of outlining the essential foundations for a sustainable operating model.
The Analytics Stack Guidebook (Holistics)Truong Bomi
Chapter 1: High-level Overview of an Analytics Setup
Chapter 2: Centralizing Data
Chapter 3: Data Modeling for Analytics
Chapter 4: Using Data
+++
Trích lời Huy - tác giả cuốn sách, co-founder & CTO của Holistics
+++
"Làm thế nào để thiết kế hệ thống BI stack phù hợp cho công ty mình?"
Có bao giờ bạn được công ty giao nhiệm vụ set up hệ thống BI/analytics stack cho công ty, rồi đến khi lên mạng google thì tá hoả vì mỗi bài viết, mỗi người bạn khác nhau lại khuyên bạn nên sử dụng một bộ công cụ/công nghệ khác nhau? ETL hay ELT, Hadoop hay BigQuery, Data Warehouse hay Data Lake, ...
Rồi bạn thắc mắc: Thiết kế một hệ thống analytics stack như thế nào là phù hợp với nhu cầu hiện tại của công ty mình? Làm thế nào để bắt đầu nhanh nhưng vẫn có thể scale được (mà không phải đập đi xây lại) khi nhu cầu dữ liệu tăng cao?
Thay vì chín người mười ý, bạn ước giá mà có 1 tấm bản đồ (map) có thể giúp bạn định vị được trong thế giới BI/analytics phức tạp này. Một tấm bản đồ cho bạn thấy các thành phần khác nhau của mỗi hệ thống BI là gì, lắp ráp nó lại như thế nào, và tradeoff giữa các cách tiếp cận khác nhau là sao.
Well, sau 2 tháng trời cực khổ thì team mình đã vẽ ra tấm bản đồ đó trong hình dạng một.. cuốn sách:
"The Analytics Setup Guidebook: How to build scalable analytics & BI stacks in modern cloud era."
Cuốn sách là một crash-course để bạn có thể trở thành một "part-time data architect", giúp bạn hiểu được rõ hơn về landscape analytics phức tạp hiện nay.
Sách giải thích high-level overview của một hệ thống analytics ntn, các thành phần tương tác với nhau ra sao, và đi sâu vào đủ chi tiết của những thành phần cũng như best practices cuả nó.
Cuốn sách được viết dành cho các bạn hơi technical được nhận nhiệm vụ phụ trách hệ thống analytics của công ty mình. Bạn có thể là một data analyst đang làm BI, software engineer được kêu qua hỗ trợ làm data engineering, hoặc đơn giản là 1 Product Manager đang thắc mắc sao quy trình data công ty mình chậm quá...
Cuốn sách cũng có những phần chia sẻ nâng cao như Data Modeling, BI evolution phù hợp với các bạn đã có kinh nghiệm làm BI lâu đời.
DevOps and Testing slides at DASA ConnectKari Kakkonen
My and Rik Marselis slides at 30.5.2024 DASA Connect conference. We discuss about what is testing, then what is agile testing and finally what is Testing in DevOps. Finally we had lovely workshop with the participants trying to find out different ways to think about quality and testing in different parts of the DevOps infinity loop.
Epistemic Interaction - tuning interfaces to provide information for AI supportAlan Dix
Paper presented at SYNERGY workshop at AVI 2024, Genoa, Italy. 3rd June 2024
https://alandix.com/academic/papers/synergy2024-epistemic/
As machine learning integrates deeper into human-computer interactions, the concept of epistemic interaction emerges, aiming to refine these interactions to enhance system adaptability. This approach encourages minor, intentional adjustments in user behaviour to enrich the data available for system learning. This paper introduces epistemic interaction within the context of human-system communication, illustrating how deliberate interaction design can improve system understanding and adaptation. Through concrete examples, we demonstrate the potential of epistemic interaction to significantly advance human-computer interaction by leveraging intuitive human communication strategies to inform system design and functionality, offering a novel pathway for enriching user-system engagements.
Communications Mining Series - Zero to Hero - Session 1DianaGray10
This session provides introduction to UiPath Communication Mining, importance and platform overview. You will acquire a good understand of the phases in Communication Mining as we go over the platform with you. Topics covered:
• Communication Mining Overview
• Why is it important?
• How can it help today’s business and the benefits
• Phases in Communication Mining
• Demo on Platform overview
• Q/A
Why You Should Replace Windows 11 with Nitrux Linux 3.5.0 for enhanced perfor...SOFTTECHHUB
The choice of an operating system plays a pivotal role in shaping our computing experience. For decades, Microsoft's Windows has dominated the market, offering a familiar and widely adopted platform for personal and professional use. However, as technological advancements continue to push the boundaries of innovation, alternative operating systems have emerged, challenging the status quo and offering users a fresh perspective on computing.
One such alternative that has garnered significant attention and acclaim is Nitrux Linux 3.5.0, a sleek, powerful, and user-friendly Linux distribution that promises to redefine the way we interact with our devices. With its focus on performance, security, and customization, Nitrux Linux presents a compelling case for those seeking to break free from the constraints of proprietary software and embrace the freedom and flexibility of open-source computing.
How to Get CNIC Information System with Paksim Ga.pptxdanishmna97
Pakdata Cf is a groundbreaking system designed to streamline and facilitate access to CNIC information. This innovative platform leverages advanced technology to provide users with efficient and secure access to their CNIC details.
The Art of the Pitch: WordPress Relationships and SalesLaura Byrne
Clients don’t know what they don’t know. What web solutions are right for them? How does WordPress come into the picture? How do you make sure you understand scope and timeline? What do you do if sometime changes?
All these questions and more will be explored as we talk about matching clients’ needs with what your agency offers without pulling teeth or pulling your hair out. Practical tips, and strategies for successful relationship building that leads to closing the deal.
Sudheer Mechineni, Head of Application Frameworks, Standard Chartered Bank
Discover how Standard Chartered Bank harnessed the power of Neo4j to transform complex data access challenges into a dynamic, scalable graph database solution. This keynote will cover their journey from initial adoption to deploying a fully automated, enterprise-grade causal cluster, highlighting key strategies for modelling organisational changes and ensuring robust disaster recovery. Learn how these innovations have not only enhanced Standard Chartered Bank’s data infrastructure but also positioned them as pioneers in the banking sector’s adoption of graph technology.
A tale of scale & speed: How the US Navy is enabling software delivery from l...sonjaschweigert1
Rapid and secure feature delivery is a goal across every application team and every branch of the DoD. The Navy’s DevSecOps platform, Party Barge, has achieved:
- Reduction in onboarding time from 5 weeks to 1 day
- Improved developer experience and productivity through actionable findings and reduction of false positives
- Maintenance of superior security standards and inherent policy enforcement with Authorization to Operate (ATO)
Development teams can ship efficiently and ensure applications are cyber ready for Navy Authorizing Officials (AOs). In this webinar, Sigma Defense and Anchore will give attendees a look behind the scenes and demo secure pipeline automation and security artifacts that speed up application ATO and time to production.
We will cover:
- How to remove silos in DevSecOps
- How to build efficient development pipeline roles and component templates
- How to deliver security artifacts that matter for ATO’s (SBOMs, vulnerability reports, and policy evidence)
- How to streamline operations with automated policy checks on container images
Essentials of Automations: The Art of Triggers and Actions in FMESafe Software
In this second installment of our Essentials of Automations webinar series, we’ll explore the landscape of triggers and actions, guiding you through the nuances of authoring and adapting workspaces for seamless automations. Gain an understanding of the full spectrum of triggers and actions available in FME, empowering you to enhance your workspaces for efficient automation.
We’ll kick things off by showcasing the most commonly used event-based triggers, introducing you to various automation workflows like manual triggers, schedules, directory watchers, and more. Plus, see how these elements play out in real scenarios.
Whether you’re tweaking your current setup or building from the ground up, this session will arm you with the tools and insights needed to transform your FME usage into a powerhouse of productivity. Join us to discover effective strategies that simplify complex processes, enhancing your productivity and transforming your data management practices with FME. Let’s turn complexity into clarity and make your workspaces work wonders!
GraphSummit Singapore | The Future of Agility: Supercharging Digital Transfor...Neo4j
Leonard Jayamohan, Partner & Generative AI Lead, Deloitte
This keynote will reveal how Deloitte leverages Neo4j’s graph power for groundbreaking digital twin solutions, achieving a staggering 100x performance boost. Discover the essential role knowledge graphs play in successful generative AI implementations. Plus, get an exclusive look at an innovative Neo4j + Generative AI solution Deloitte is developing in-house.
GraphSummit Singapore | The Art of the Possible with Graph - Q2 2024Neo4j
Neha Bajwa, Vice President of Product Marketing, Neo4j
Join us as we explore breakthrough innovations enabled by interconnected data and AI. Discover firsthand how organizations use relationships in data to uncover contextual insights and solve our most pressing challenges – from optimizing supply chains, detecting fraud, and improving customer experiences to accelerating drug discoveries.
Enchancing adoption of Open Source Libraries. A case study on Albumentations.AIVladimir Iglovikov, Ph.D.
Presented by Vladimir Iglovikov:
- https://www.linkedin.com/in/iglovikov/
- https://x.com/viglovikov
- https://www.instagram.com/ternaus/
This presentation delves into the journey of Albumentations.ai, a highly successful open-source library for data augmentation.
Created out of a necessity for superior performance in Kaggle competitions, Albumentations has grown to become a widely used tool among data scientists and machine learning practitioners.
This case study covers various aspects, including:
People: The contributors and community that have supported Albumentations.
Metrics: The success indicators such as downloads, daily active users, GitHub stars, and financial contributions.
Challenges: The hurdles in monetizing open-source projects and measuring user engagement.
Development Practices: Best practices for creating, maintaining, and scaling open-source libraries, including code hygiene, CI/CD, and fast iteration.
Community Building: Strategies for making adoption easy, iterating quickly, and fostering a vibrant, engaged community.
Marketing: Both online and offline marketing tactics, focusing on real, impactful interactions and collaborations.
Mental Health: Maintaining balance and not feeling pressured by user demands.
Key insights include the importance of automation, making the adoption process seamless, and leveraging offline interactions for marketing. The presentation also emphasizes the need for continuous small improvements and building a friendly, inclusive community that contributes to the project's growth.
Vladimir Iglovikov brings his extensive experience as a Kaggle Grandmaster, ex-Staff ML Engineer at Lyft, sharing valuable lessons and practical advice for anyone looking to enhance the adoption of their open-source projects.
Explore more about Albumentations and join the community at:
GitHub: https://github.com/albumentations-team/albumentations
Website: https://albumentations.ai/
LinkedIn: https://www.linkedin.com/company/100504475
Twitter: https://x.com/albumentations
GraphRAG is All You need? LLM & Knowledge GraphGuy Korland
Guy Korland, CEO and Co-founder of FalkorDB, will review two articles on the integration of language models with knowledge graphs.
1. Unifying Large Language Models and Knowledge Graphs: A Roadmap.
https://arxiv.org/abs/2306.08302
2. Microsoft Research's GraphRAG paper and a review paper on various uses of knowledge graphs:
https://www.microsoft.com/en-us/research/blog/graphrag-unlocking-llm-discovery-on-narrative-private-data/
Unlocking Productivity: Leveraging the Potential of Copilot in Microsoft 365, a presentation by Christoforos Vlachos, Senior Solutions Manager – Modern Workplace, Uni Systems
2. What does a strategy for data analytics looks like, which can win in the often chaotic
reality of the business environment?
2
3. While I can’t promise this talk will provide a definitive answer, hopefully it will offer
some answers, and if not, at least some inspiration about what to think about, and a
snag list of things to avoid.
3
4. Security leaders and executives globally face 3 challenging questions:
1. What’s our business risk exposure from cyber?
2. What’s our security capability to manage that risk?
3. And based on the above, what do we prioritize?
4
5. By applying data analytics to security, we can provide the meaningful, timely, accurate
insights that security leadership need to do 2 things:
1) Support their colleagues in other teams, so they have the information to make
robust, defensible risk decisions; and
2) Gain the evidence we need to justify improvement where it matters most –
hopefully at best cost
5
6. That’s easy to say, but harder to do.
Because data analytics is a multi-dimensional problem space with a lot of moving
parts.
At the data layer, we have technologies that provide the output we need for analytics.
But even for one type of technology like anti-virus, we may have multiple vendors in
place, outputting data in different structures, with various coverage. They can also be
swapped out from one year to the next.
At the platform layer, how do we marshal our data so that we can deliver the
analytics that meet user need?
At the analysis layer, what techniques are available to us, and how repeatable are
they (or can they be) for the scale and frequency of analysis we want to run?
At the insight layer, how can we manage the fact that one question answered often
leads to many harder questions emerging, with an expectation for faster turn-
around?
6
7. At the communication layer, how do we make insight relevant and accessible to our
multiple stakeholders, based on their decision making context and concerns? And
how do we make any caveats clear at the different levels of strategic, operational and
tactical?
And lastly, provability. How do we win trust when so much analysis that leaders have
seen is wrong?
6
8. Taking on multidimensional problems always has a high risk of resulting in a resume
generating event.
So if we know all this, we may be tempted not to try.
7
9. Because if we do try – and precisely because the problem is complex, we will likely
fail forward on the way to success.
8
10. To our investors, the teams funding our projects, this is what failure looks like.
- An increasing amount of spend
- Very little visible value
- Someone making a heroic effort to save the situation
- Then getting frustrated with the politics they run into
- And leaving
9
11. In many cases, this happens because security data analytics efforts are “Death Star
projects”.
They are built on a big visions (and equally big promises), which require large teams
to do stuff successfully they haven’t done before, with coordination of lots of moving
parts over a long period of time.
And sometimes these visions aim to tackle problems that we don’t know that we can
solve, or even that solves the most important problem we have.
10
12. This cartoon sums up a lot of ‘blue sky thinking’ threat detection projects, which
often turn into sunk costs that the business can’t bear to put an end to because of
the time and money they’ve ploughed into them.
11
13. With any Death Star project, careful thought is needed about the legacy that other
teams will have to pick up afterwards.
12
14. But the same is also true at the other end of the spectrum, where it’s easy to end up
spending a lot of money on ‘data science noodling’, which doesn’t provide
foundational building blocks that can be built upon.
We hire some data scientists, set them to work on some interesting things, but
eventually they end up helping us fight the latest fire (either in security operations or
answering this weeks knee jerk question from the Executive Committee), rather than
doing what we hired them for.
And while artisanal data analytics programs definitely have short term value they also
have 2 core problems: 1) they aren’t scalable; and 2) their legacy doesn’t create the
operational engine for future success.
13
15. Although the actual amounts can differ, both the Death Star and artisanal model can
lead to this situation.
And in security, this isn't an unusual curve.
For many executives it represents their experience across most of the security
projects they’ve seen.
14
16. So how do we bend the cost-to-value curve to our will?
Not only in terms of security data analytics programs themselves, but also in terms of
how security data analytics can bend the overall cost curve for security by delivering
the meaningful, timely, accurate information that leadership need.
15
17. Ultimately what we need to win in business, is to win in a game of ratios.
This means :
- minimizing the time where value is less than spend
- maximizing the amount of value delivered for spend; and
- making value very visible to the people who are funding us
16
18. The conclusion of today’s talk is that we can only achieve this in the following way:
1) Start with a focus on sets of problems, not single use cases – and select initial
problem sets that give us building blocks of data that combine further down the line
to solve higher order problems with greater ease.
17
19. 2) Take an approach to these problem sets that stacks Minimum Viable Products of
‘data plus analytics’ on top of each other.
18
20. And 3), approach problem sets in a sequence that sets us up to deliver greatest value
across multiple stakeholders with the fewest data sets possible.
19
21. In summary, this means that the battle ground we select for our data analytics
program needs to be here.
20
24. Let’s imagine we work at ACME Inc., and our data analytics journey so far looks like
this.
Years ago, we invested heavily in SIEM - and discovered that while it was great if you
had a small rule set and a narrow scope, it quickly became clear upon deployment
that this dream would be unattainable.
As we moved from ‘rules’ to ‘search’, we invested in Splunk, only to run into cost
problem that inhibited our ability to ingest high volume data sets.
To manage a few specific headaches, we purchased some point analytics solutions.
And then spun up our own Hadoop cluster, with the vision of feeding these other
technologies with only the data they needed from a data store that we could also use
to run more complex analytics.
23
25. In meta terms, we could describe our journey as an oscillation between specific and
general platforms …
24
26. … as we adapted to the changing scale, complexity and IT operating model of our
organisation.
25
27. Let’s zoom in our our latest project, and walk through some scenarios that we may
have experienced …
26
36. And we’re paid a visit by the CFO’s pet T-Rex.
What’s gone wrong?
35
37. Well, as the questions people asked us got harder over time, at some point our ability
to answer them ran into limits.
36
38. The first problem we had was the architecture of our data lake.
It’s centrally managed by IT, and it doesn't support the type of analysis we want to do.
Business units using the cluster care about one category of analytics problem, and
the components we need to answer our categories of analytics problems isn’t in IT’s
roadmap.
We put in a change request, but we’re always behind the business in the priority
queue – and change control is taking a long time to go through, as IT have to work
out if and how an upgrade to one component in the stack will affect all the others.
Meanwhile, the business is tapping it's fingers impatiently, which means as a stop gap
we're putting stuff in excel and analysis notebooks … which is exactly what we
wanted to avoid.
37
39. Fortunately we got that problem solved, but then we encountered another. Now that
we’re generating insights, we’re getting high demand for analysis from lots of
different people.
In essence, we’ve become a service. Everyone who has a question realizes we have a
toolset and team that can provide answers, and we’re get a huge influx of requests
that are pulling us away from our core mission.
Half our team are now working on an effort to understand application dependencies
for a major server migration IT is doing. We're effectively DDoSed by our success, and
have to service the person who can shout the loudest.
We need to wrap a lot of process round servicing incoming requests, but while we’re
trying to do that, prioritization has run amok.
38
40. To try and get a handle on this, we called in a consultancy, who’ve convinced us that
what we need to do is set up a self service library of recipes so people can answer
their own questions.
We’ve built an intuitive front end interface to Hadoop, but we've quickly discovered
that with the same recipe, two people with different levels of skill can make dishes
that taste and look very different.
Now we're in a battle to scale the right knowledge for different people on how to do
analysis to avoid insights being presented that are accurate.
39
41. We're also finding that, as we deal with more complex questions, what we thought
was insight is not proving that valuable to the people consuming it.
Our stakeholders don’t want statuses or facts; they wanted us to answer the question
‘What is my best action?’
While we’re used to producing stuff at tactical or operational level for well-defined
problems, they are looking for strategic direction.
40
44. But it’s taking a lot longer to get to insights than we thought it would.
43
45. We didn’t understand the amount of work involved to:
- understand data sets, clean them, and prepare them; then
- work out the best analysis for the problem at hand, do that analysis and
communicate the result in a way that's meaningful to the stakeholder receiving them
…
- all with appropriate caveats to communicate the precision and accuracy of the
information they’re looking at
44
46. We’re now having conversations like this. because someone has read a presentation
or bit of marketing that suggest sciencing data happens auto-magically by throwing it
at a pre-built algorithm.
45
47. Specifically in the context of machine learning, a lot of the marketing we're seeing on
this today is dangerous.
First, there's a blurring of vocabulary, which doesn’t differentiate the discipline of
data analytics and data science vs the methods that data science and data analytics
use.
So when marketing pushes stories of automagic results from data analytics (which is
used wrongly as a synonym for ML) – and that later turns out to be an illusion - the
good work being done suffers by association.
46
48. Second, it speaks to us on an emotional level, when we don’t have a good framework
to assess if these ‘solutions’ will do what they claim in our environments.
As the CISO of a global bank said to me a few weeks ago, it is tempting and
comforting to think, when we face all the problems we do with headcount, expertise
and budget that, yes, perhaps some unsupervised machine learning algo can solve
this thorny problem I have.
So we give it a try, and it makes our problems worse not better.
47
49. Now, this isn’t a new problem in security.
It’s summed up eloquently in a paper called ‘A Market For Silver Bullets’, which
describes the fundamental asymmetry of information we face, where both sellers and
buyers lack knowledge of what an effective solution looks like. (Of course, the threat
actors know, but unfortunately, they’re not telling us).
In the world of ML, algos lack the business context they need – and it’s the
enrichment of algos that make the difference between lots of anomalies that are
interesting, but not high value, vs output we can act on with confidence.
48
50. But often neither the vendor nor the buyer know exactly how to do that.
So what you end up with is ‘solutions’ that have user experiences like this.
Now, I don’t know if you know the application owners I know, but this is simply not
going to happen.
49
51. And it's definitely not going to happen if what vendors deliver is the equivalent of
‘false positive as a service’.
50
52. Because if the first 10 things you give to someone who is very busy with with
business concerns are false positives, that’s going to be pretty much game over in
getting their time and buy-in for the future.
In the same way, Security Operations teams are already being fire hosed with alerts.
This means the tap may as well not be on if this is yet another pipe where there isn’t
time to do the necessary tuning.
51
53. In short, with ML and it’s promises, we face a classic fruit salad problem.
Knowledge is knowing a tomato is a fruit. Wisdom is not putting it in a fruit salad.
And while lots of vendors provide ML learning algos that have knowledge, it’s refining
those so that they have wisdom in the context of our business that makes them
valuable. Until that is possible (and easy) we’ll continue to be disappointed by results.
52
55. Here, we’ve built lake and ingested data, but analysis has hit a wall.
54
56. We didn’t have mature process around data analytics in security when we started this
effort, and what we've done is simply scaled up the approach we were taking before.
This has created a data swamp, with loads of data pools that are poorly maintained.
55
57. We’re used to running a workflow in which an analyst runs to our tech frankenstack,
pulls any data they can on an ad hoc basis into a spreadsheet, runs some best effort
analysis, creates a pie chart, and sends off a PDF we hope no one will read.
56
61. We’ve decided to ingest everything before starting with analysis.
And because this costs money and takes a lot of time, the business is sat for a long
time tapping their fingers waiting for insight.
Eventually, they get sick of waiting and cut the budget before we have enough in the
lake to do meaningful correlations and get some analysis going. We may try to
present some conclusions, but they’re flimsy and unmoving.
60
63. In which we run into problems at the very first stage of building the lake.
We’ve been running a big data initiative for 6 months, and the business has come to
ask us how we were doing.
62
64. We said it would be done soon while wrestling with getting technology set up that
was stable and usable.
63
66. We said it would be done soon (while continuing to battle with the tech).
65
67. And then they decided they were done with a transformation program that was on a
trajectory to be anything but.
66
68. So, if these are the foreseeable problems to avoid …
67
69. … what does that mean as we consider our approach at strategic and operational
levels?
68
70. Let’s imagine at ACME, we understand all the problems we’ve just looked at, because
our team has lived through them in other firms.
And we want to take an MVP approach to solving a big problem, so that it has a good
chance of success.
69
71. The problem at the top of our agenda is how to deal with newly introduced DevOps
pipelines in several business units.
Our devs are creating code that’s ready to push into production in 2 weeks. Which is
great.
70
72. What’s not so great, is that security has a 3 month waterfall assurance process.
And at the end of this, multiple high risk findings are raised consistently.
71
73. So app dev asks the CIO for exceptions, which are now granted so frequently that
eventually security is pretty much ignored all together.
72
74. Because of the pain involved in going through this risk management process, the
status quo is fast becoming: let’s not go find and manage risk.
73
75. We need to change this, so we can shift the timeline for getting risk under
management from months to weeks.
We know data analytics is critical to this, both to a) get the information we need to
make good data informed decisions, then b) automate off the back of that to manage
risk at the speed of the business and be as data-driven as possible.
74
76. This means moving from a policy based approach, where only a tiny bit of code meets
all requirements ...
75
77. … to a risk based approach, where we can understand risk holistically, and manage it
pragmatically.
76
78. This means bringing together lots of puzzle pieces across security, ops and dev
processes.
77
79. And turning those puzzle pieces into a picture, to show risk as a factor of
connectedness, dependencies and activity across the operational entities that
support and delivery business outcomes.
78
80. Our plan to do this is to understand where we should set thresholds in various
relevant metrics, so that when data analytics identifies toxic combinations (or that
we’re getting close to them) we can jump on the problem.
79
81. In the long term, ideally we want to be able to do ‘what if’ analysis to address
problems before they arise, and shift thresholds dynamically as internal and external
factors relating to the threat, technology and business landscape.
80
82. This means we can start measuring risk to business value and revenue across
business units, based on business asset exposure to compromise and impact.
81
83. To top it all off, we then want to automate action on our environment using ‘security
robotics’ - i.e. orchestration technologies.
82
84. If what we’re building towards is to stand a chance of doing that, we’re going to want
lots of optionality across the platform (or platforms!) that could eventually support
these outcomes.
83
85. We’ll need to tie in requirements from lots of stakeholders outside security.
84
86. And consider how this effort (and other security controls) are introducing friction or
issues into people’s ‘jobs to be done’.
85
87. Especially where we’ve deployed ‘award winning solutions’ that people talk about like
this in private.
86
88. If we start with the question ‘What’s the user need?’, we can – no doubt – come up
with a set of foundational insights, which will deliver value to the CIO, project
managers, devs, sec ops the CISO and security risk functions.
87
89. And we can think about how to make information accessible to interrogate, so lots of
different people can self-serve.
88
90. The vision driving our MVP approach might look like this.
Which sounds convincing.
89
91. Except, what if we have 2000 developers in one Business Unit?
Or at least we think we do. We know we’ve got at least 2000, but it could be more.
And our code base is totally fragmented, so we don’t know where all our code is, and
how we‘d get good coverage on scanning it.
And we‘re about to move a load of infrastructure and operations to a Business
Process Outsourcer. Which will make it challenging to get some of the data we want.
And the available data that we can correlate in the short term, well ... to be honest, it
ain‘t great.
90
92. Perhaps we’ve chosen data analytics as a proxy for the problem that actually needs
solving, as analytics is very unlikely to be able to solve the problem we have.
91
93. All of which is to say, you can have the best strategy in the world to tackle a problem
you have, but if it isn’t focused on a problem you have, that you also know you can
solve, then we’re back to square one and the CFO’s pet T-Rex.
92
95. How do we choose our battleground to solve problems we know we have, which we
know we can solve.
94
96. Simon Wardley is open sourcing really great thinking on strategy, and he talks a lot
about the primacy of ‘where’; i.e. we have to understand our landscape to choose
where to play, in order to win.
In our strawman devops example, the problem we had to solve was dictated to us.
- We had some great ideas and frameworks, but no understanding of our landscape
- We had no time to build that up
- We couldn’t choose a battleground where we had a good chance of winning
- And we had to jump on the problem that was right in front of us, because we were
firefighting
95
97. This massively limited our chance of success, because we lacked context about the
game, the landscape and the climate.
96
98. Let’s return to the concept we started out with.
We need to help our leaders demonstrate strong control over risk.
97
99. And to do that we need to pull lots of puzzle pieces together into a picture.
98
100. Measuring the probability of badness happening is a topic of great debate in security.
But very often, at a practical level, we can end up in endless meetings arguing about
how naked we need to be to catch a cold, when it would be more productive to just
put our clothes on.
Because if our cyber hygiene levels are low (or inconsistent), not only is the job of
detect and respond harder, but it’s harder to know if we’re in a defensible position
should the worst happen.
99
101. Starting with foundational building blocks that are possible, and highly palatable to
solve makes good sense.
100
102. As long as we can present outputs and results that people want to hang behind their
metaphorical desk on the office wall.
101
104. We can now assess where we have problems that sit in that box.
This may be as simple as assuring that we have the AV coverage and operational
consistency we expect across our different host types (servers and workstations) and
OS types.
103
105. The output should be relevant to various stakeholders, from the CIO to IT Ops to
security control managers.
104
106. And we should be able to track that we are moving from here …
105
108. This is a model I call ‘the security cross fader’.
107
109. It expresses that investment in detect / respond becomes unsustainable at scale,
where that function is also picking up the side effects of poor cyber hygiene.
This sets up an investment trade off, of implementing preventative controls or change
processes to be secure by design where that makes financial sense, and having detect
/ respond pick up the slack where it’s not.
108
110. The goal (and challenge) is to find the right balance, so there’s less noise for detect /
respond to sift through, and an ability to for Security Operations to control the scope
of what they need to worry about.
109
111. How does this shake out into our problem space for security data analytics?
110
113. … we want to ensure we tackle problem sets in a way that delivers maximum value
for multiple stakeholders with minimal data sets.
112
114. With that constraint, we can ask, “If you could only choose 5 data sets to meet your
user needs, what would they be?”
Here is an example of an answer we might get back.
113
115. The correlation we get in Gold is a 1st
order confirmation, and in blue, 2nd
order
confirmation of ‘facts’ about ‘stuff’.
114
116. We then have inferences we can draw based on our knowledge.
115
118. That don’t give us strong confirmations, but which we can use to join dots.
117
119. Now we know what we’re aiming for, we might not start with Netflow, but we can
target data sets for collection and analysis that get us on the ladder we eventually
need to climb.
118
122. … the journey can start with a user need that is far narrower.
121
123. As Mark Madsen said in 2011, if you procrastinate long enough, most problems solve
themselves.
122
124. And when it comes to building data lakes that can handle data volume, velocity and
diversity at scale, this is certainly where the market is heading.
So before investing lots of money to try and get there ourselves (with all the inter-
dependencies and challenges that entails) the best advice may be to wait a while.
123
126. If this is the approach we take to iterate quickly …
125
127. Then what we are setting up is a phased approach to quickly understand our data, the
value we can get from it currently, and the extent of the value we’ll be able to get in
future.
126
128. Like a musical cannon, we want to solve early problems that make harmonies more
pleasing over time as we add data sources and build analytics.
127
129. For example, we can use these data sets (at the bottom in grey) to address the
hygiene factors in green above.
128