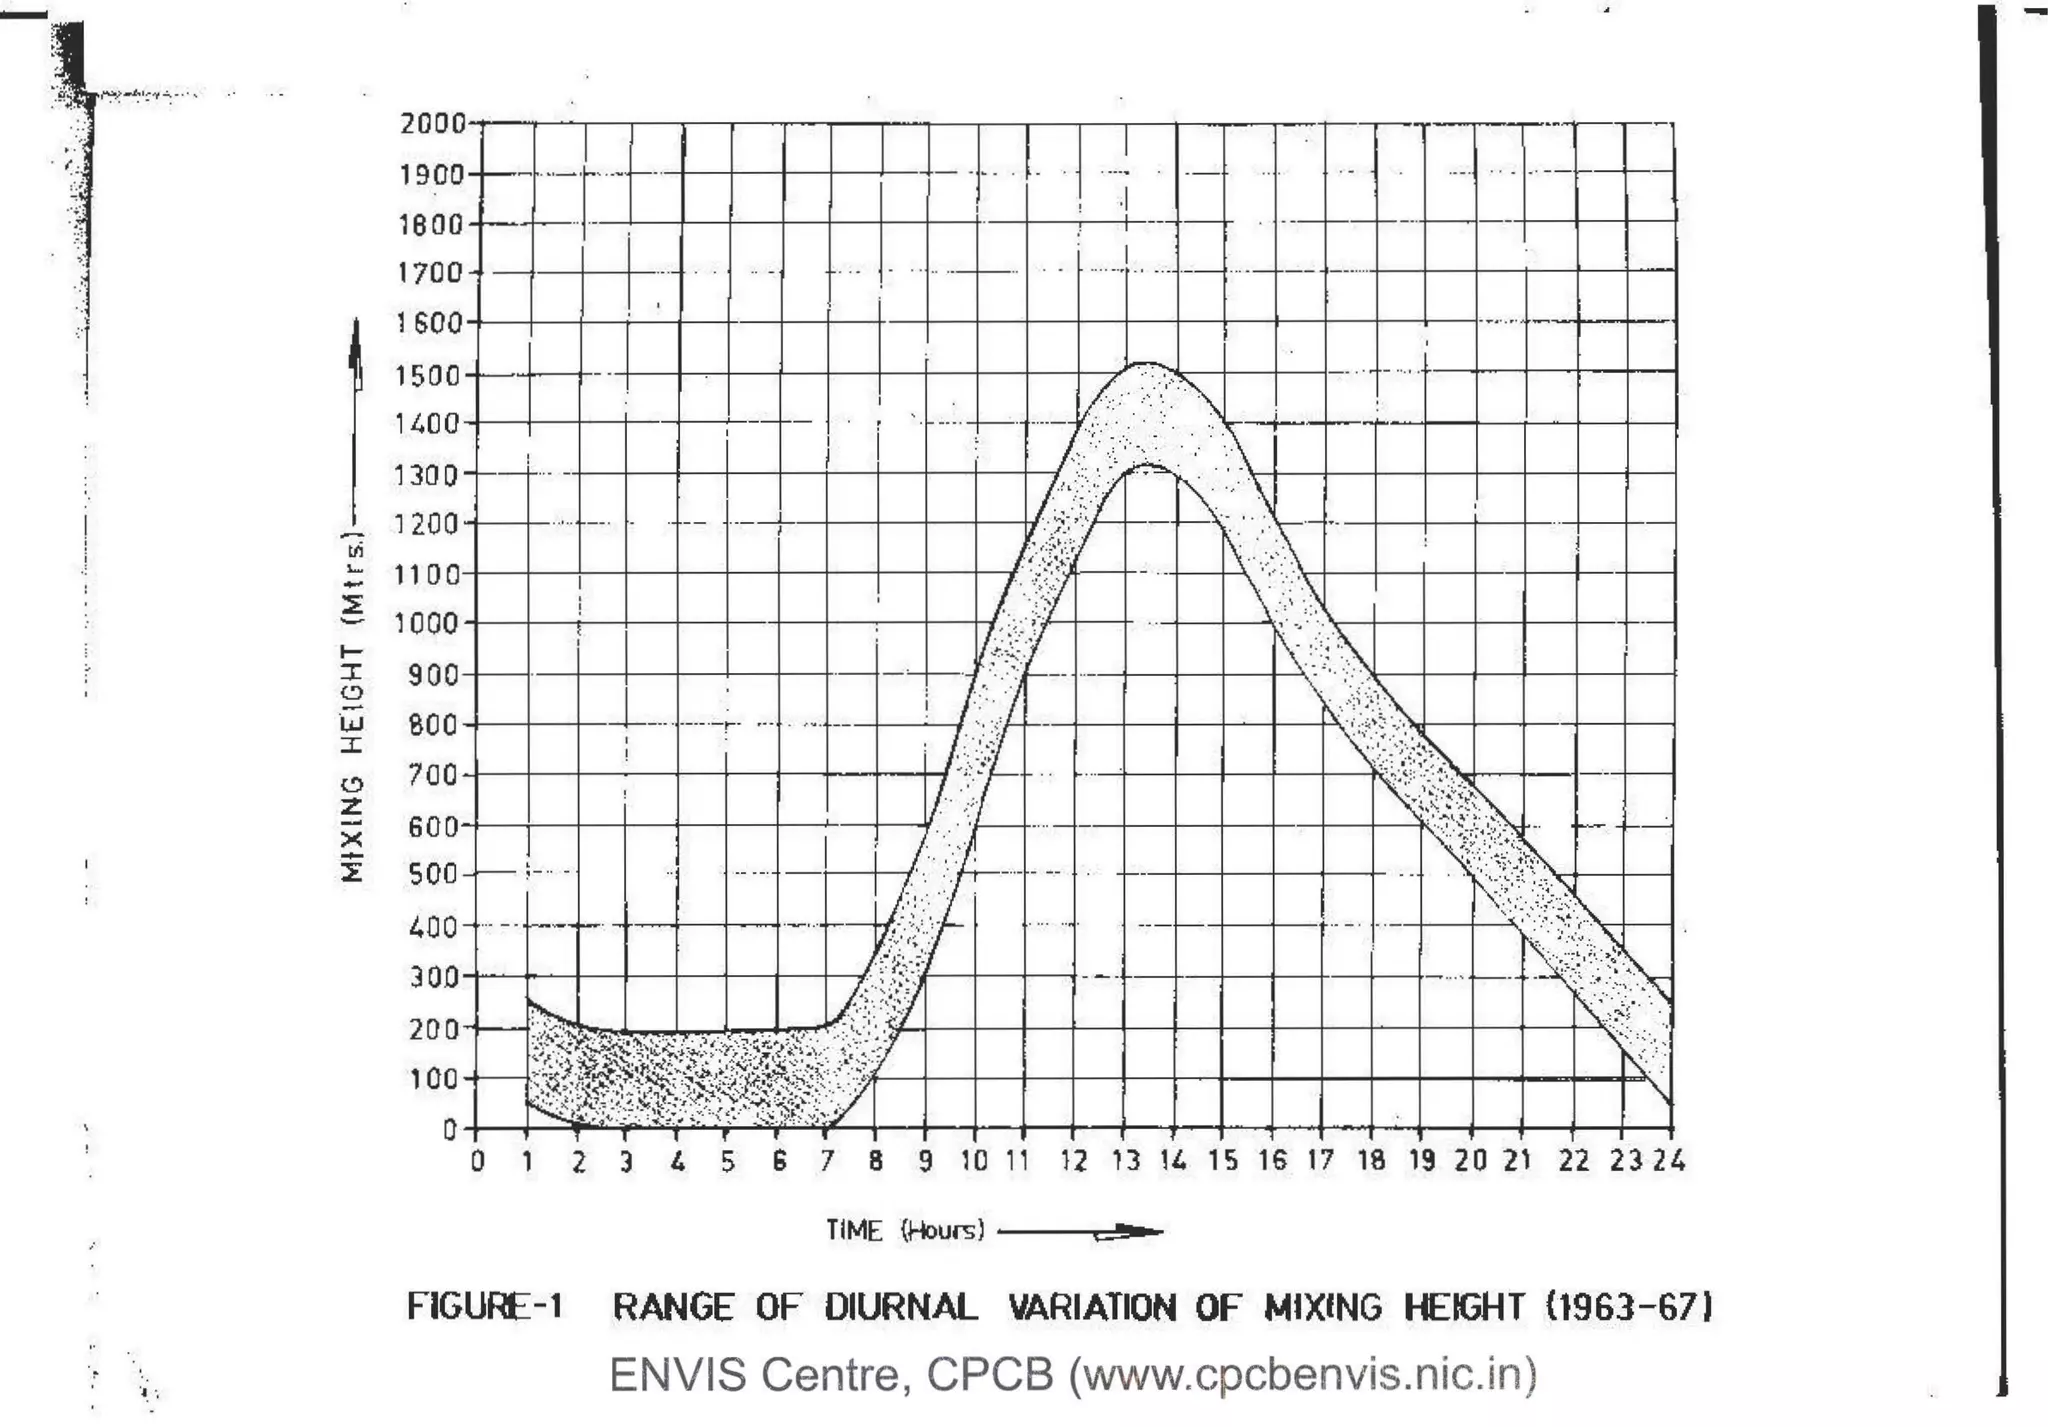
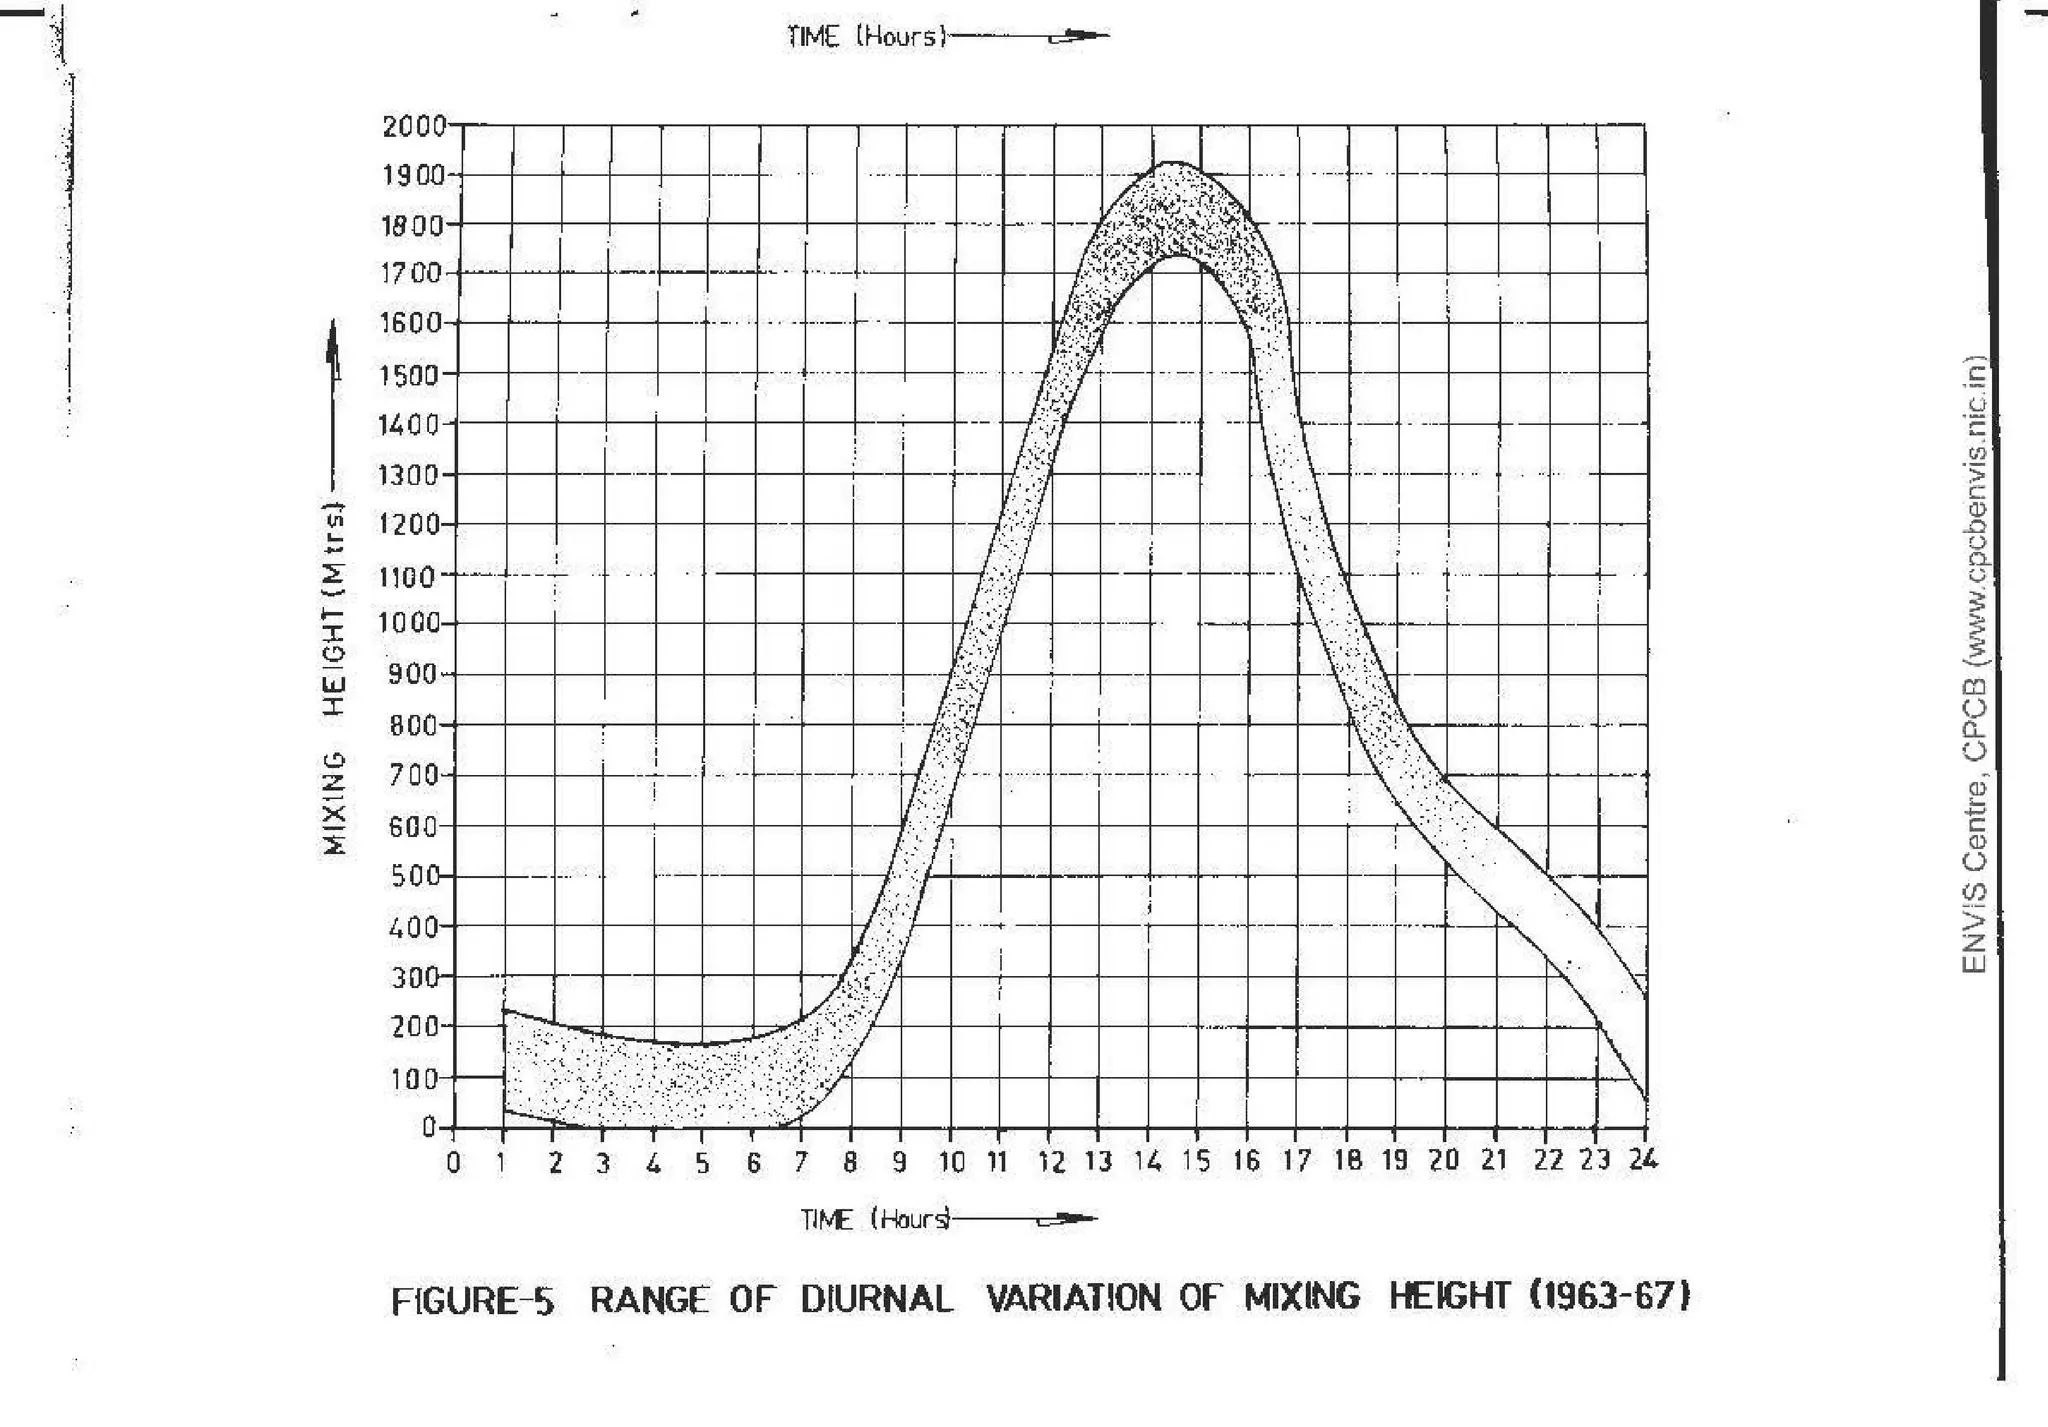
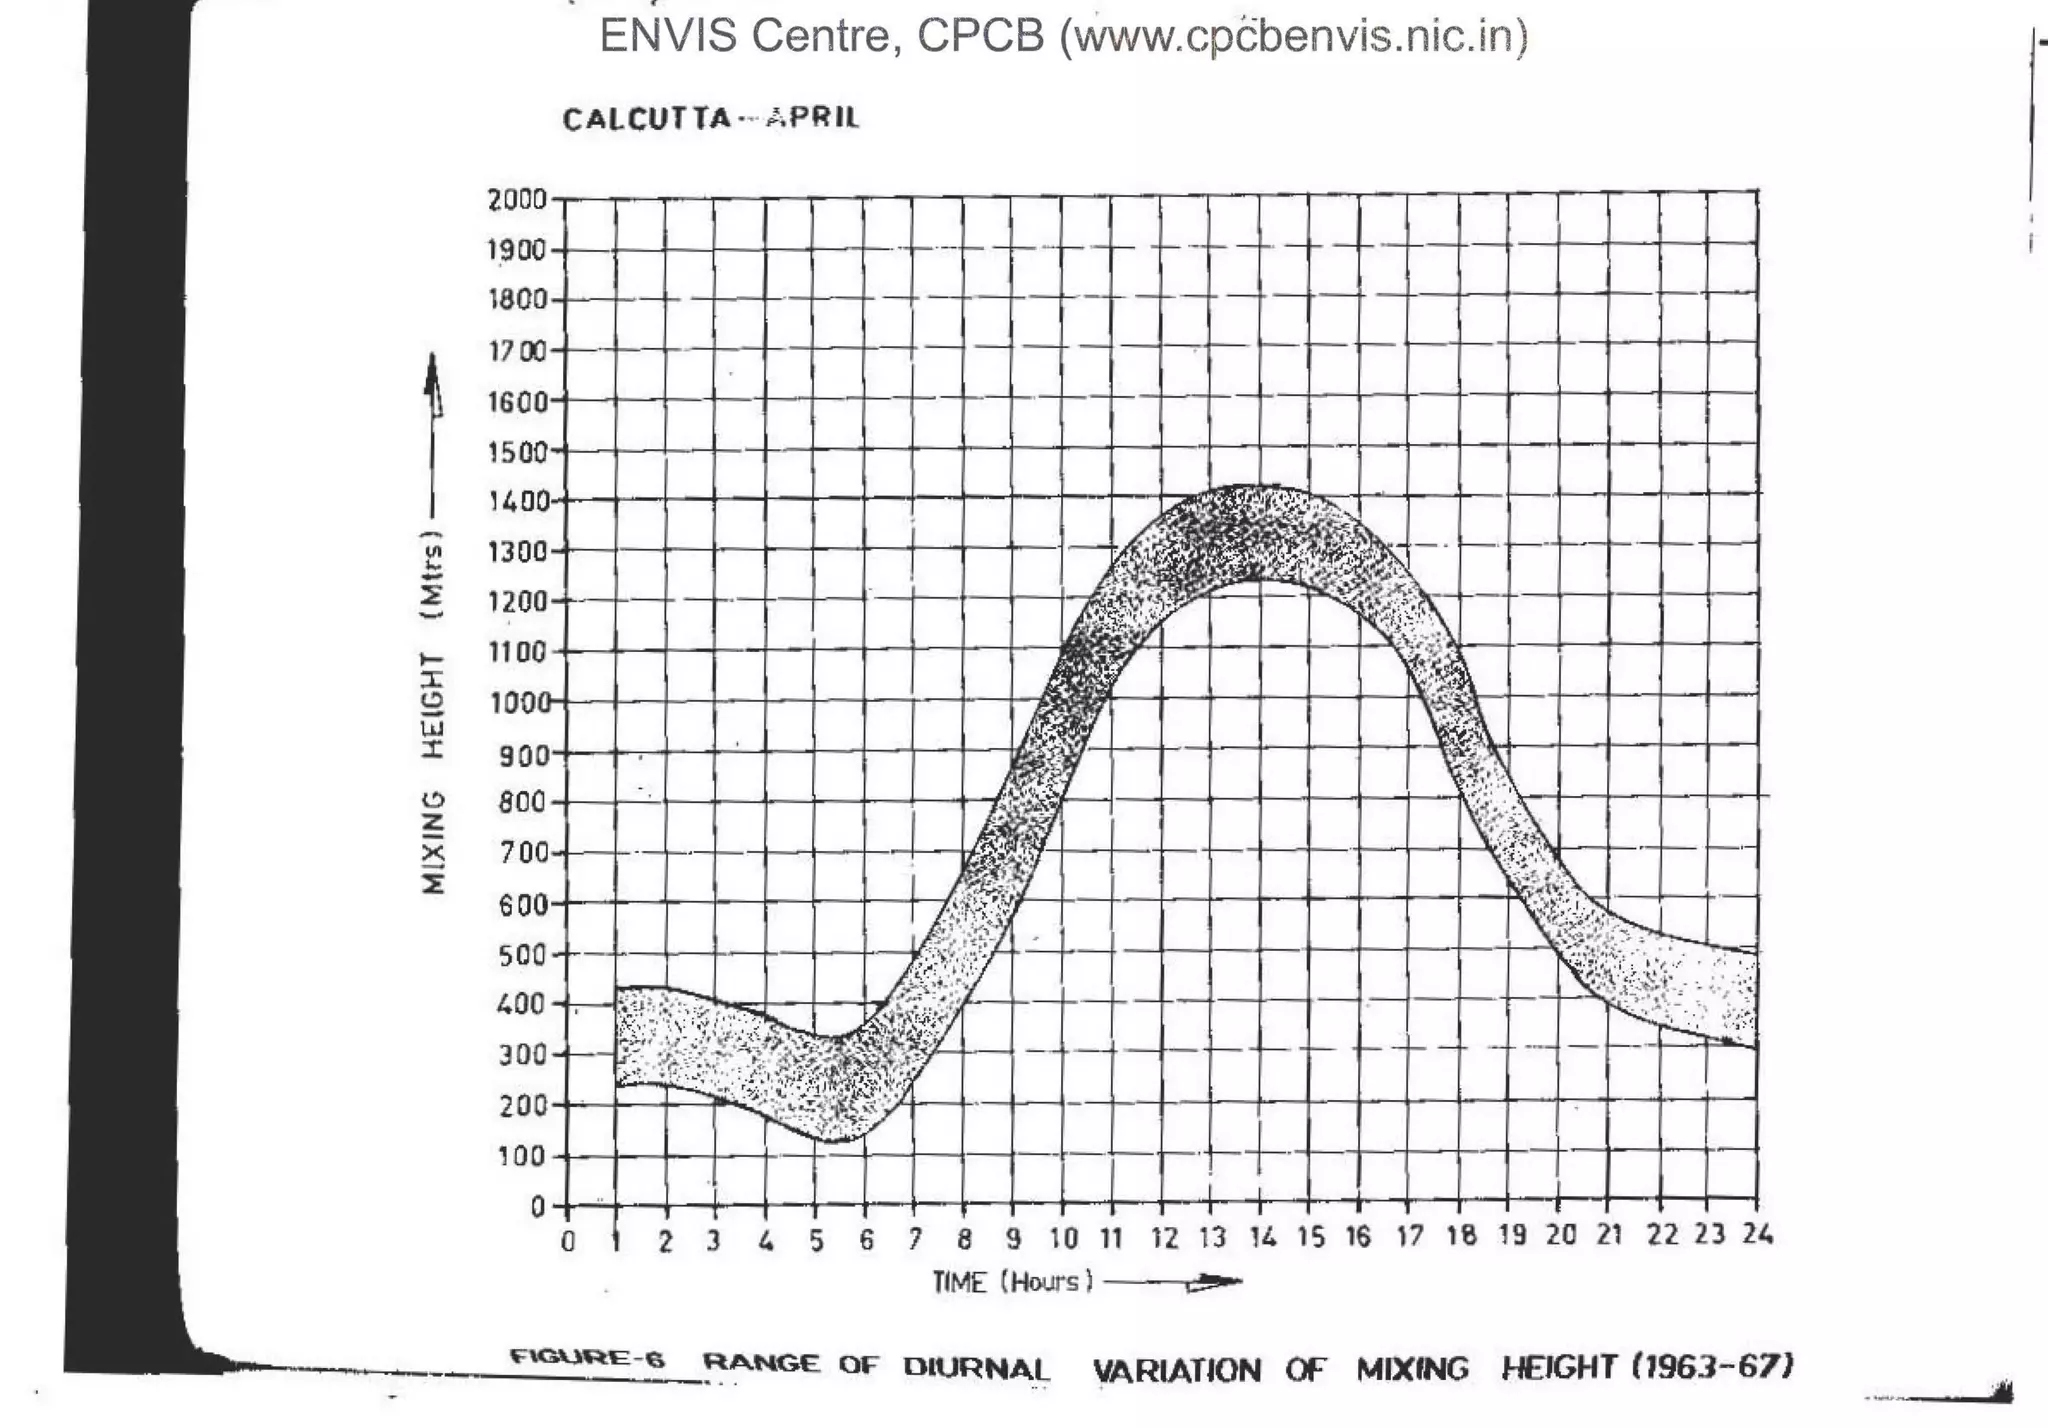
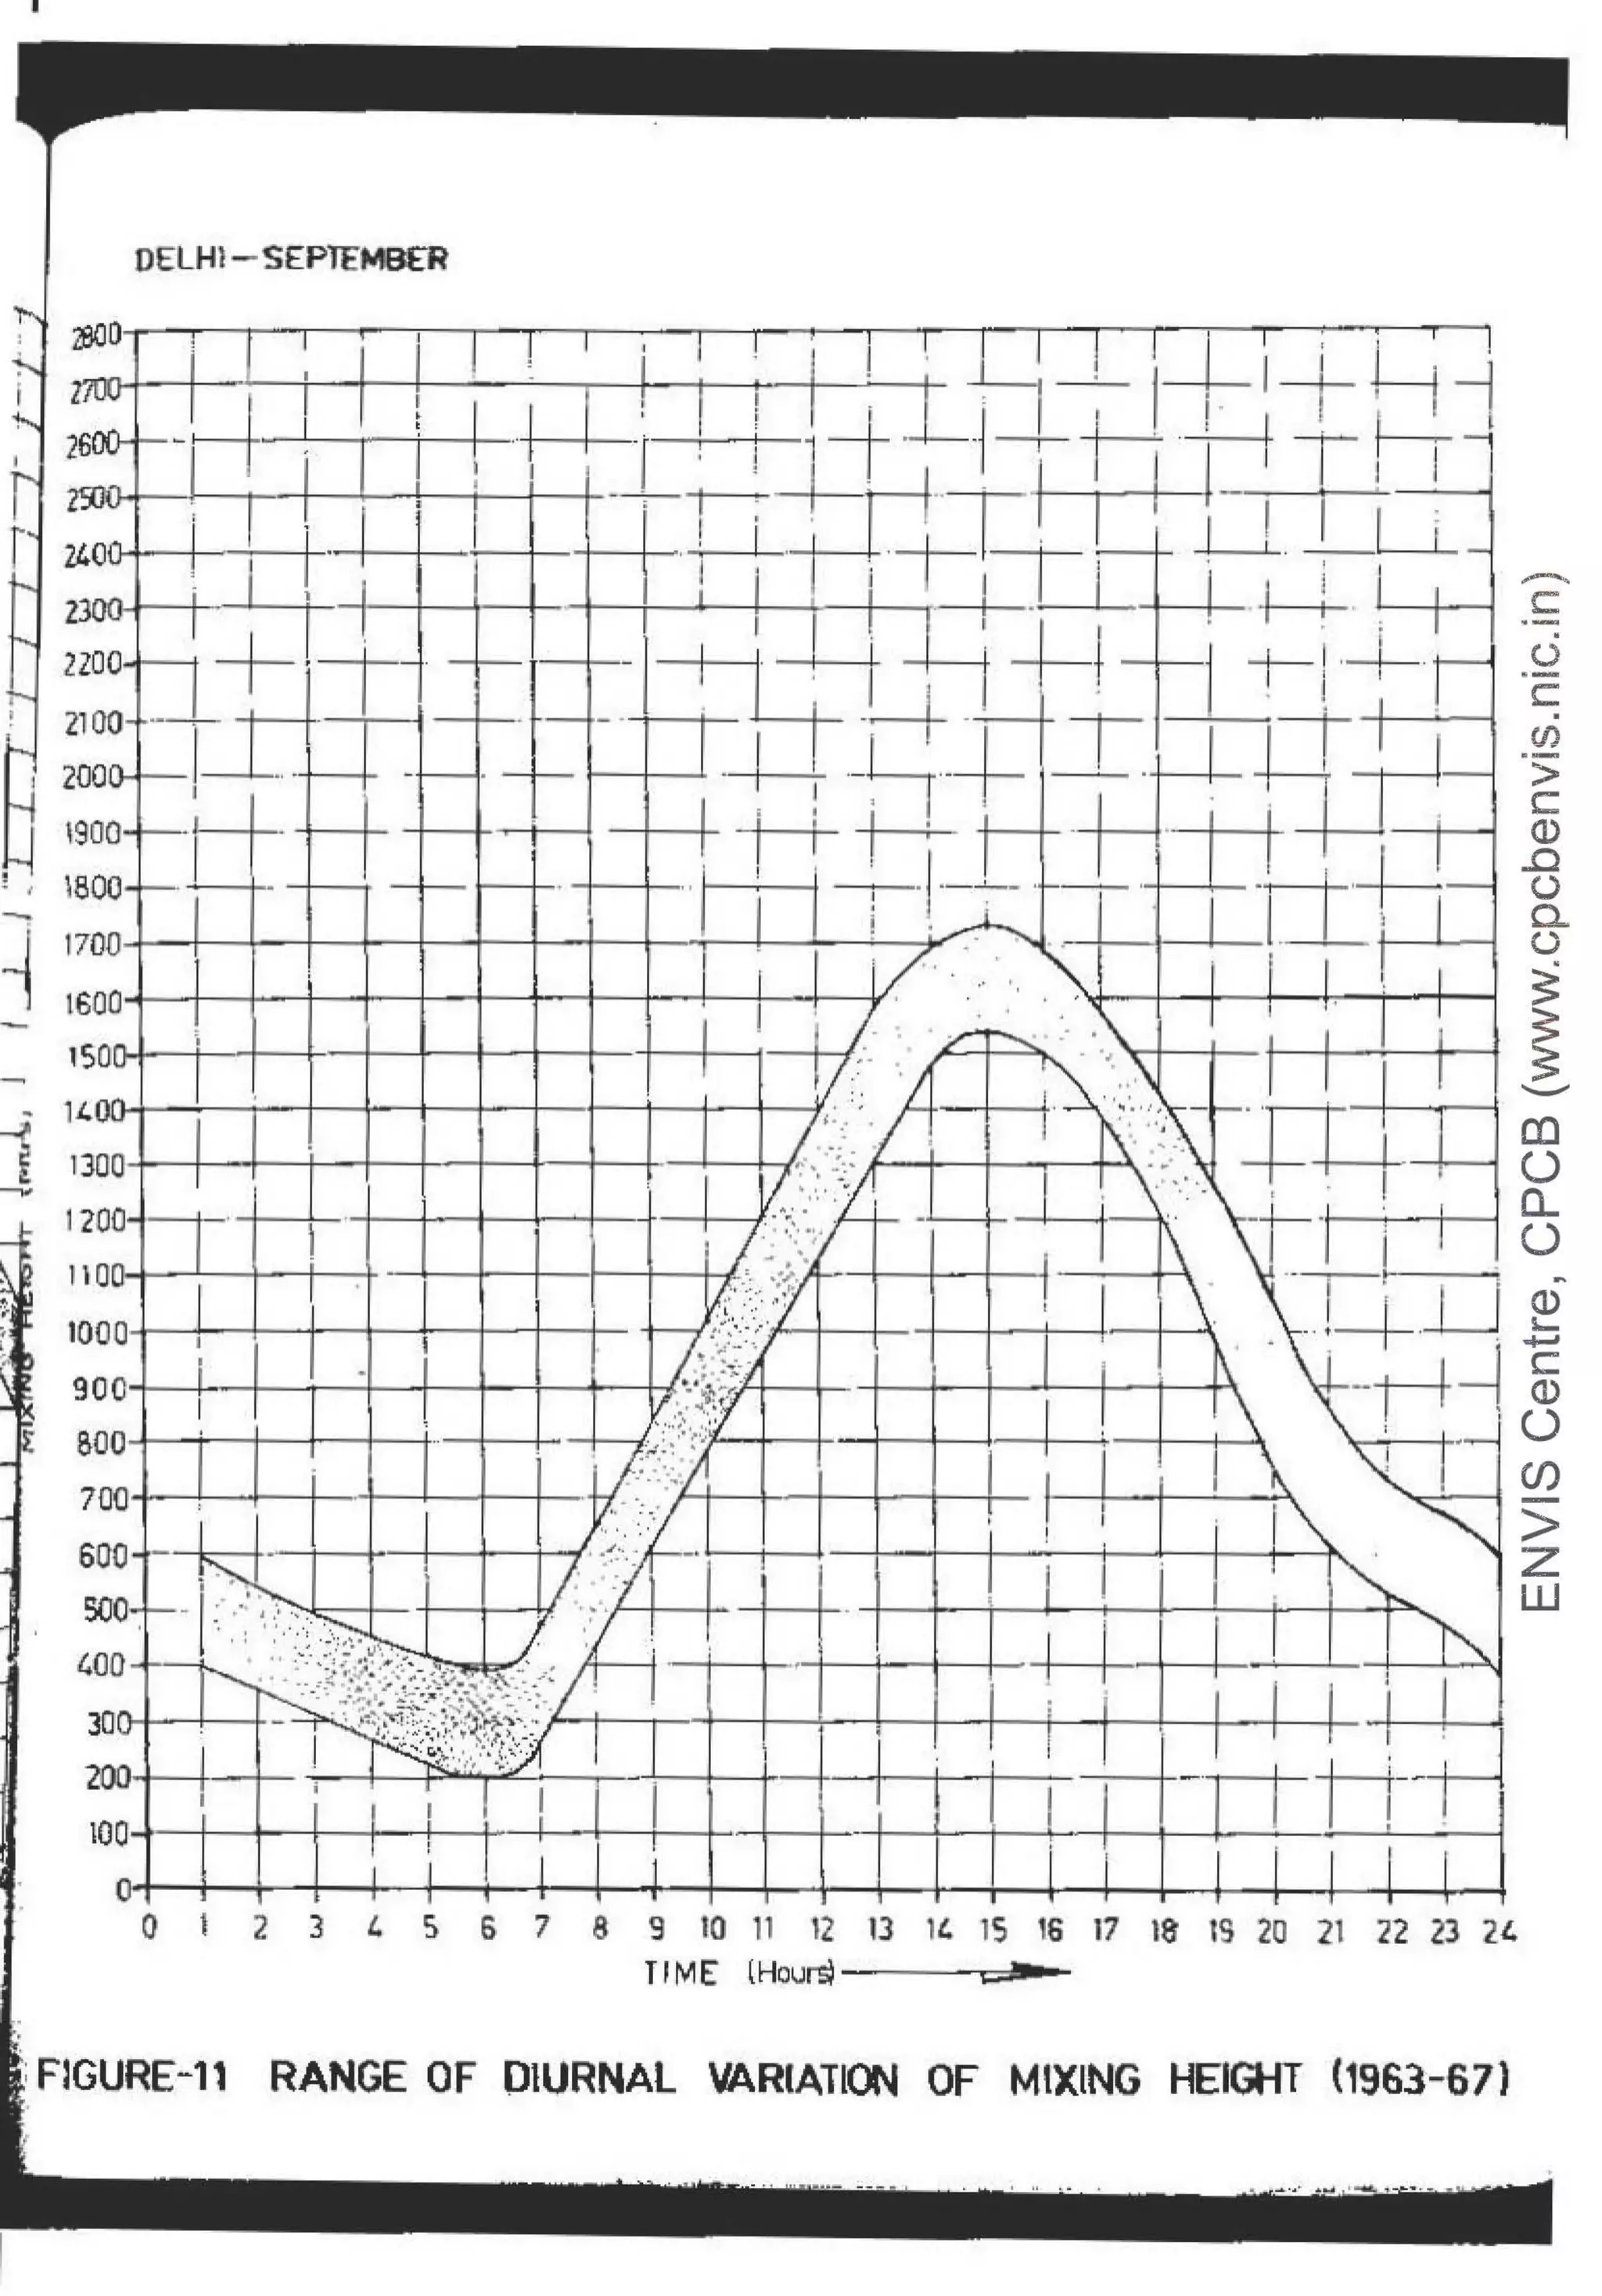
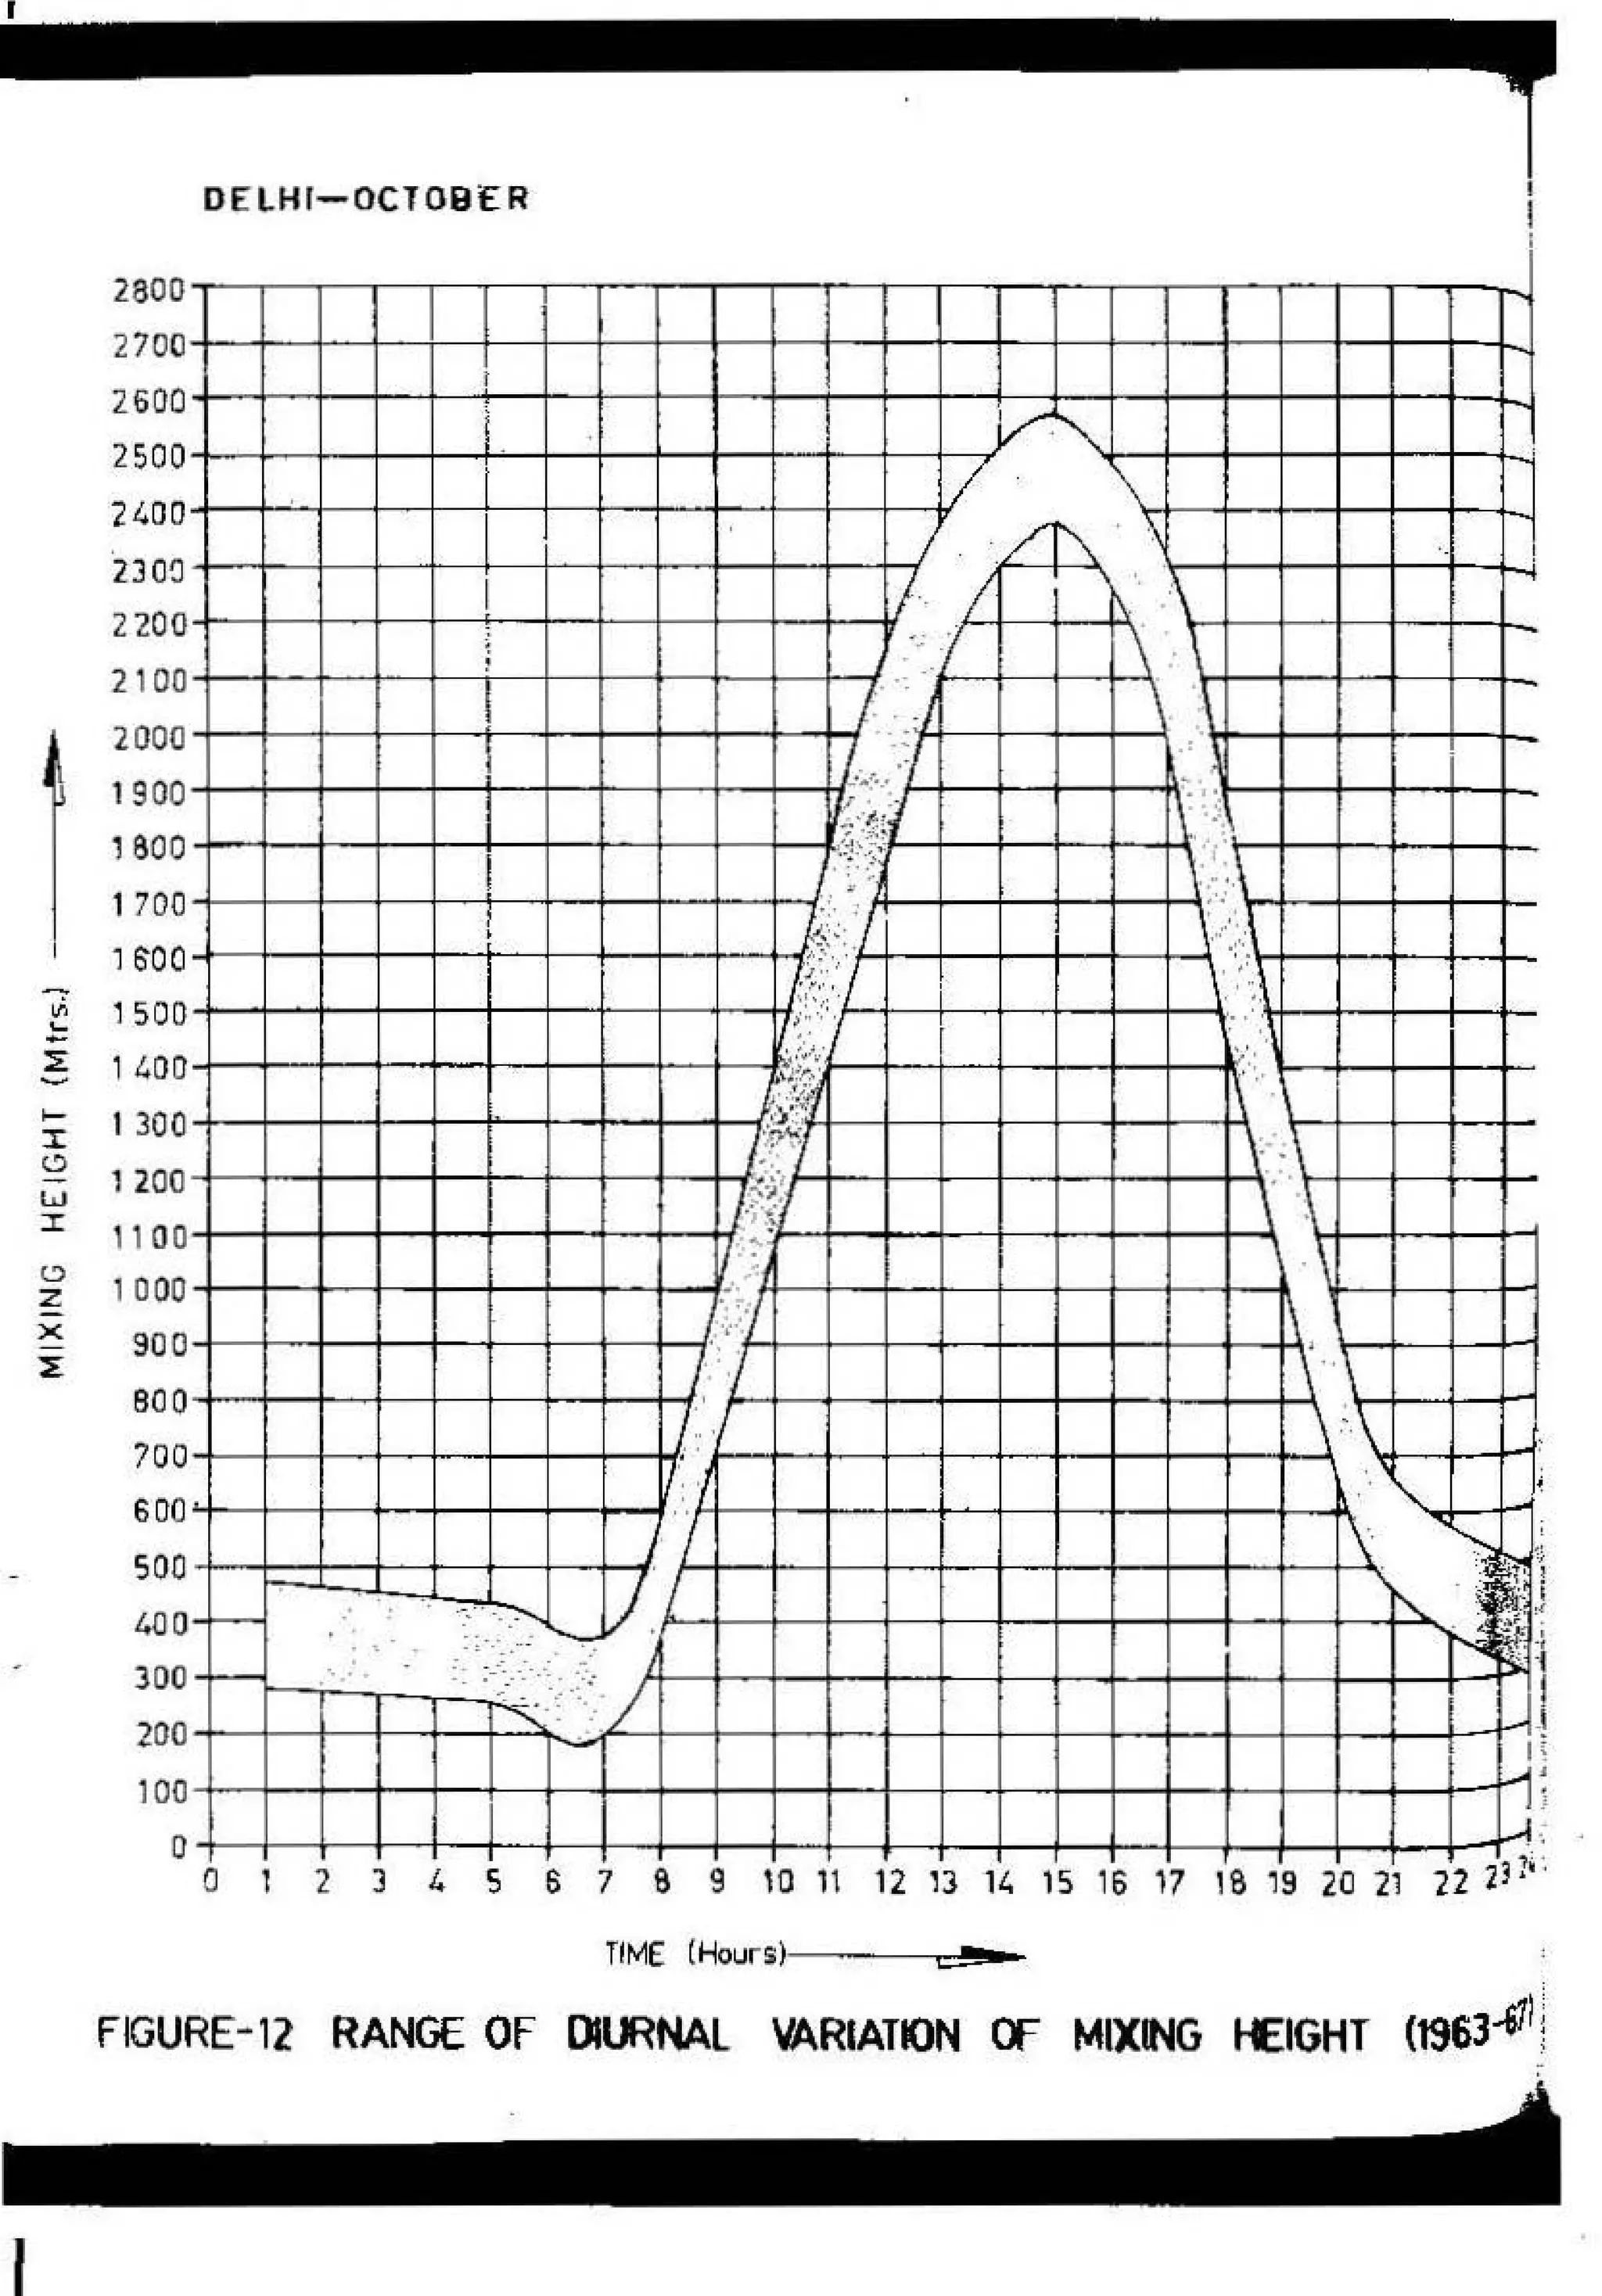
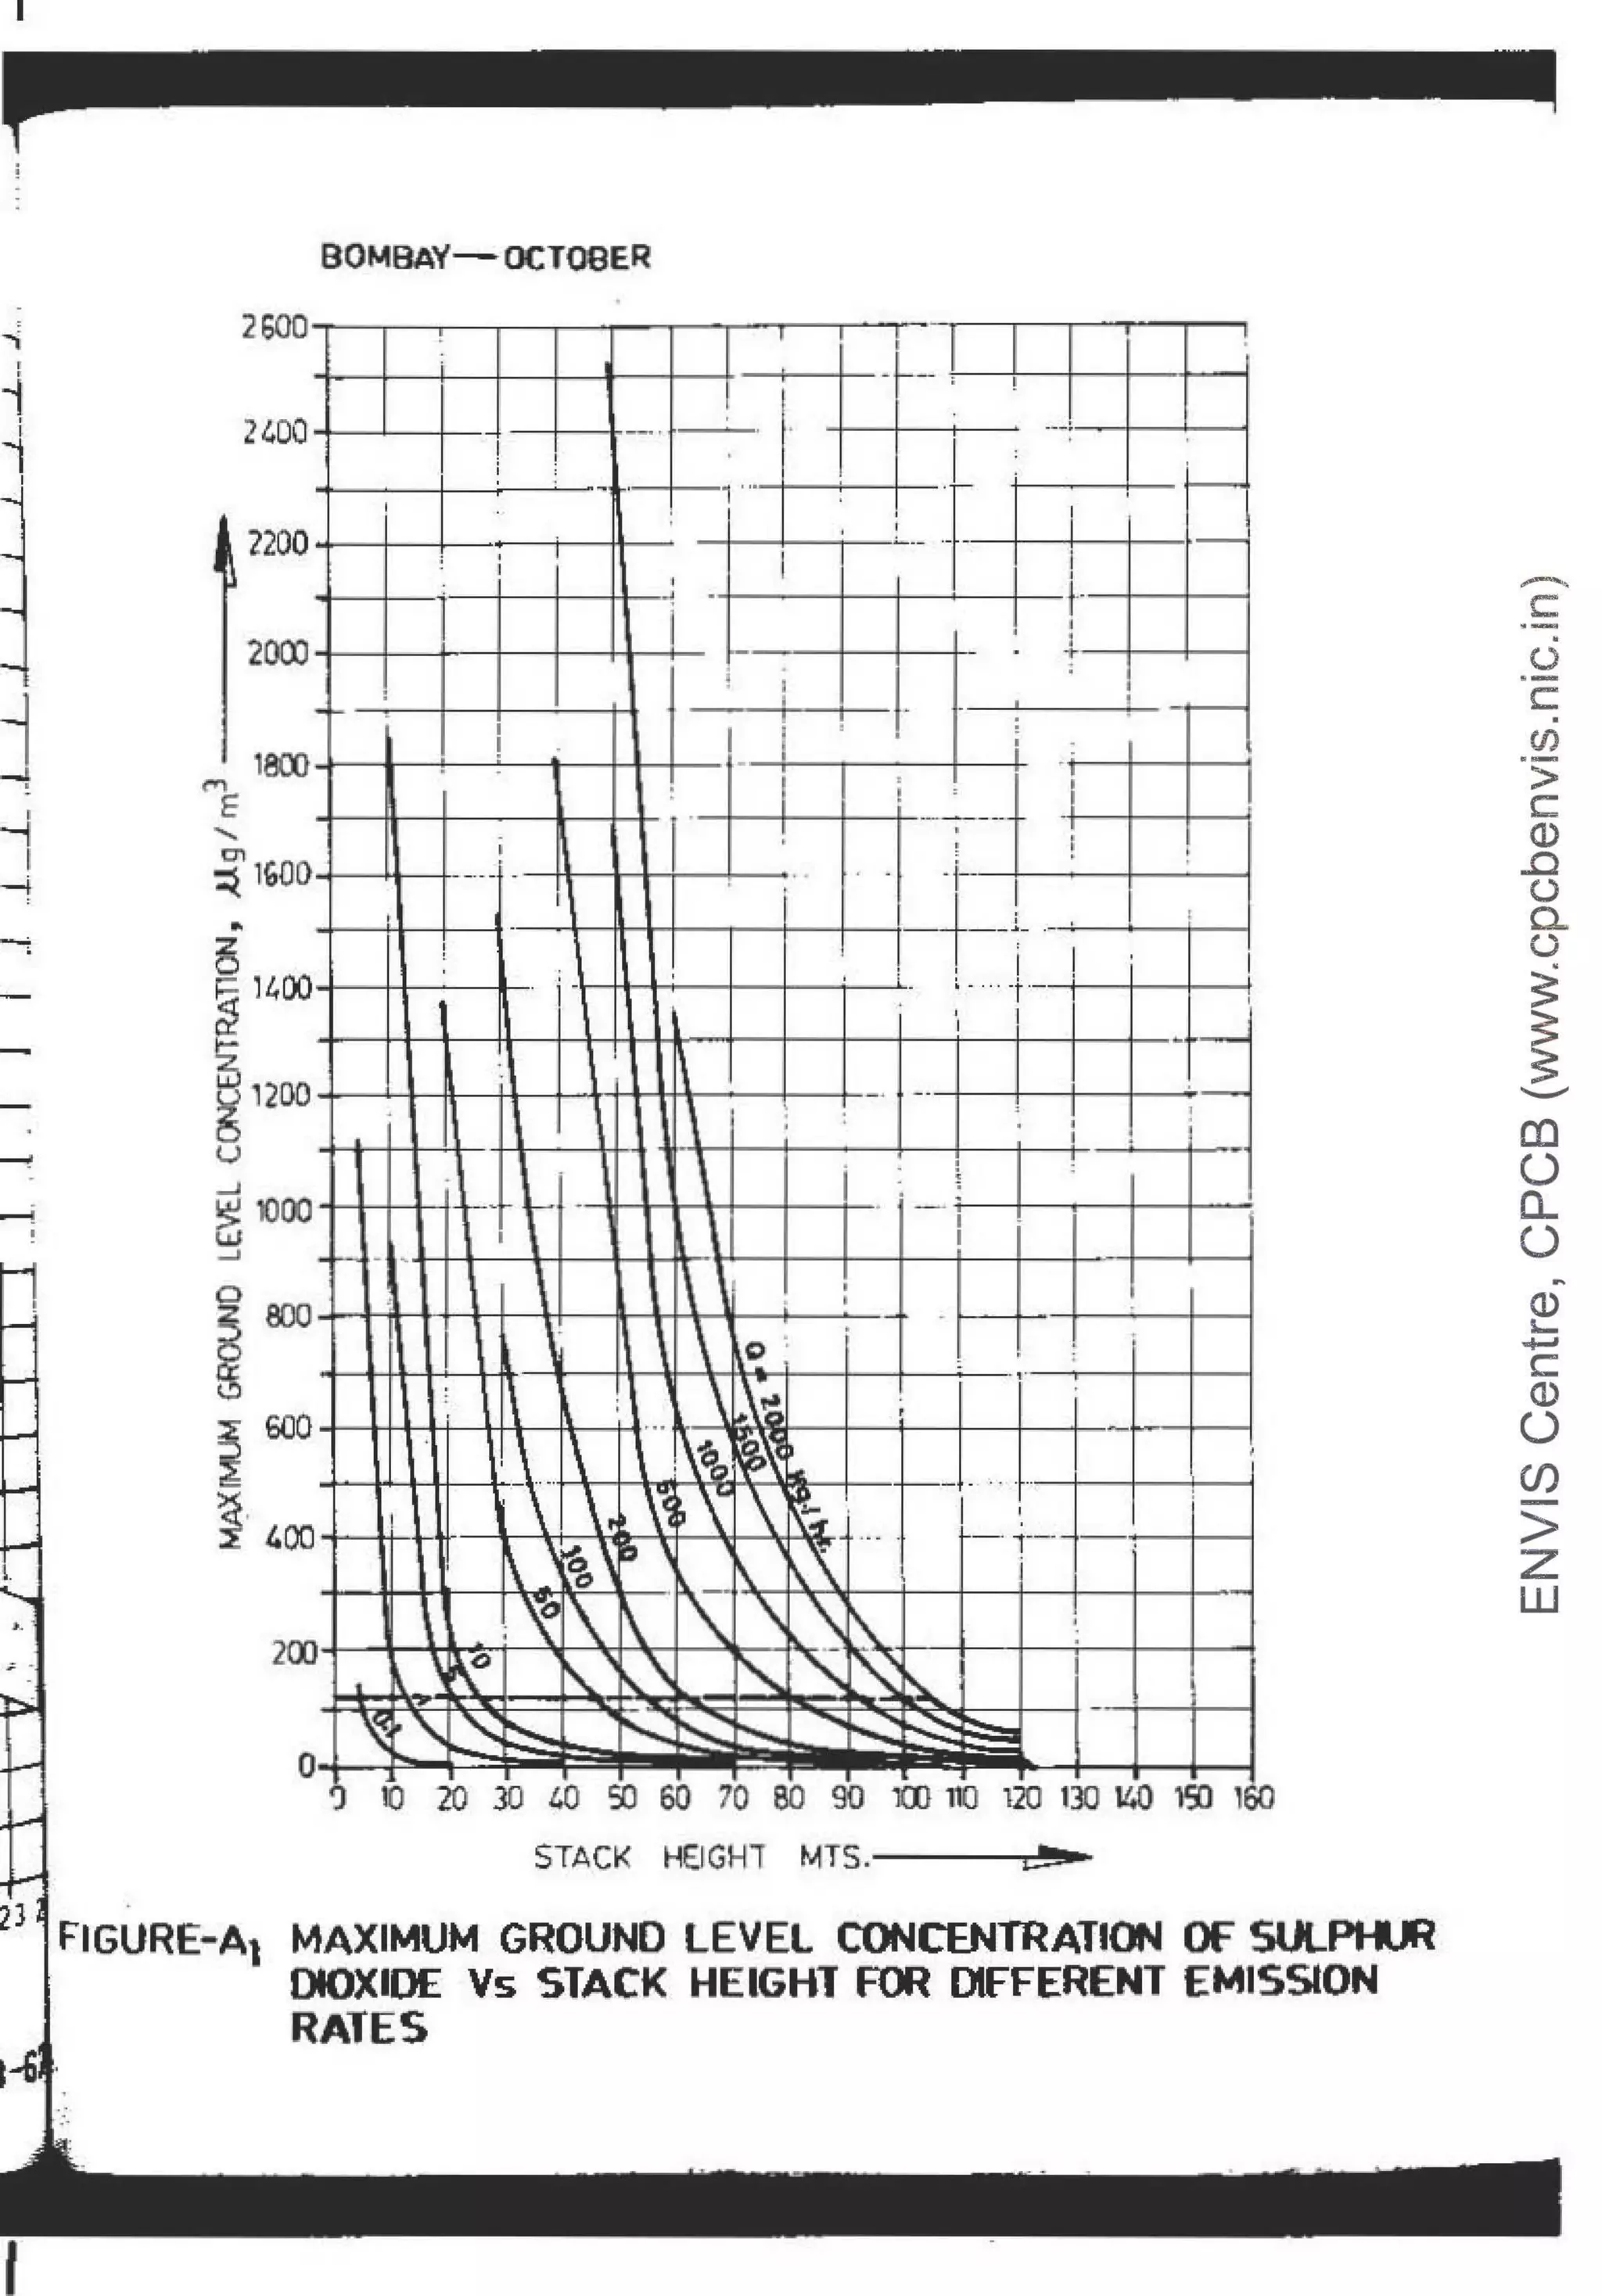
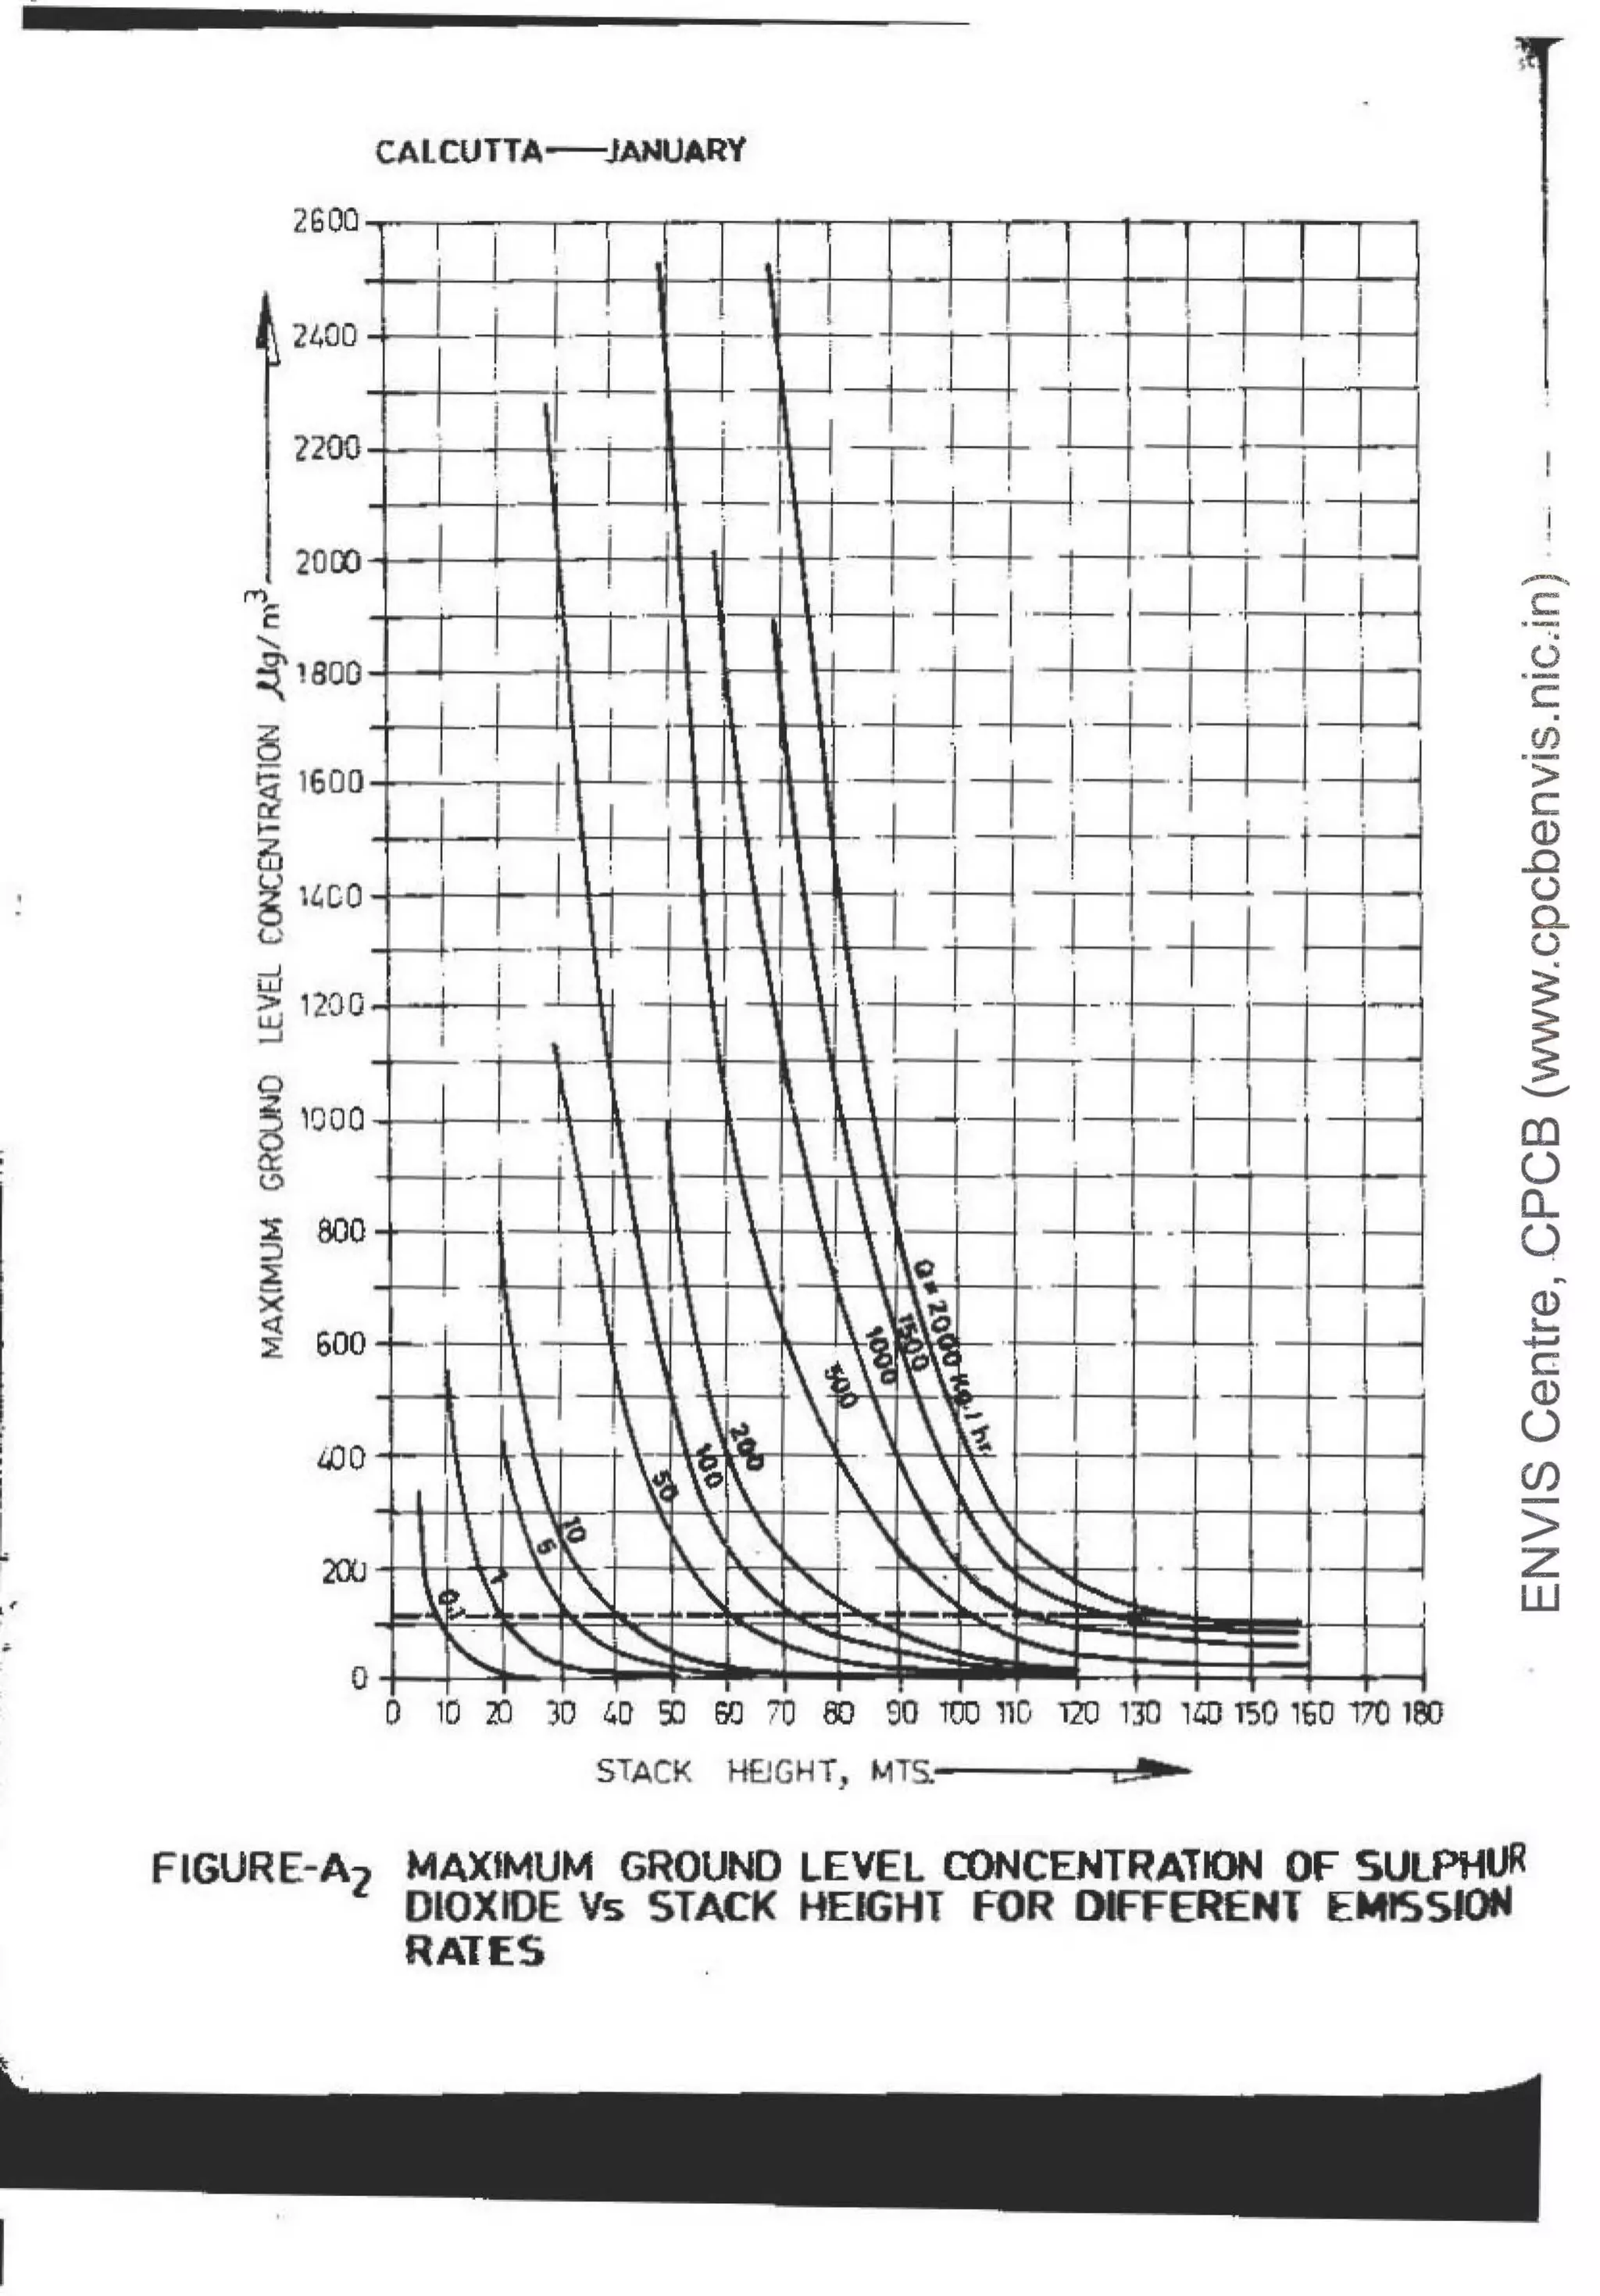
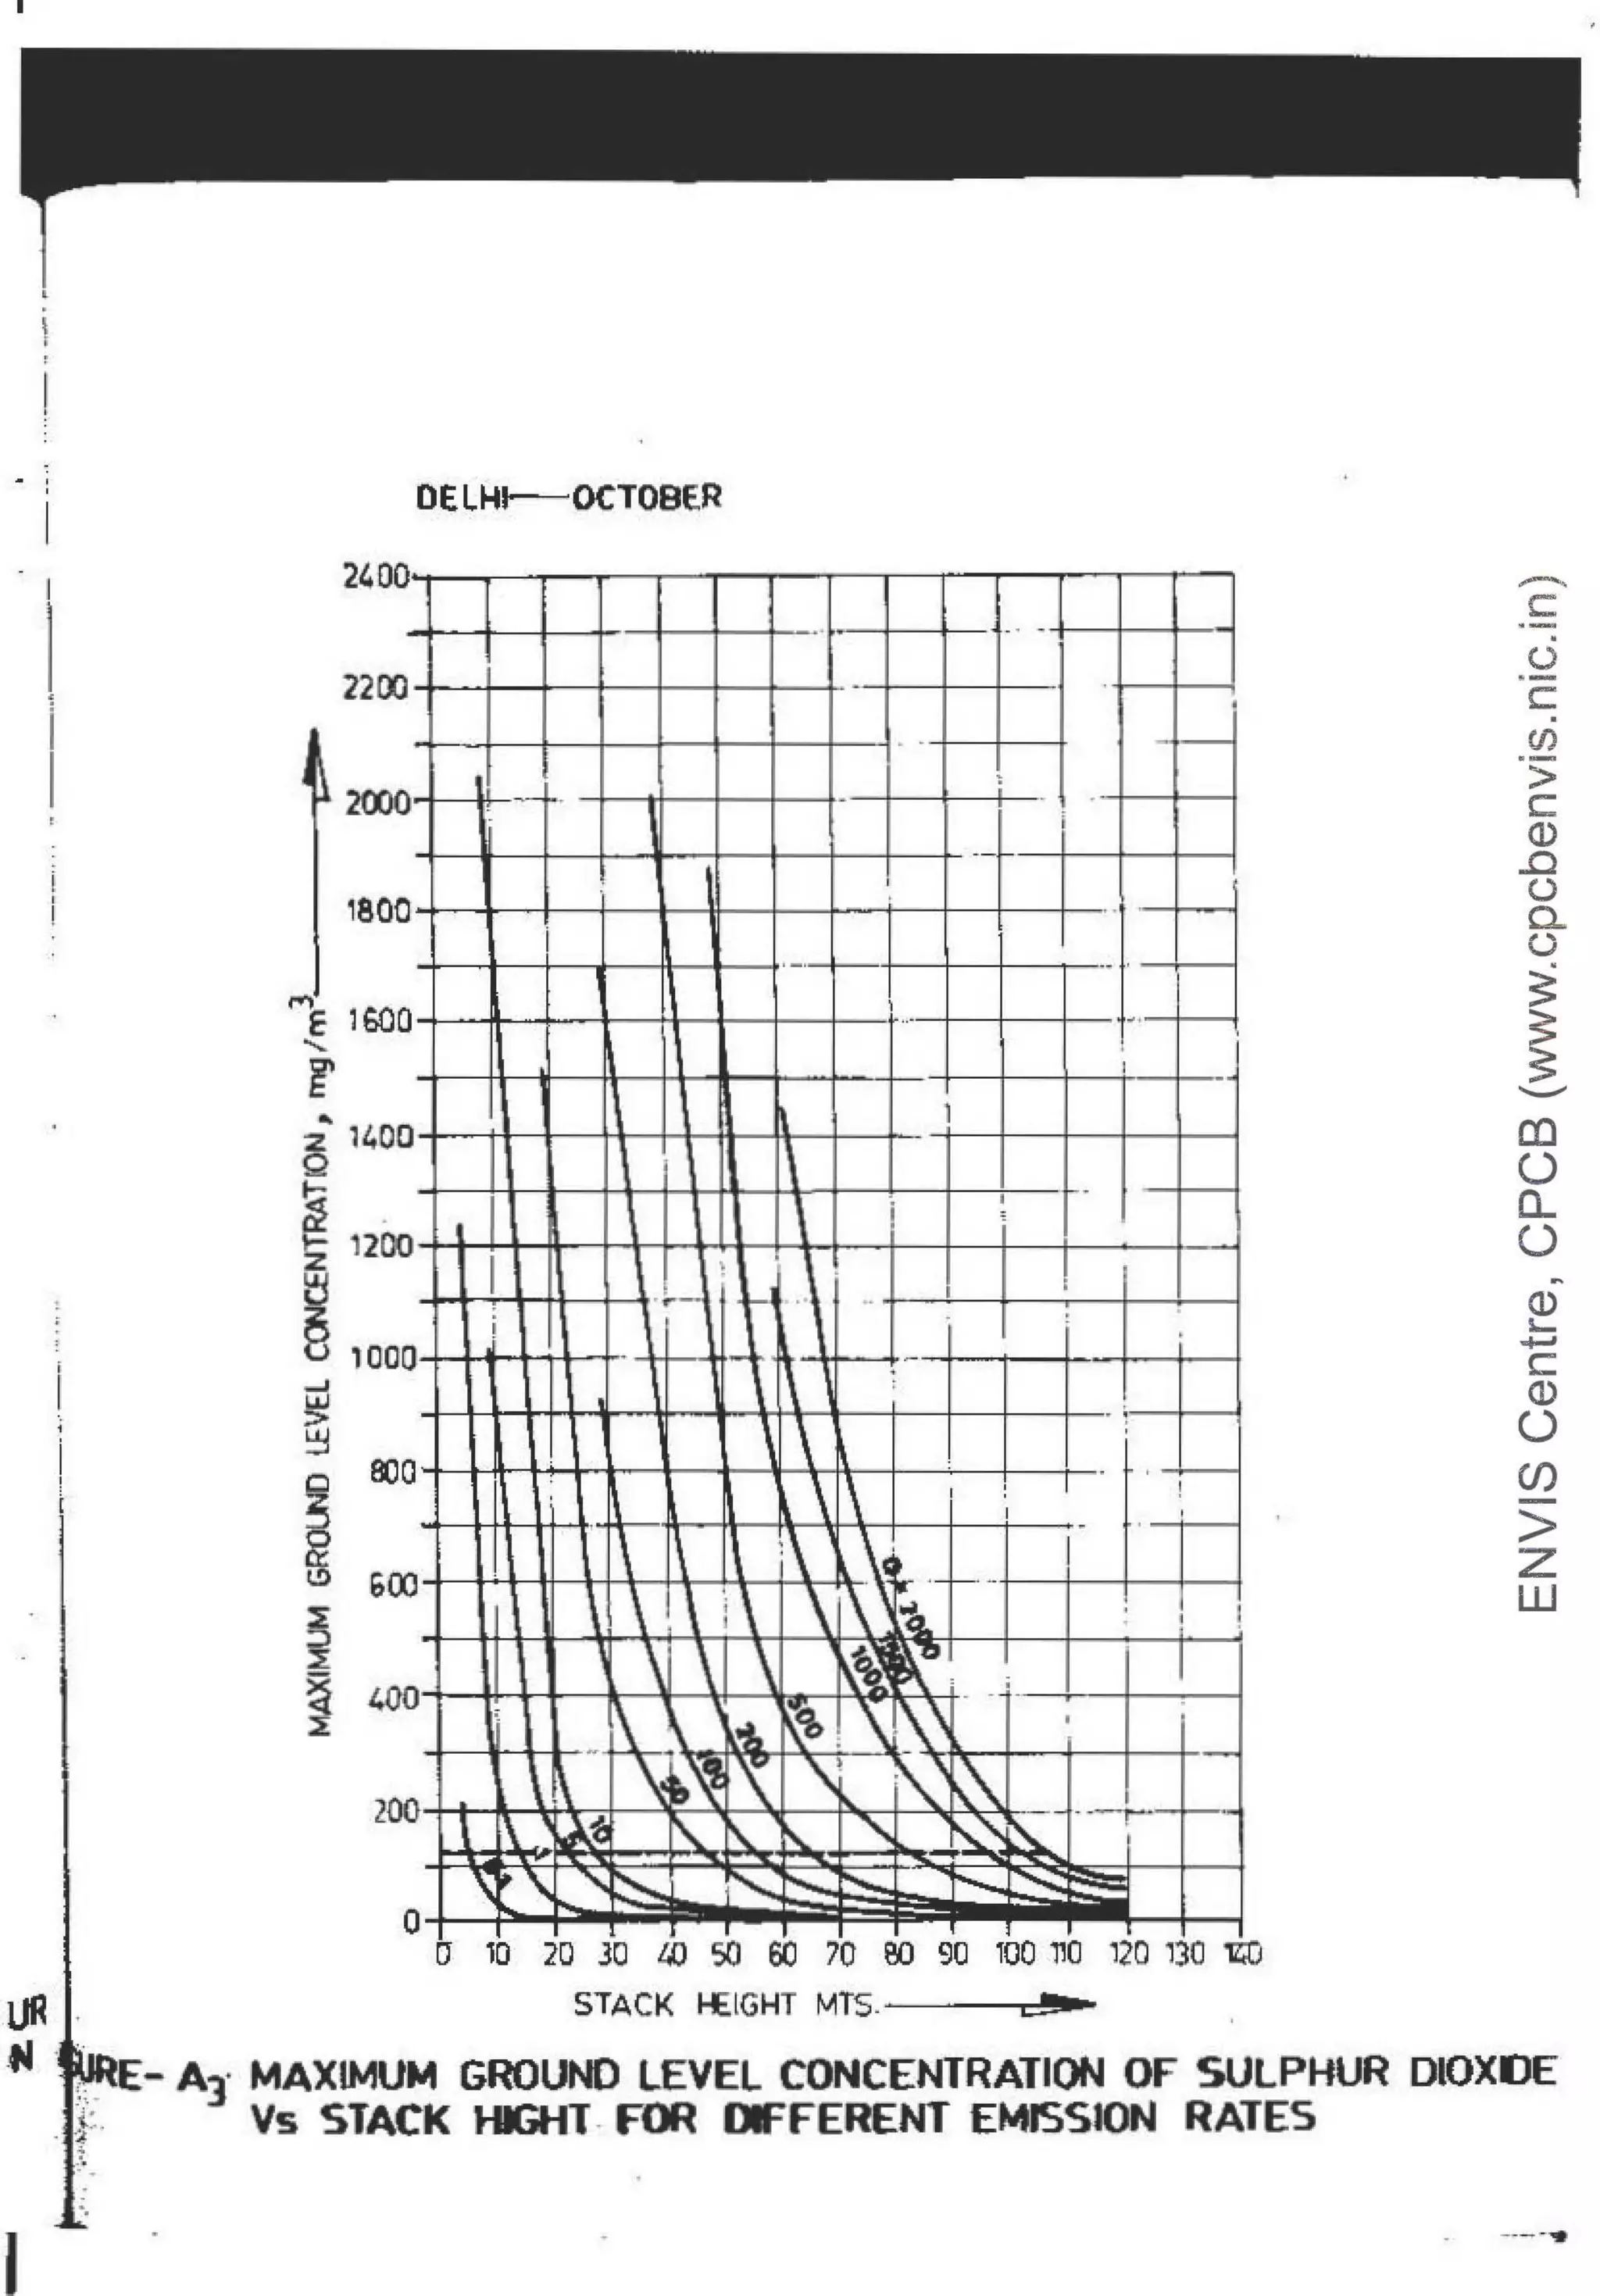
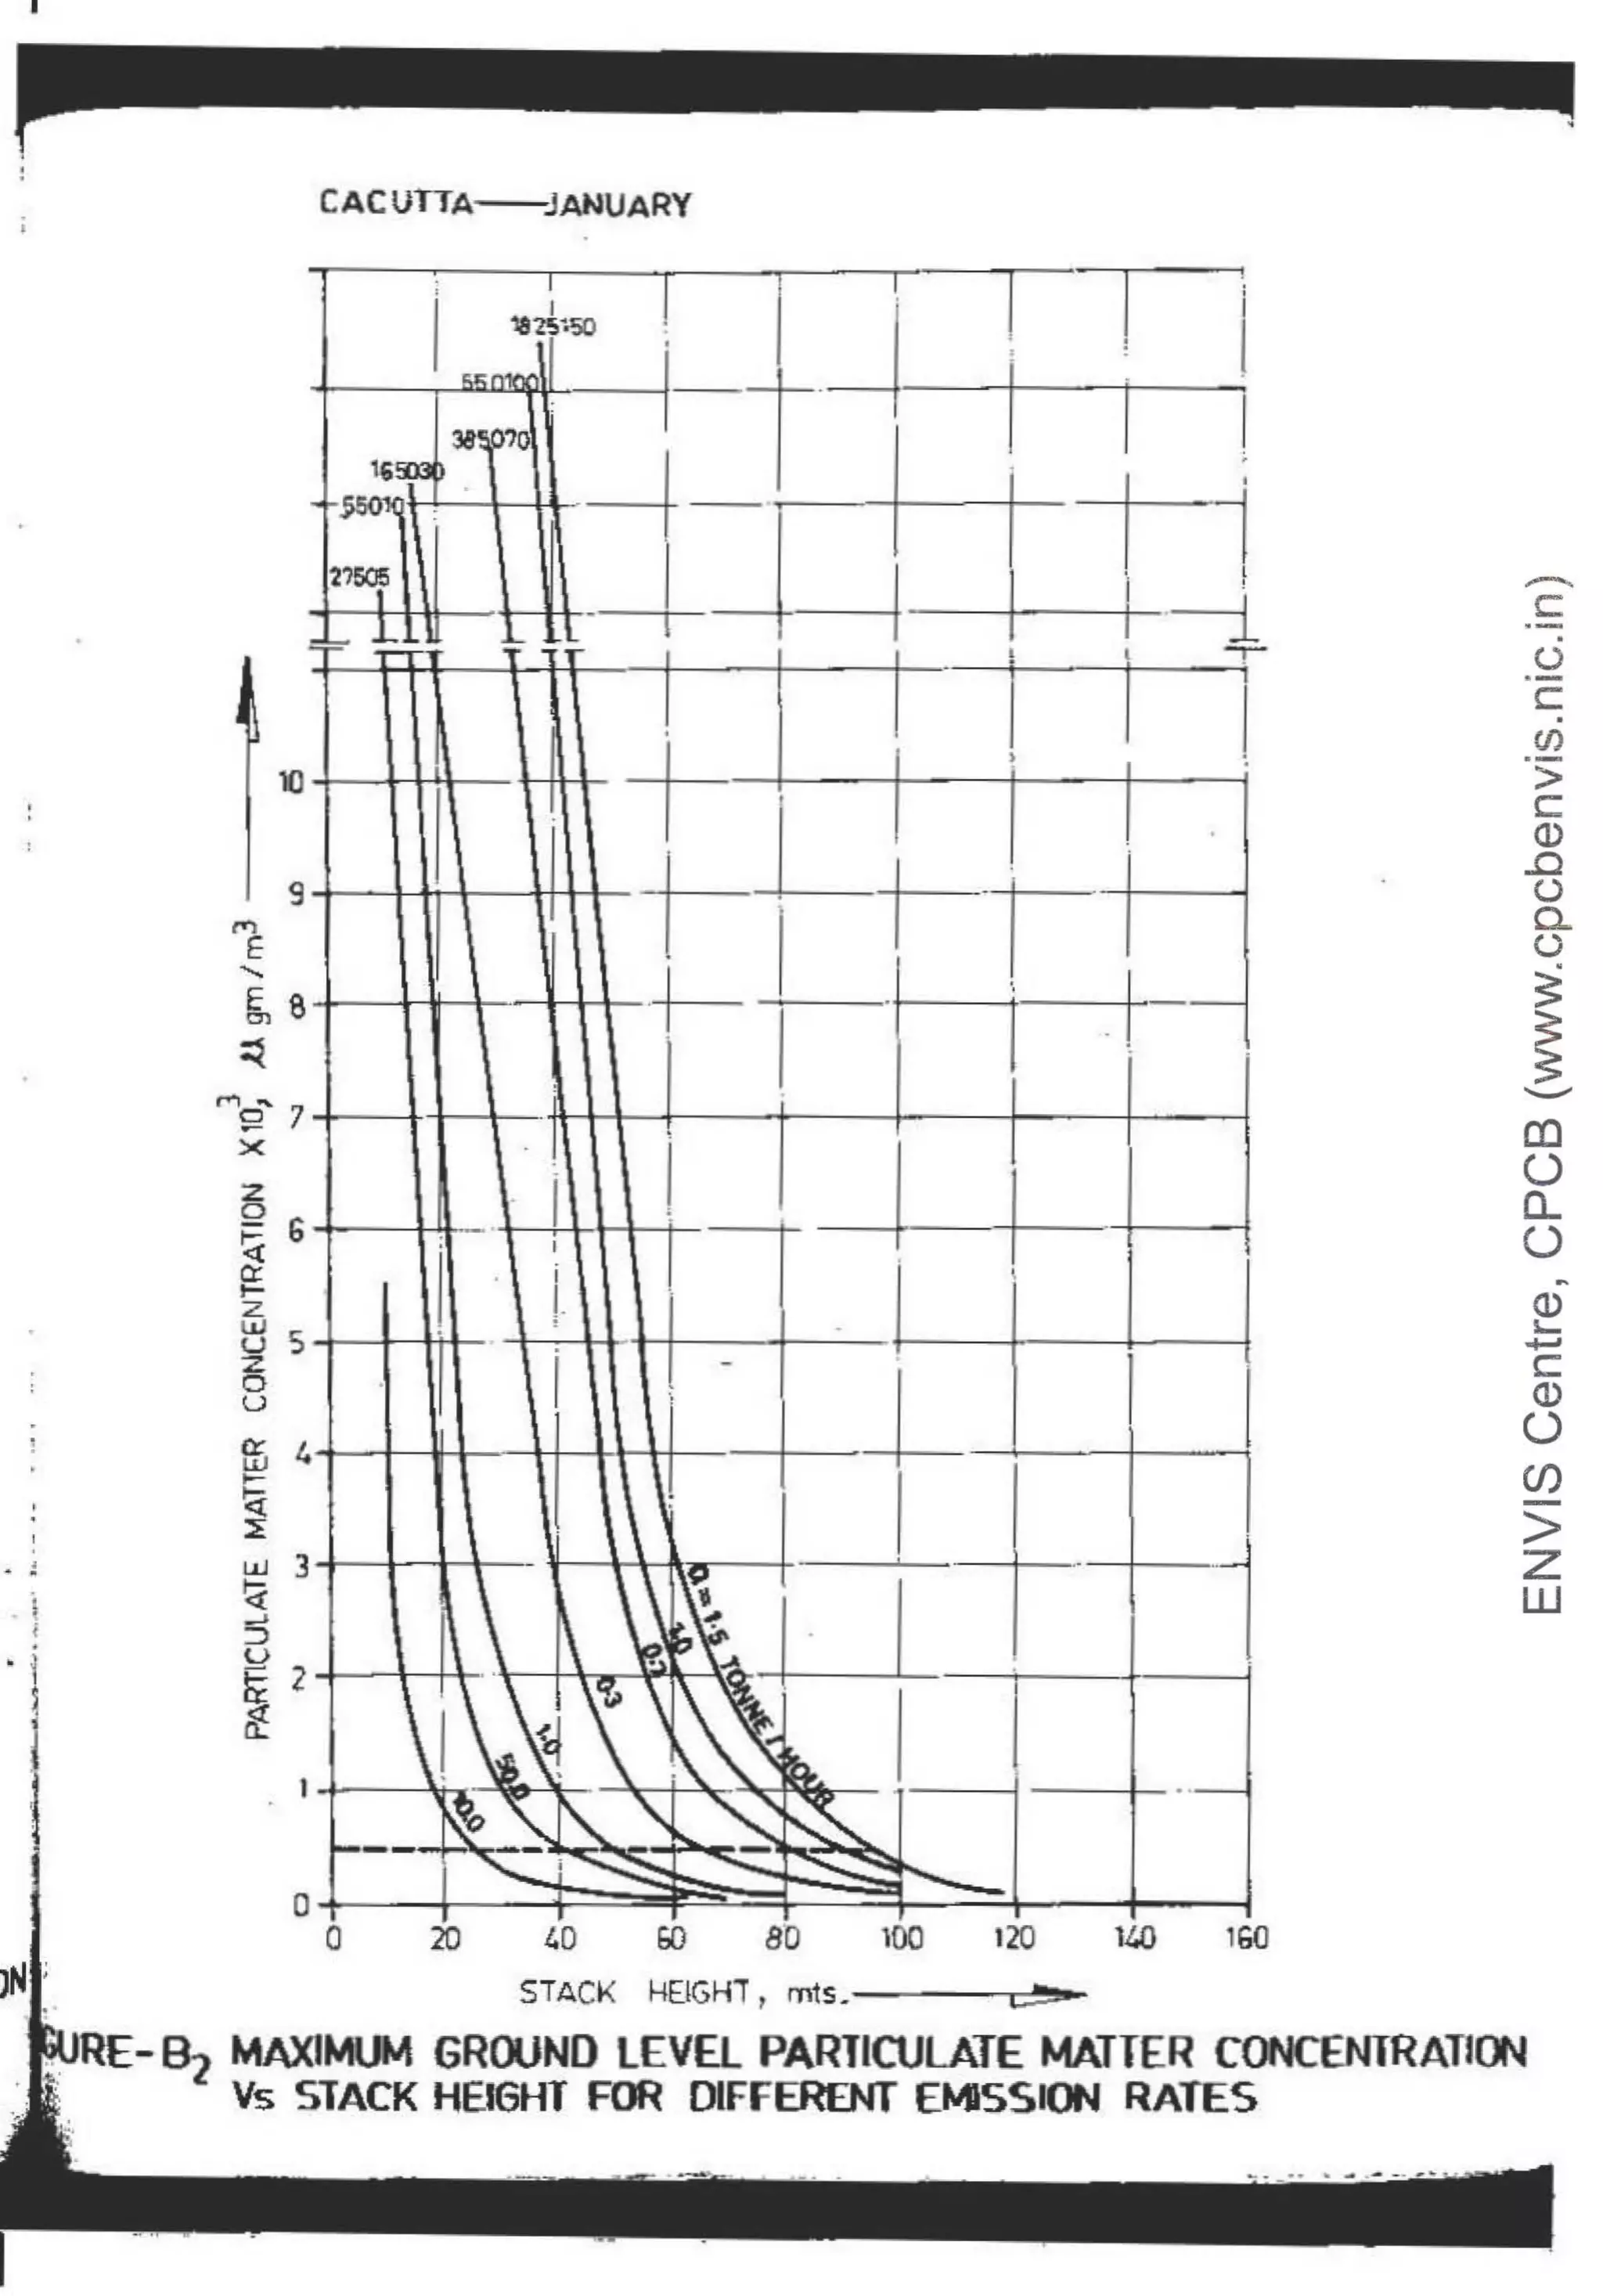
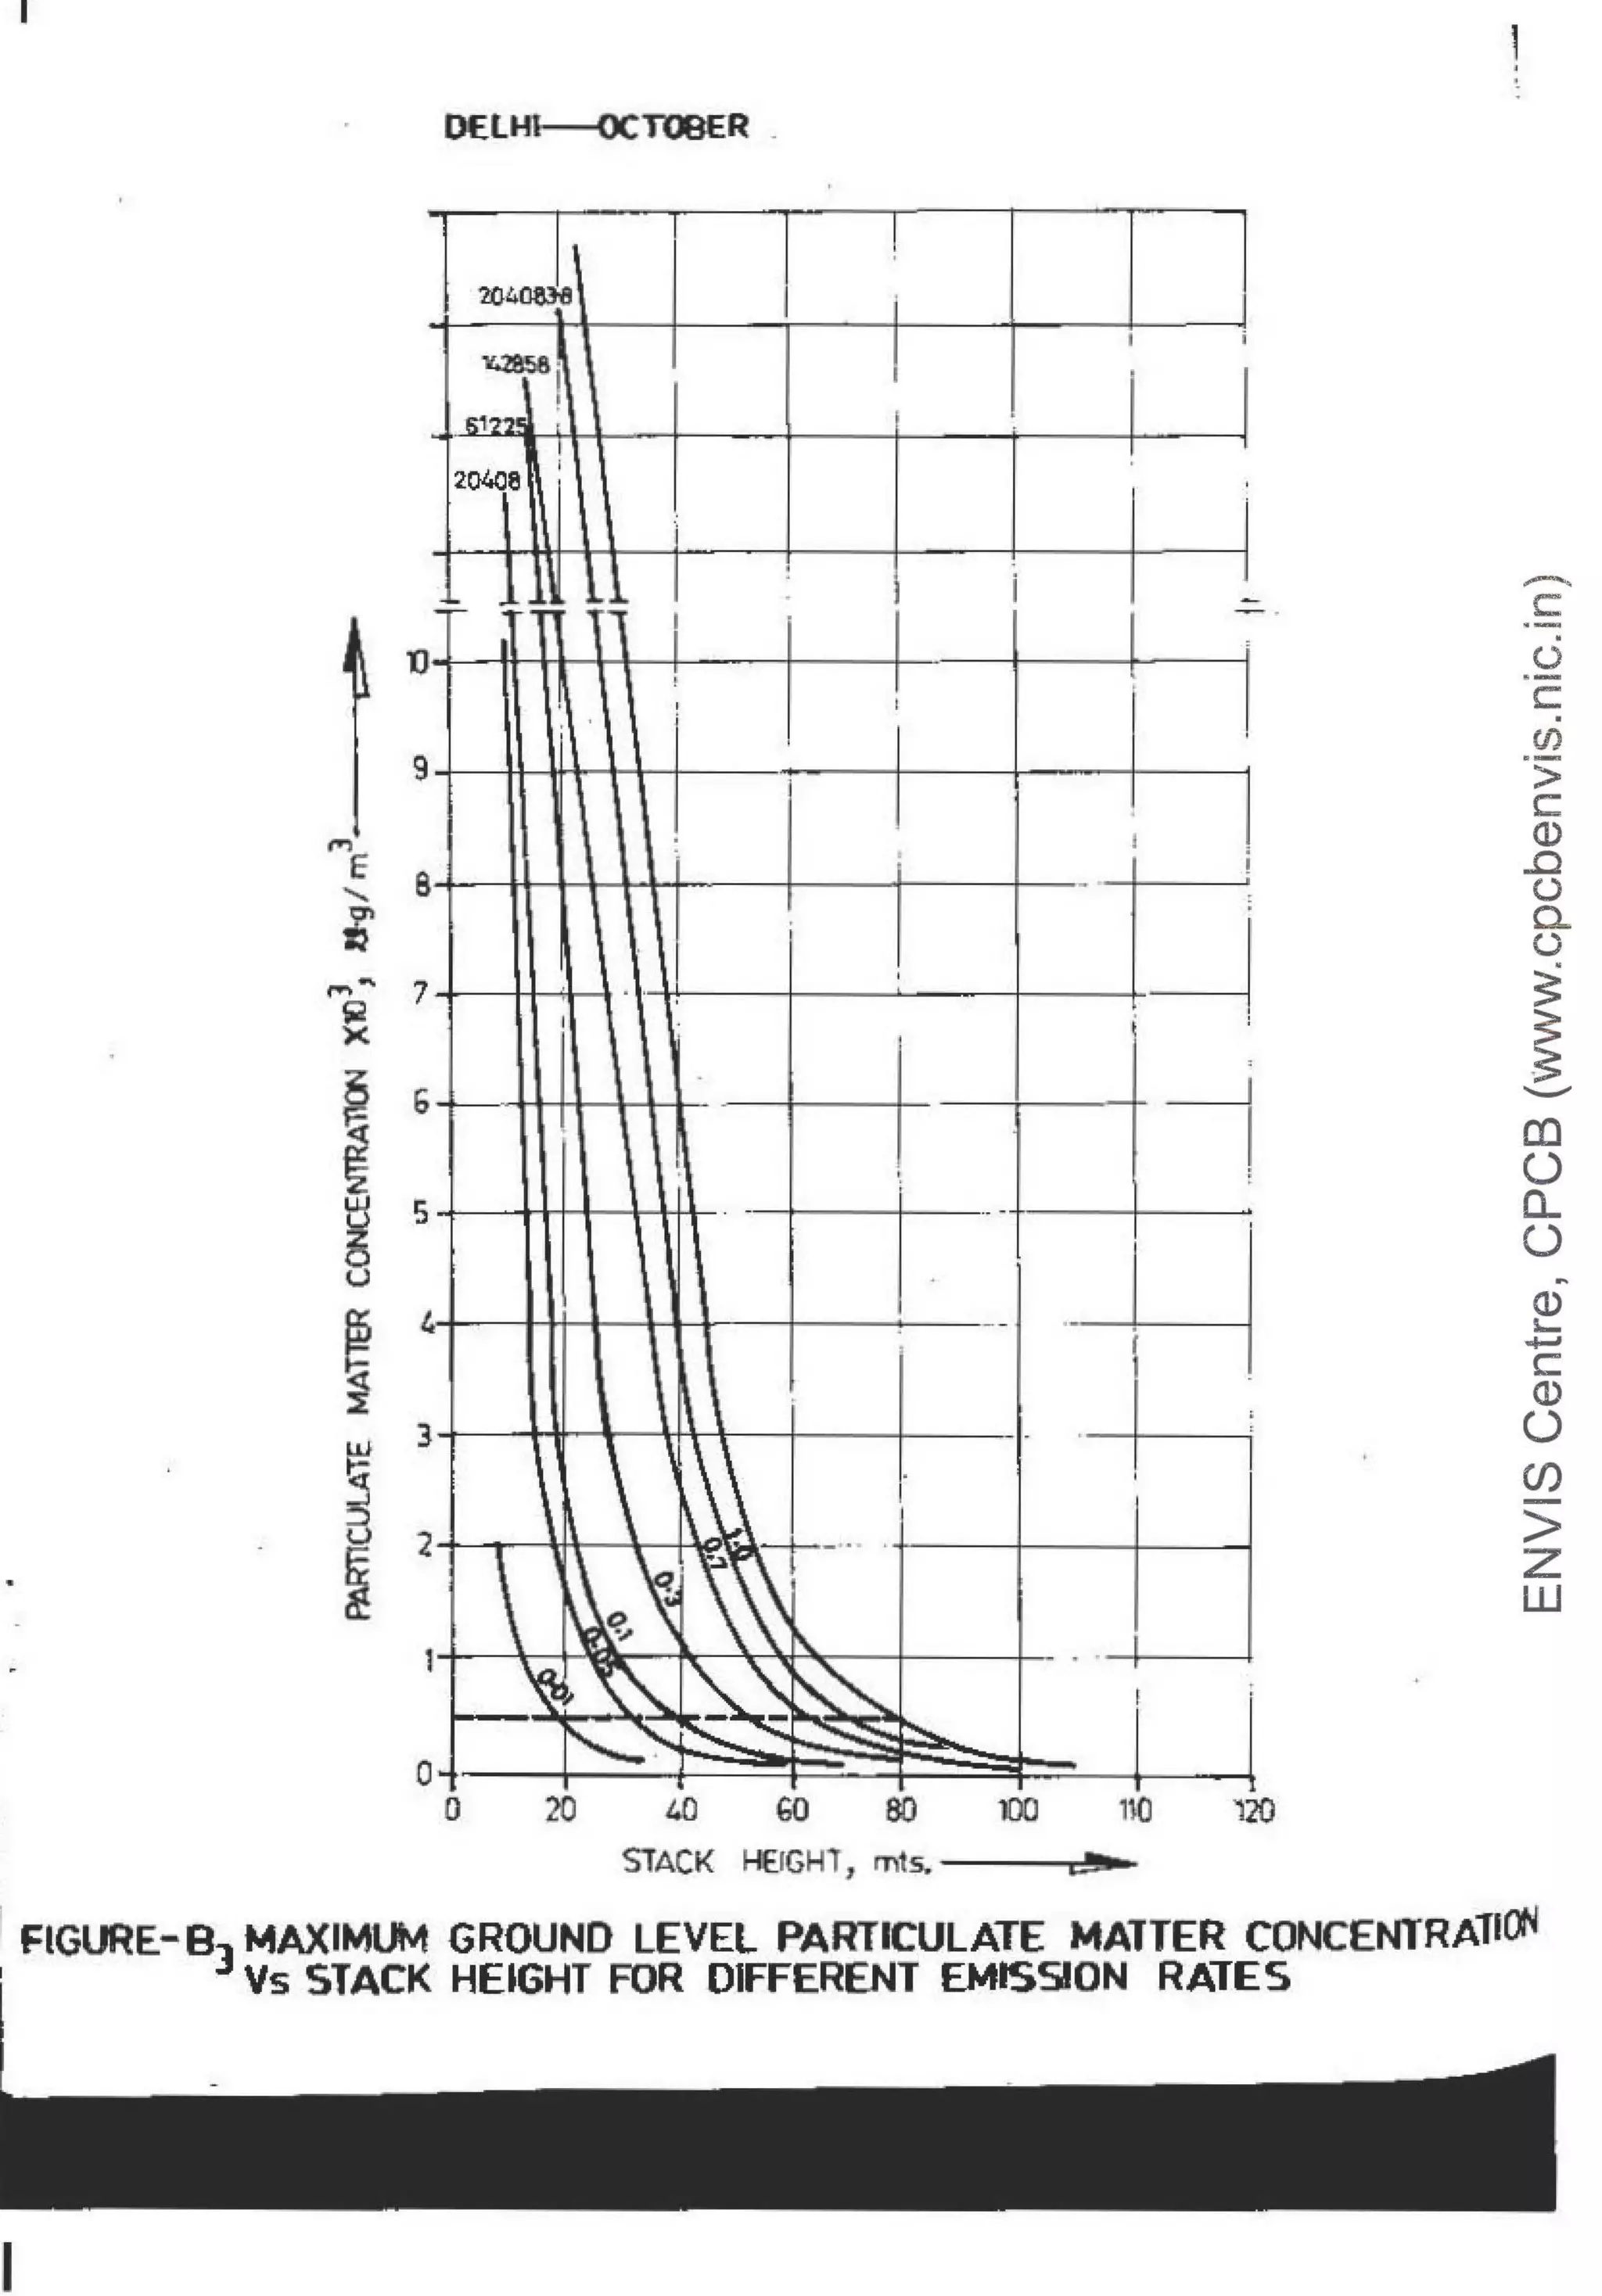
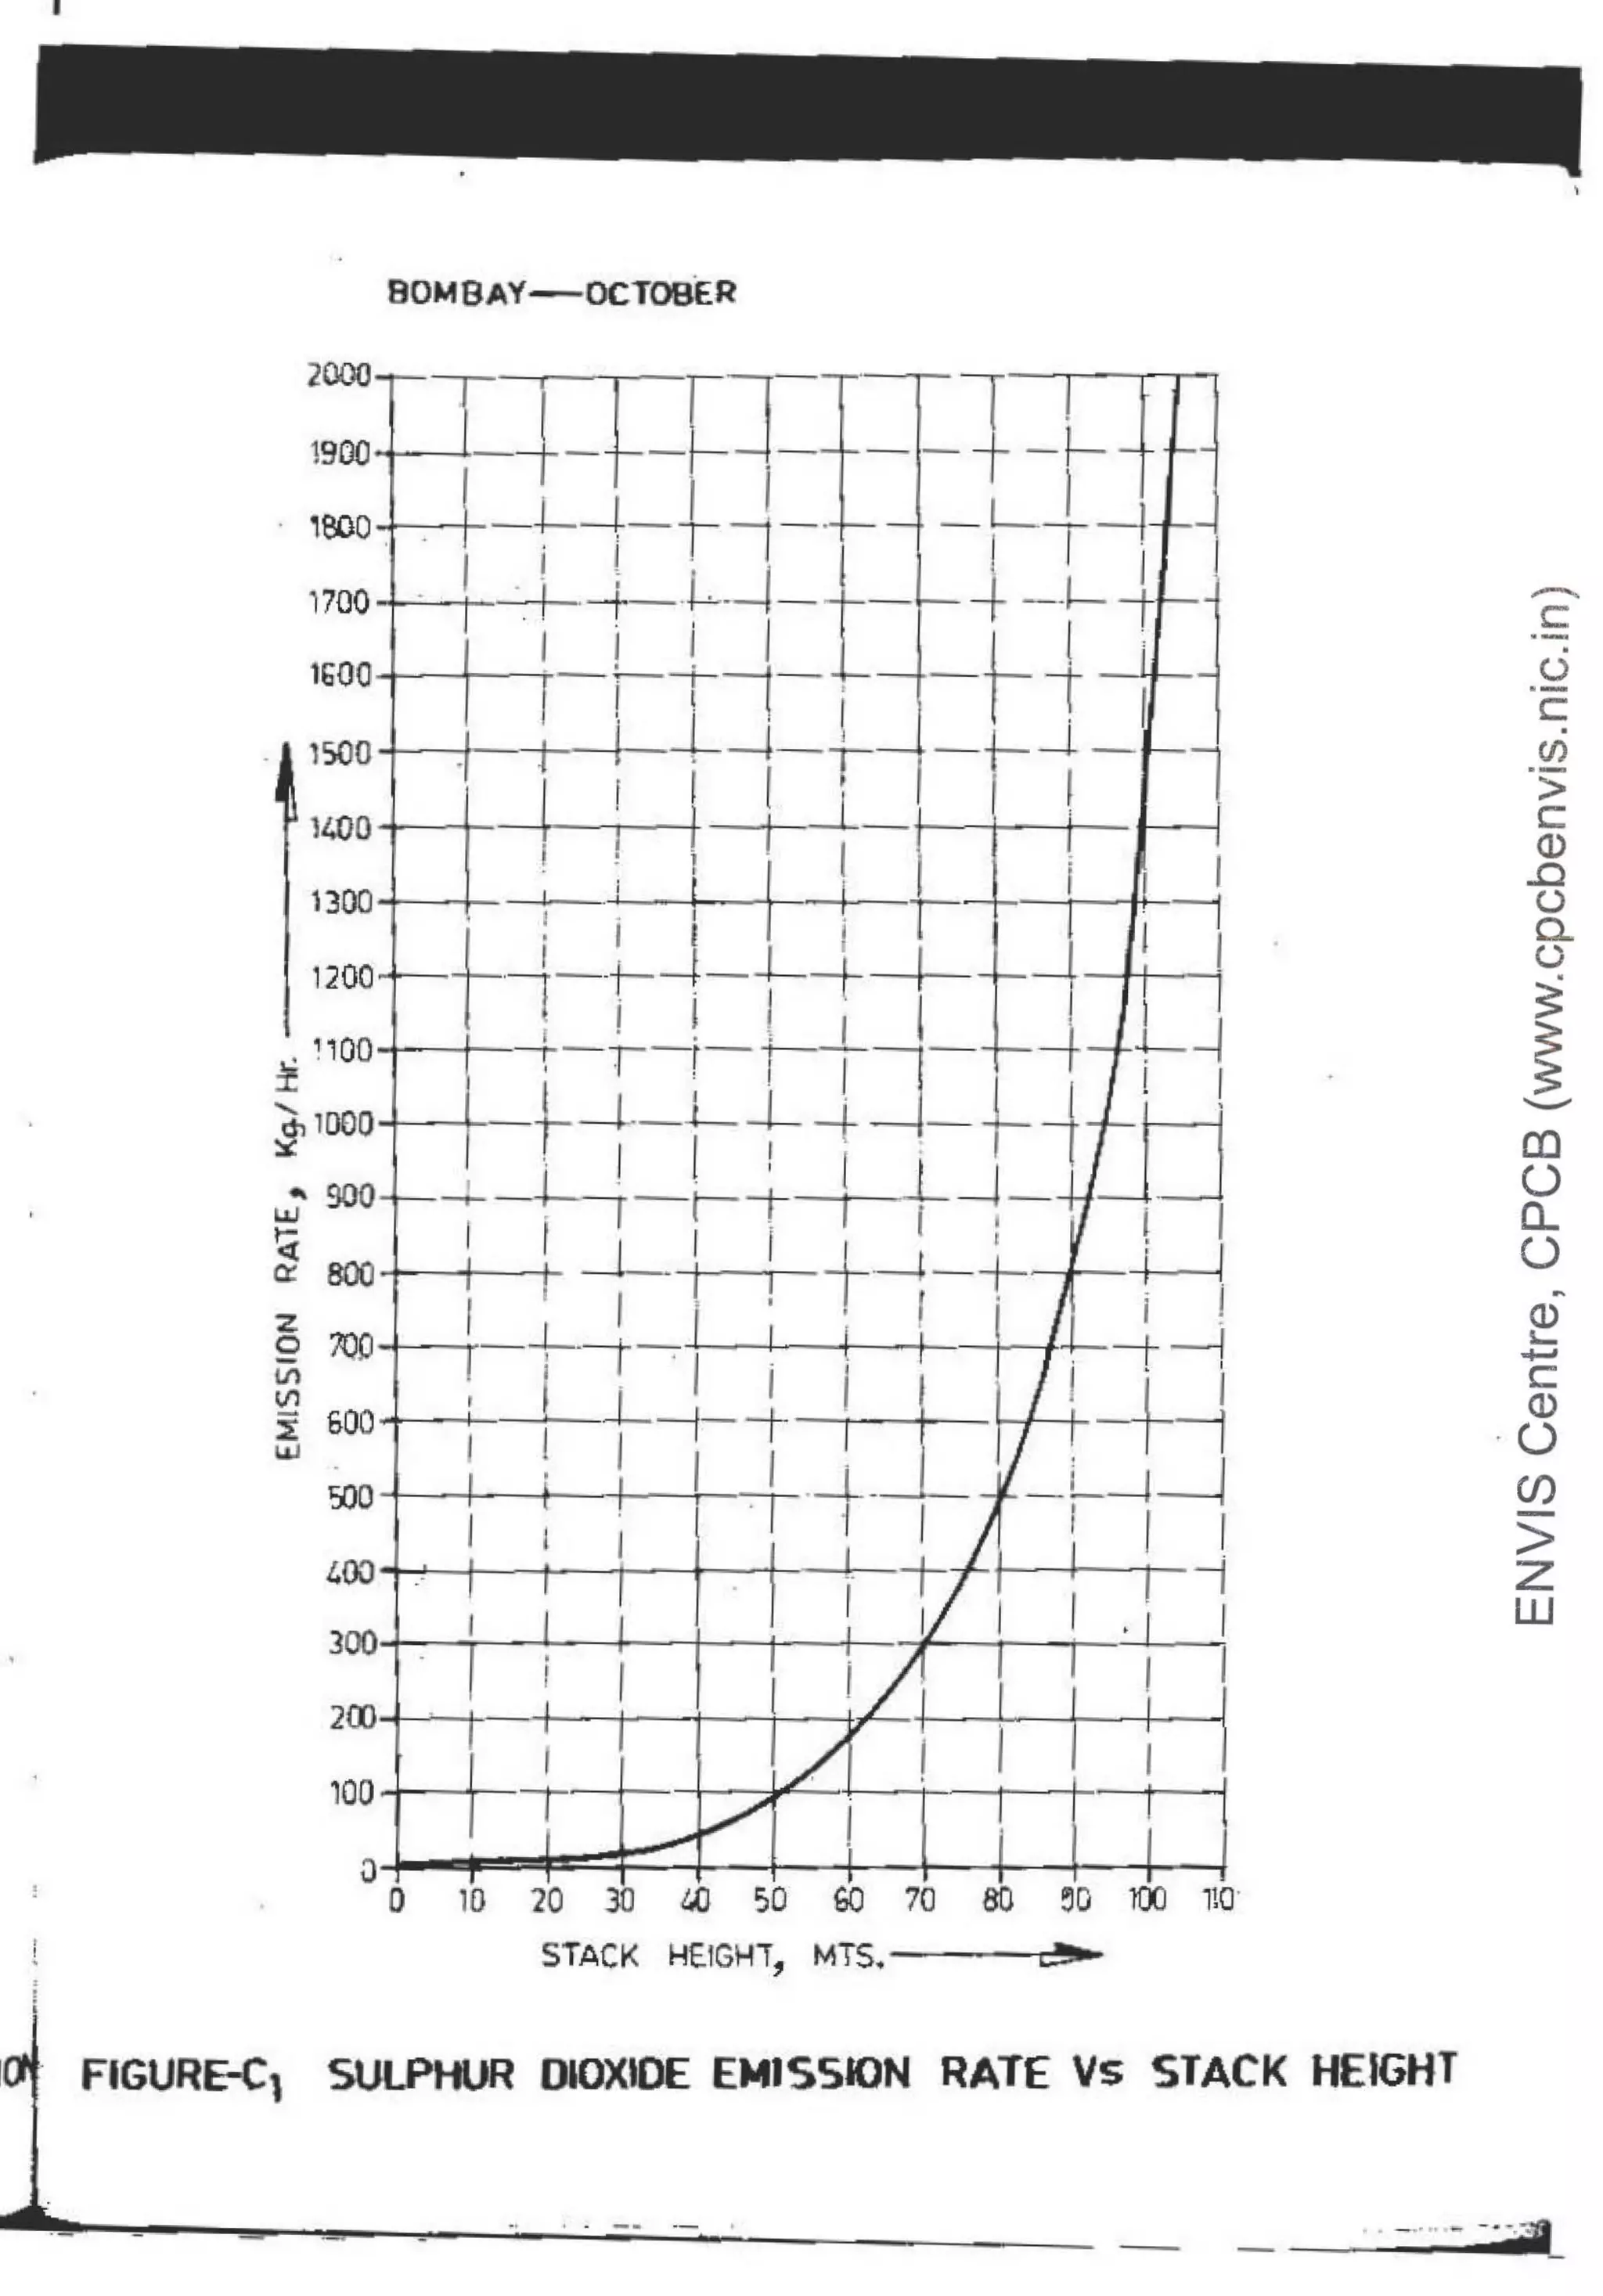
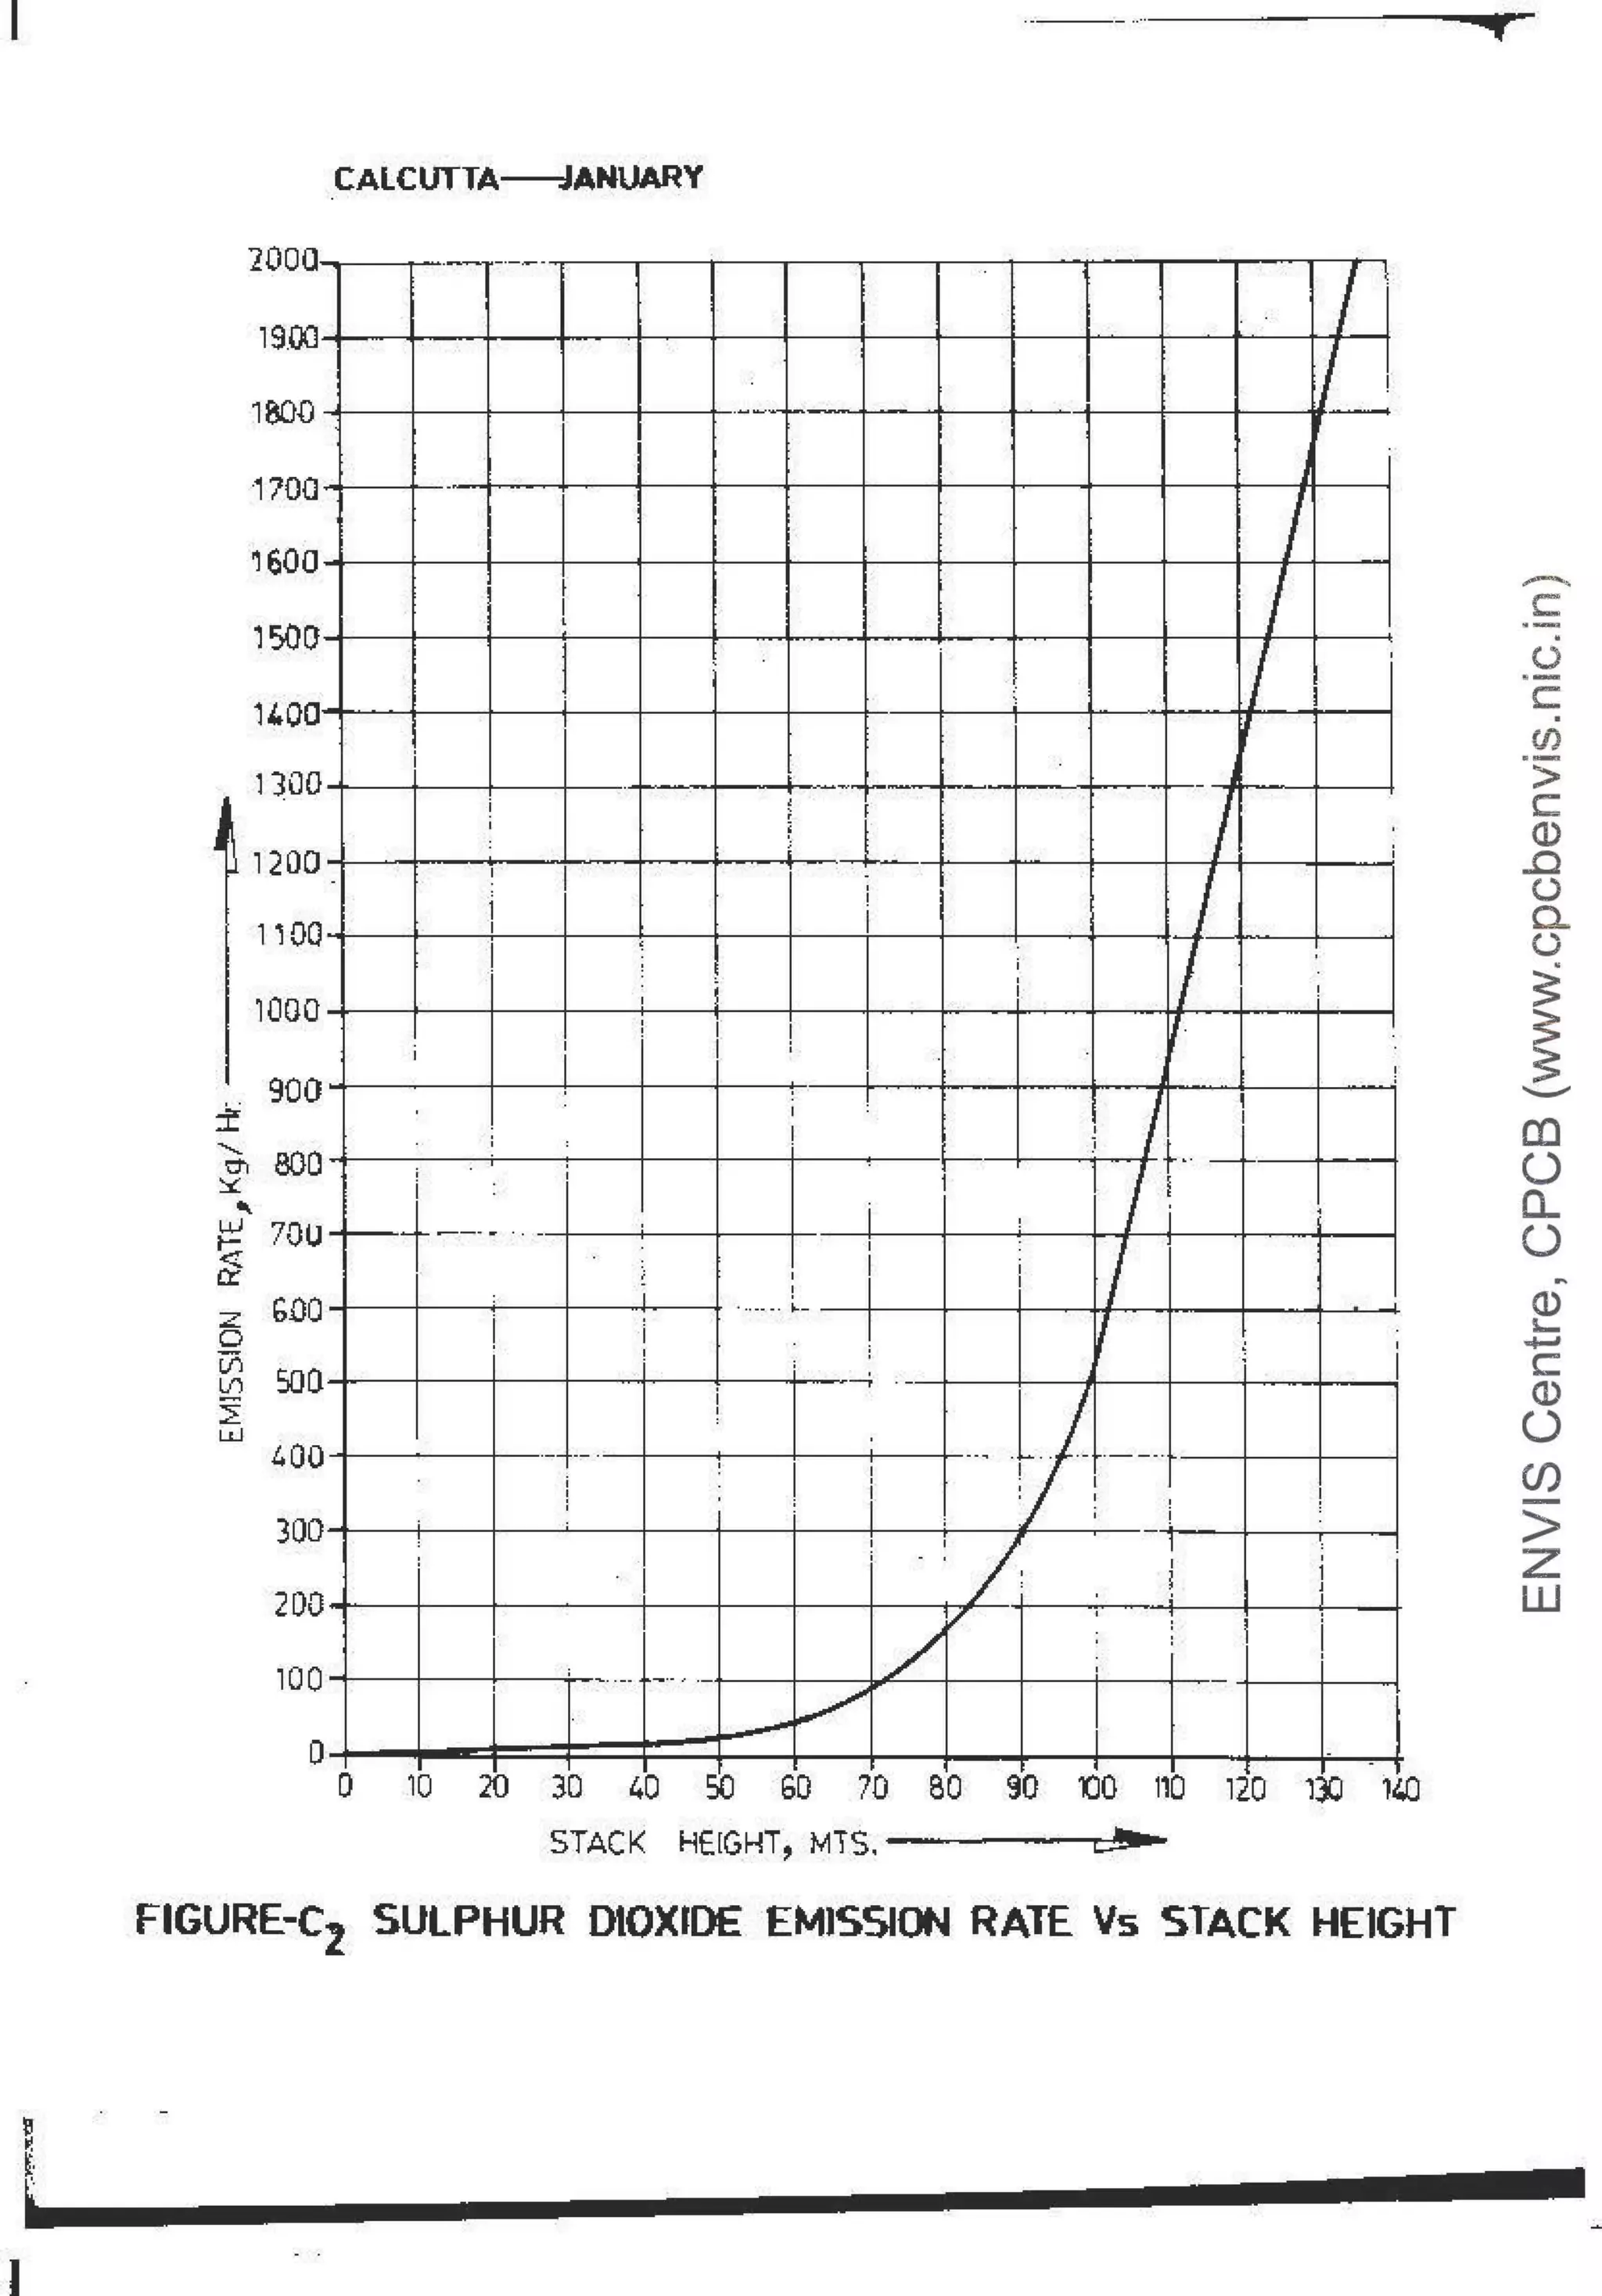
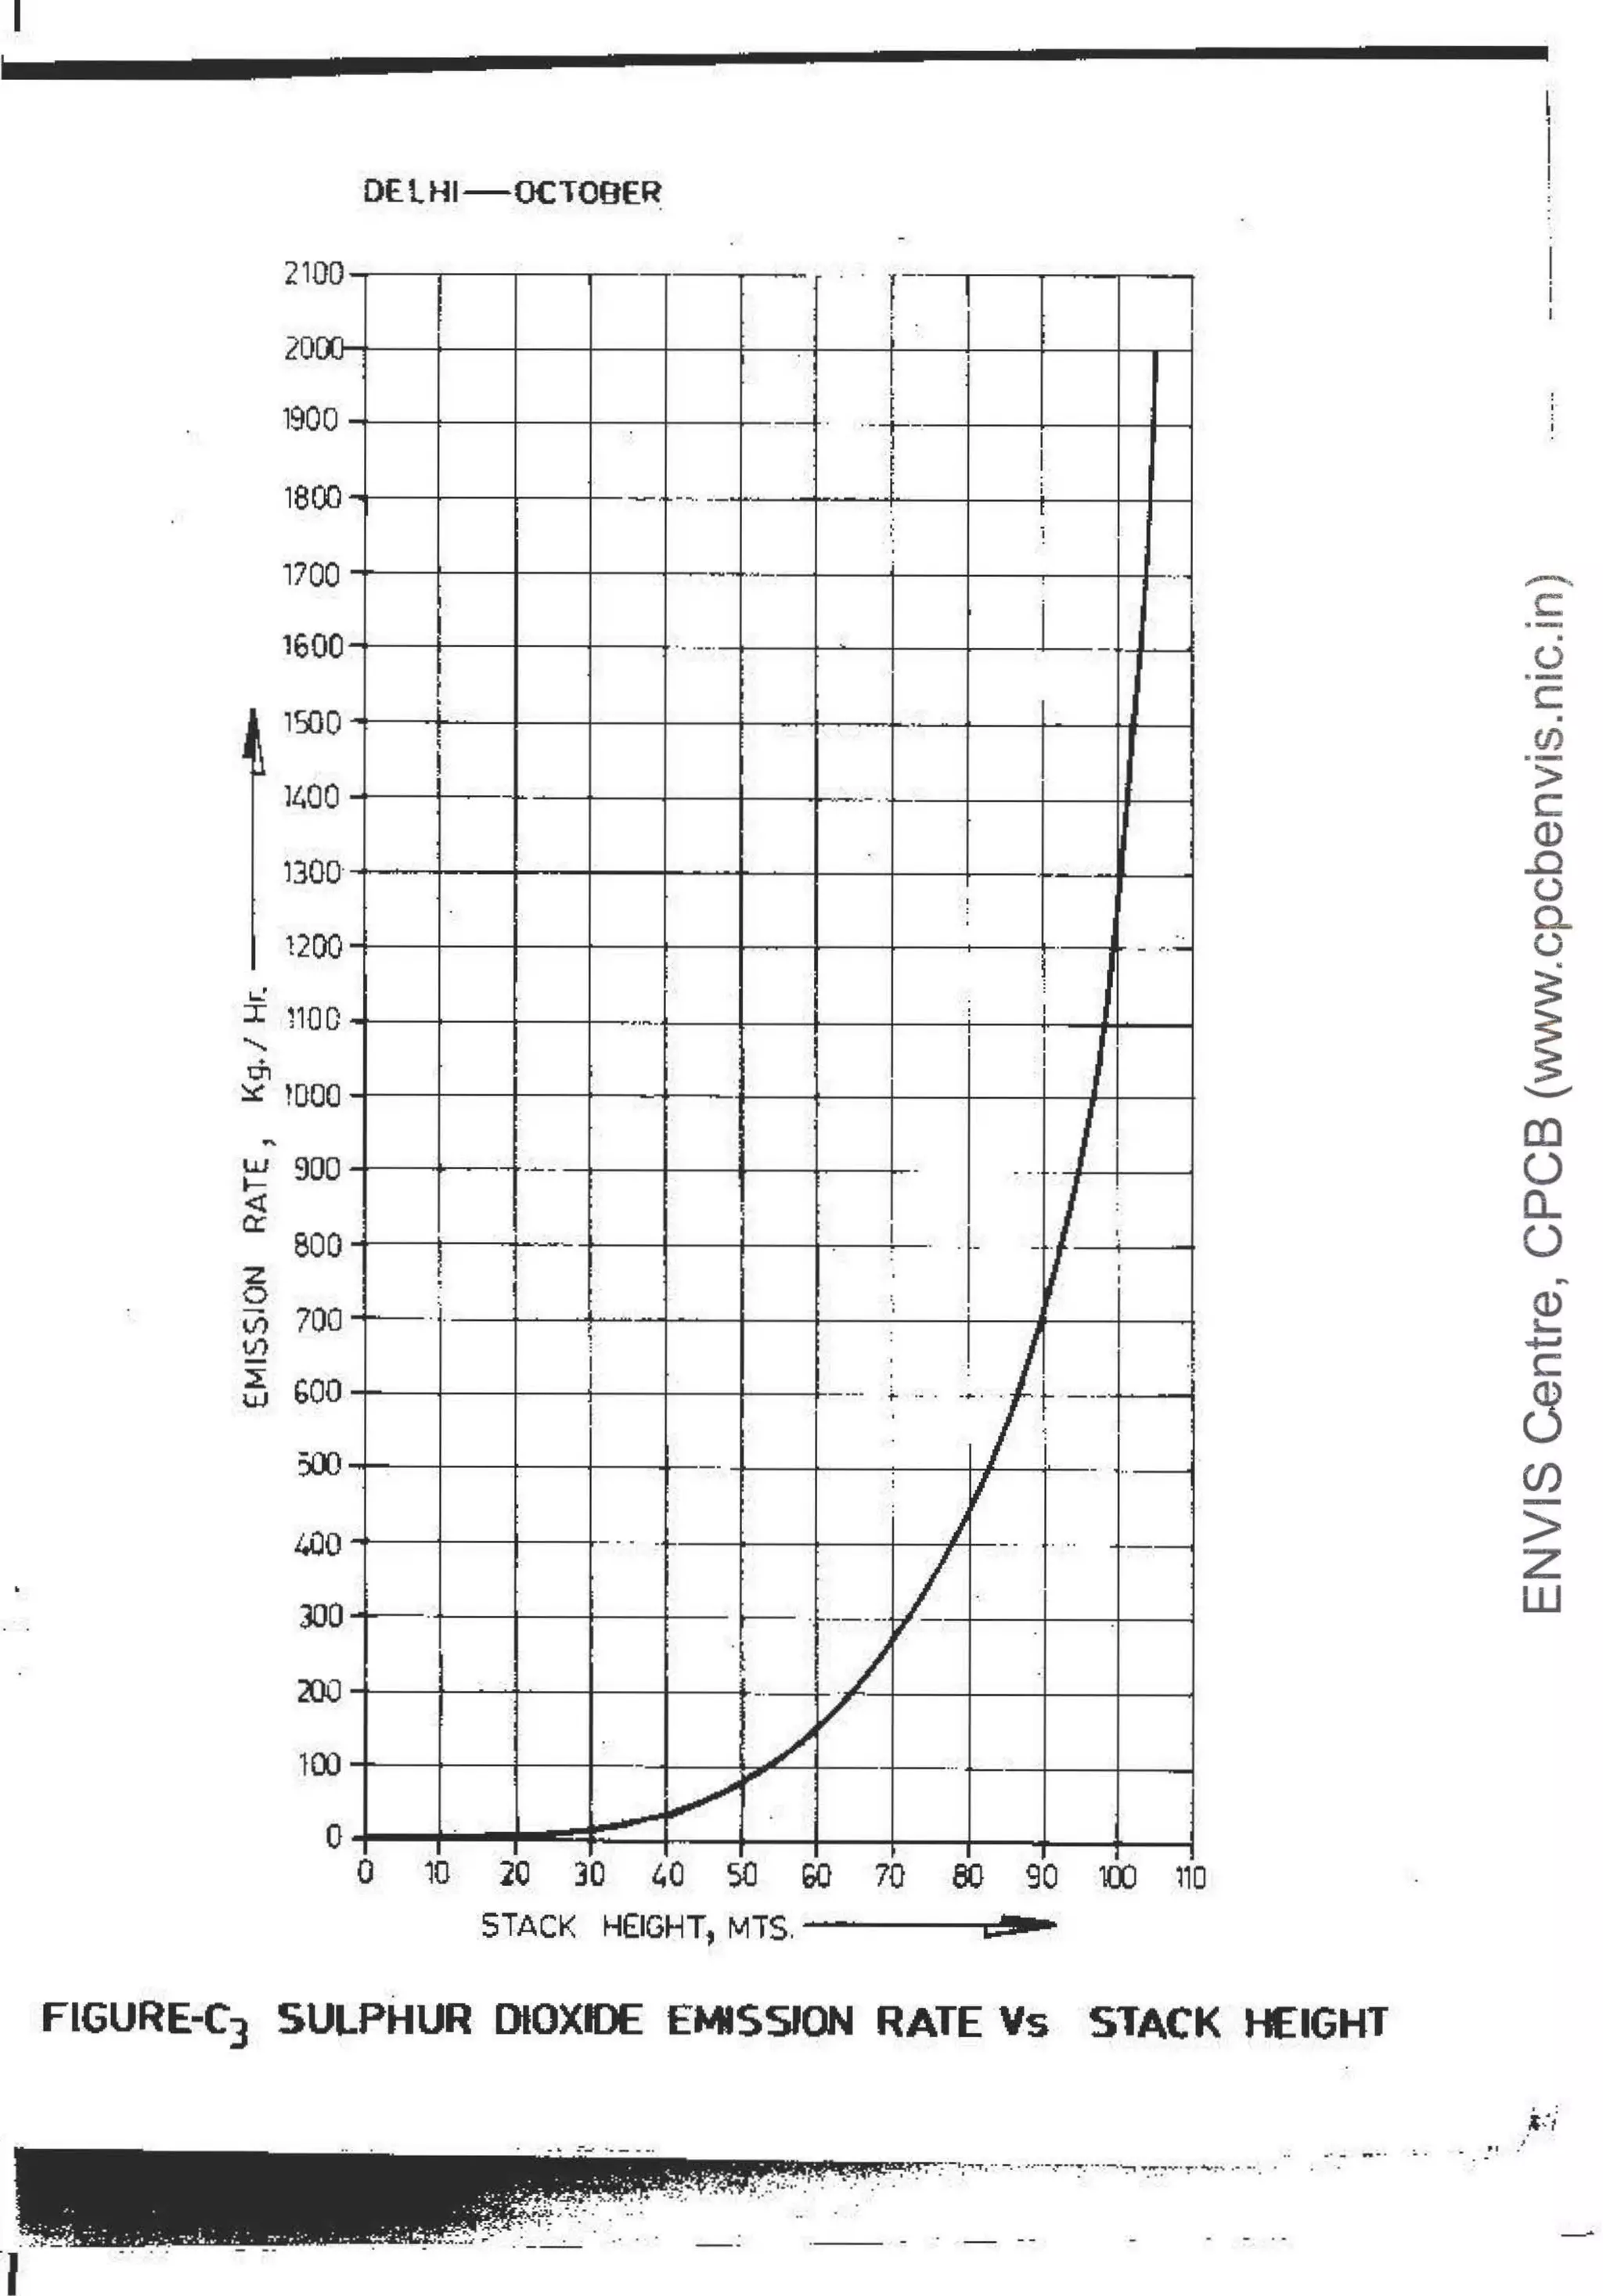
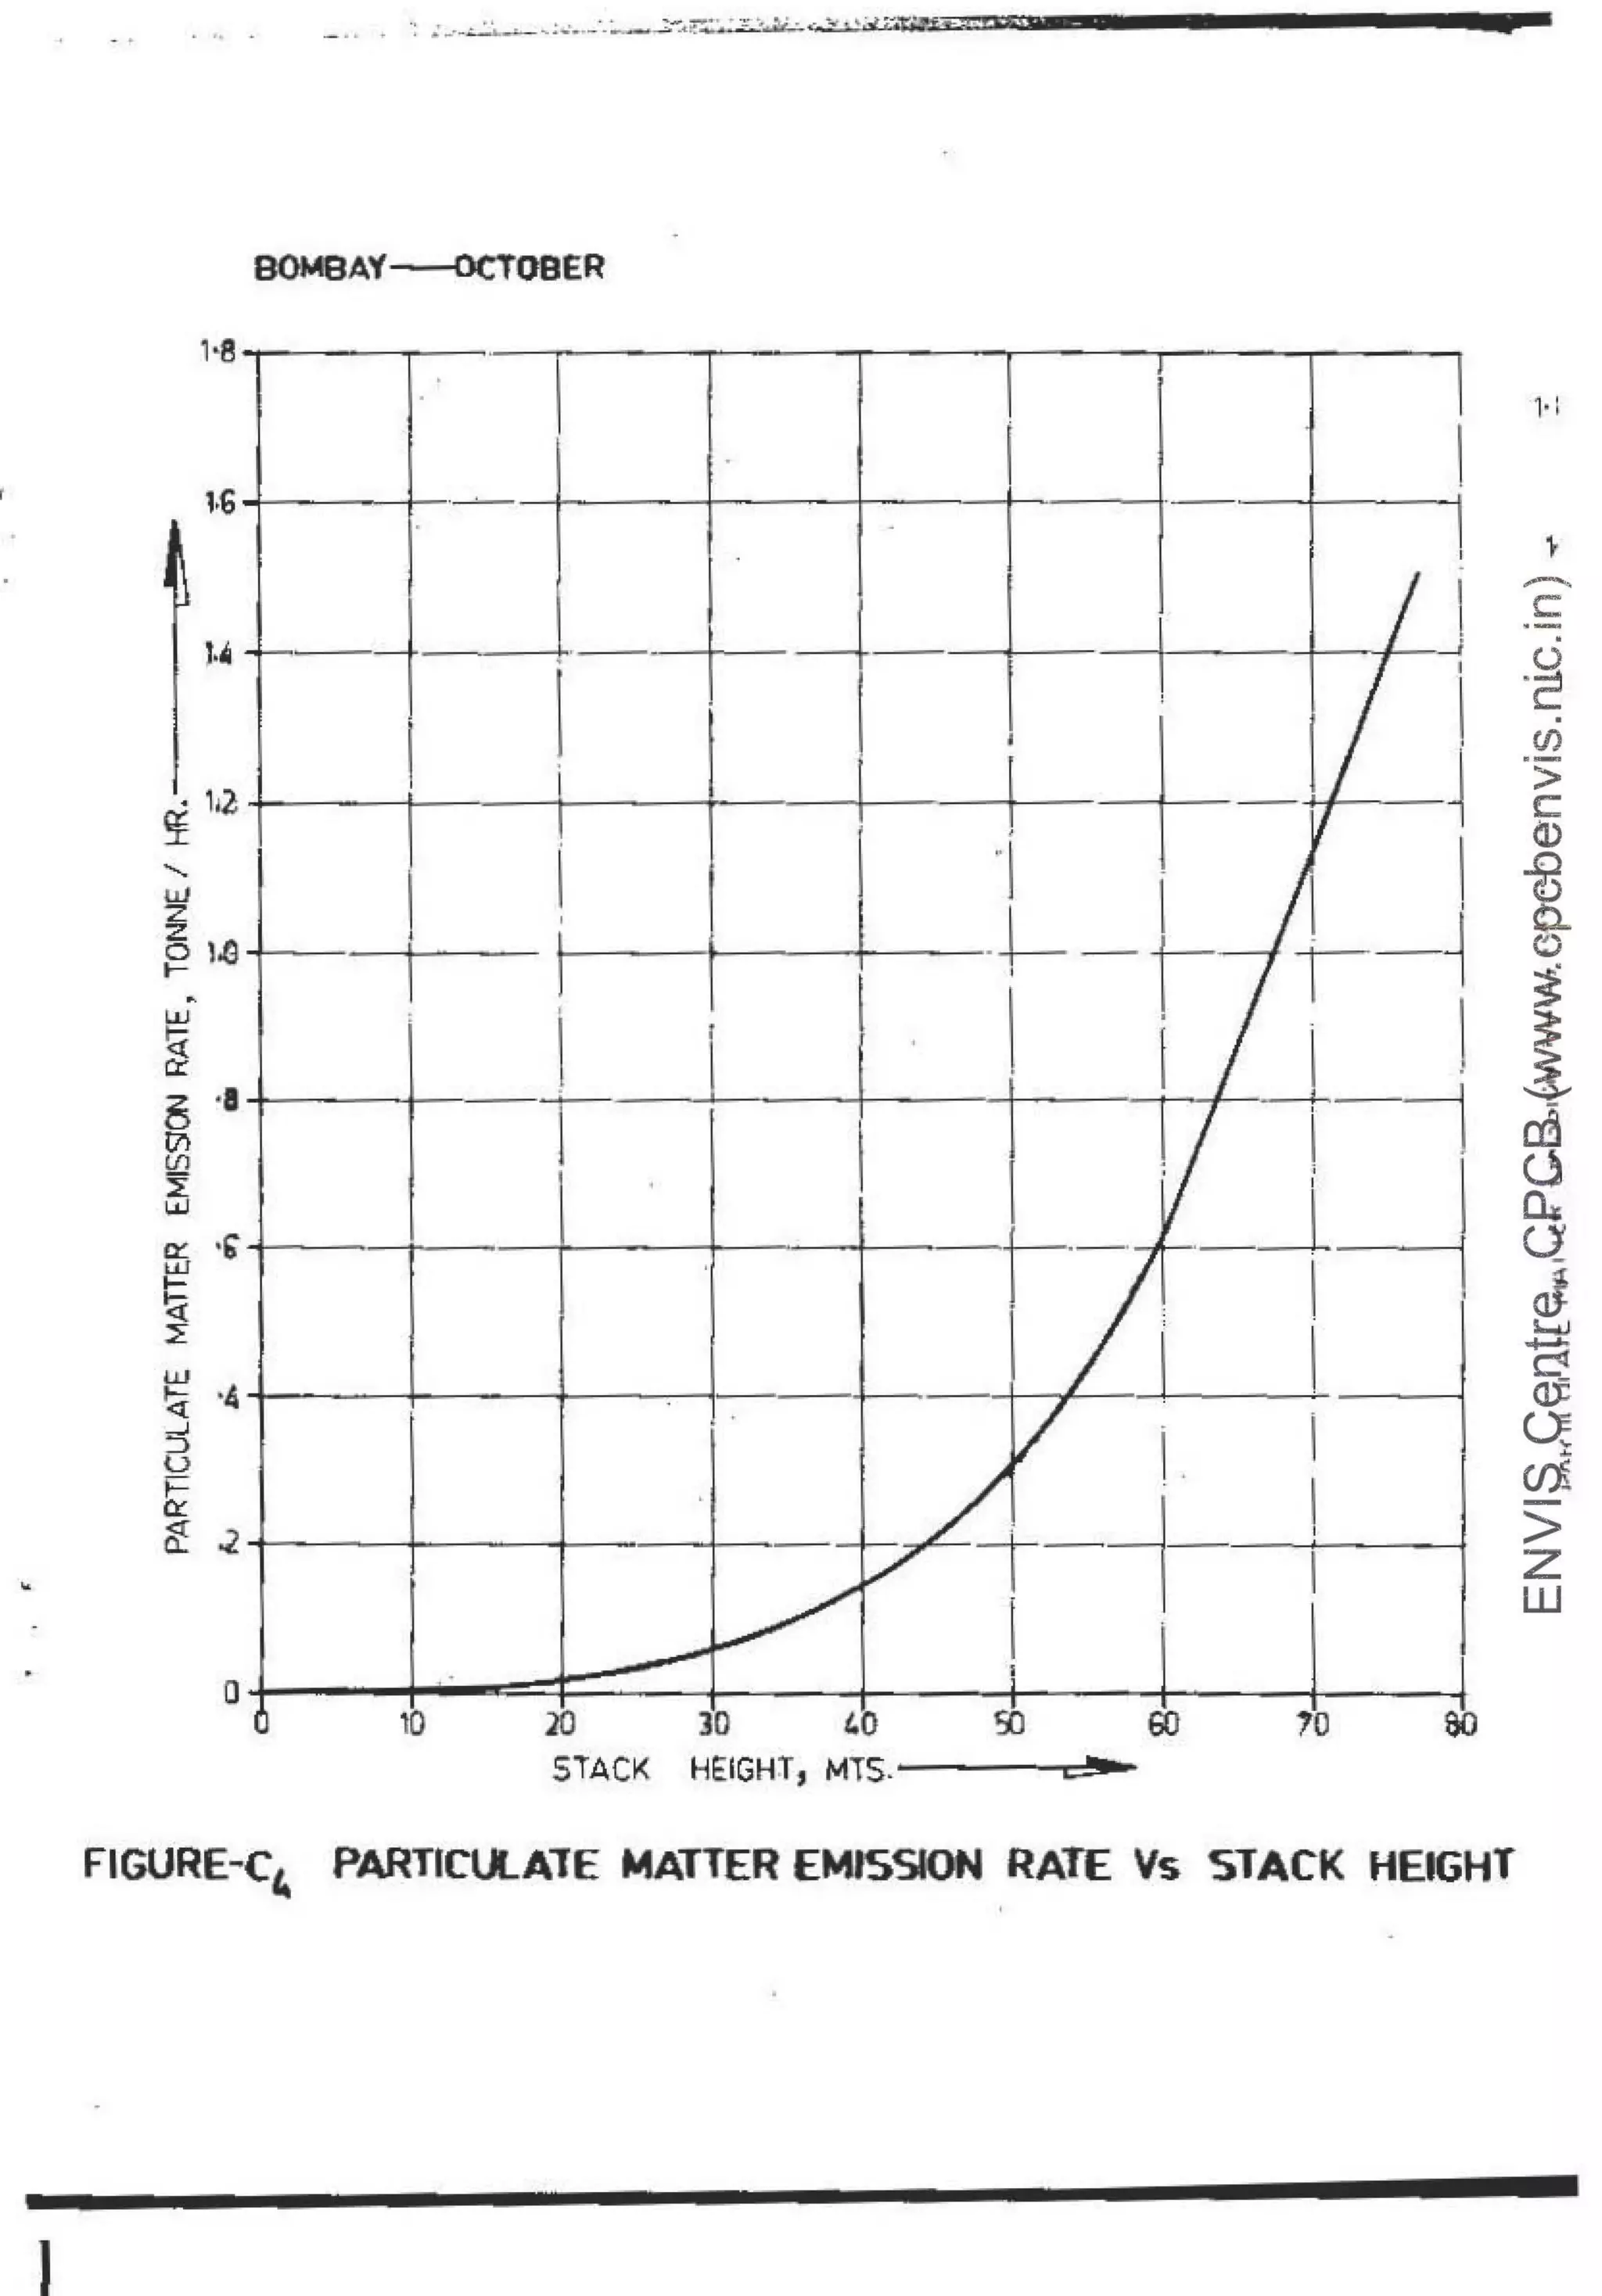
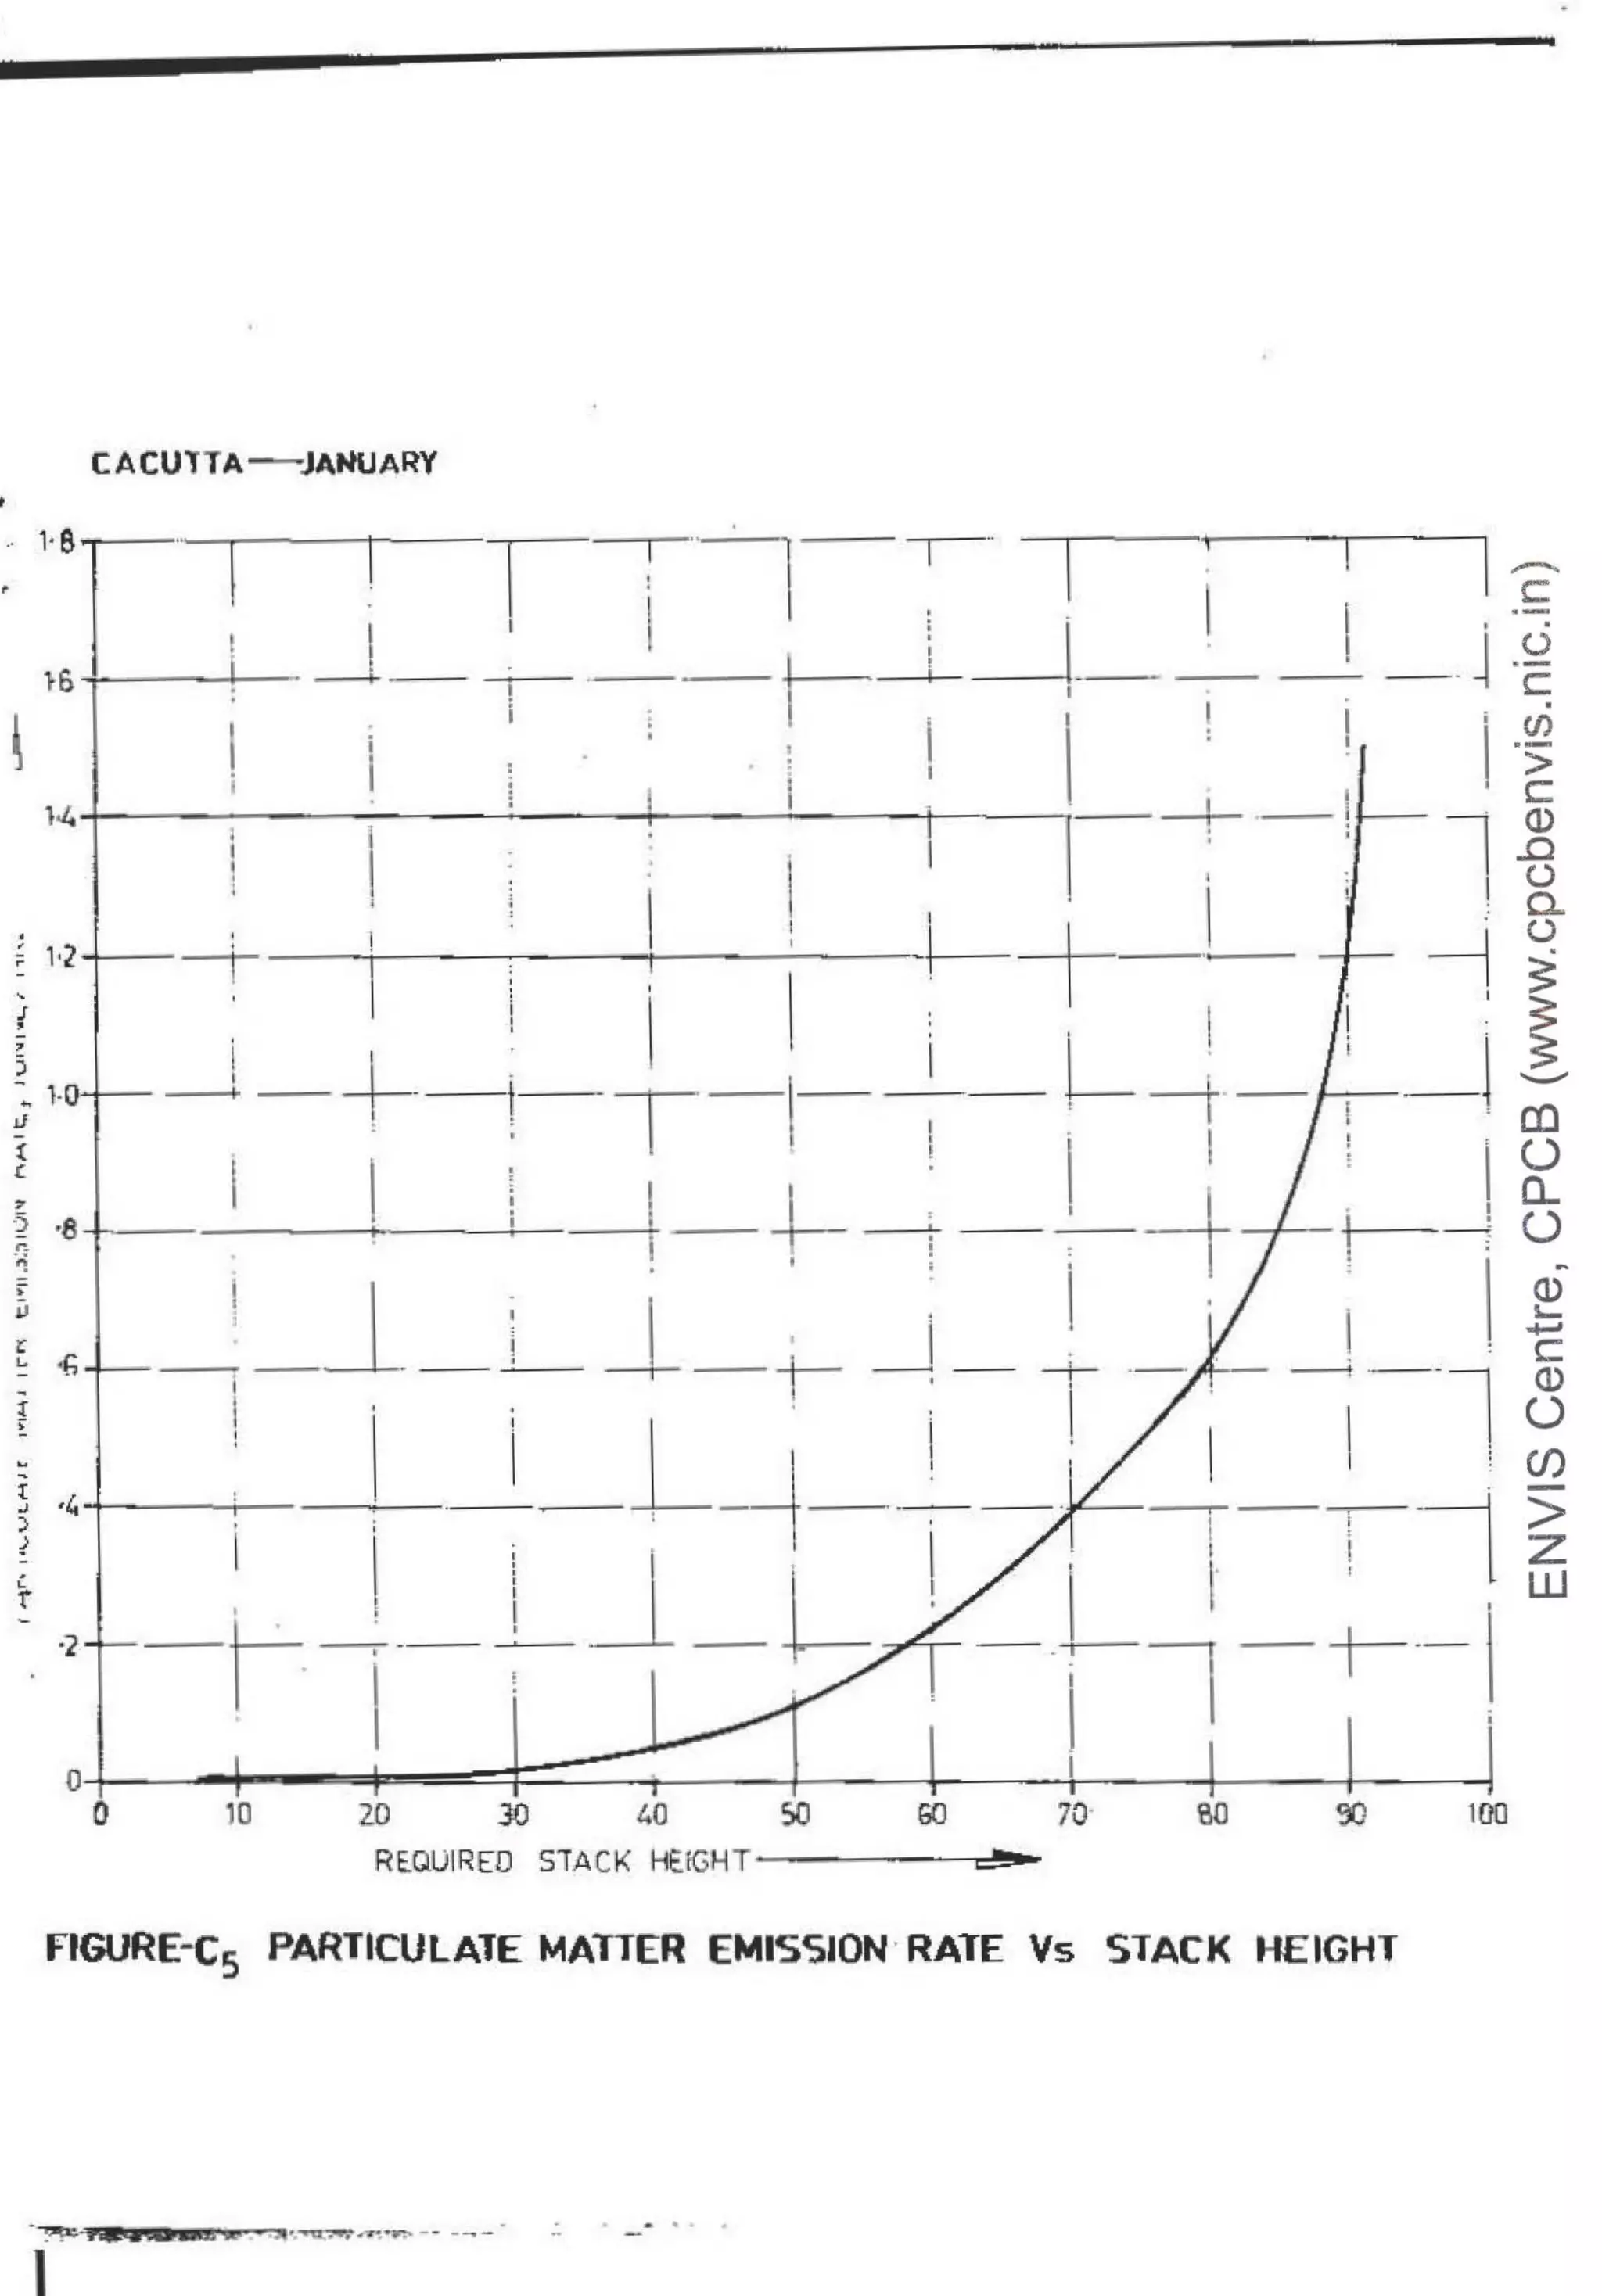
The document provides a method to determine minimum stack heights based on emission rates of pollutants and meteorological conditions. It analyzes diurnal mixing depths in 3 cities to determine baseline heights. It then uses a Gaussian plume model to calculate maximum ground level concentrations of sulfur dioxide and particulate matter at different stack heights and emission rates. From this, it derives simple equations relating stack height to emission rate for each pollutant to meet air quality standards. Expert reviews were considered and minimum stack height guidelines were adopted, including minimum heights for industrial and power plant stacks.

![ENVIS Centre, CPCB (wWw.cpcbenvis.nic.in)
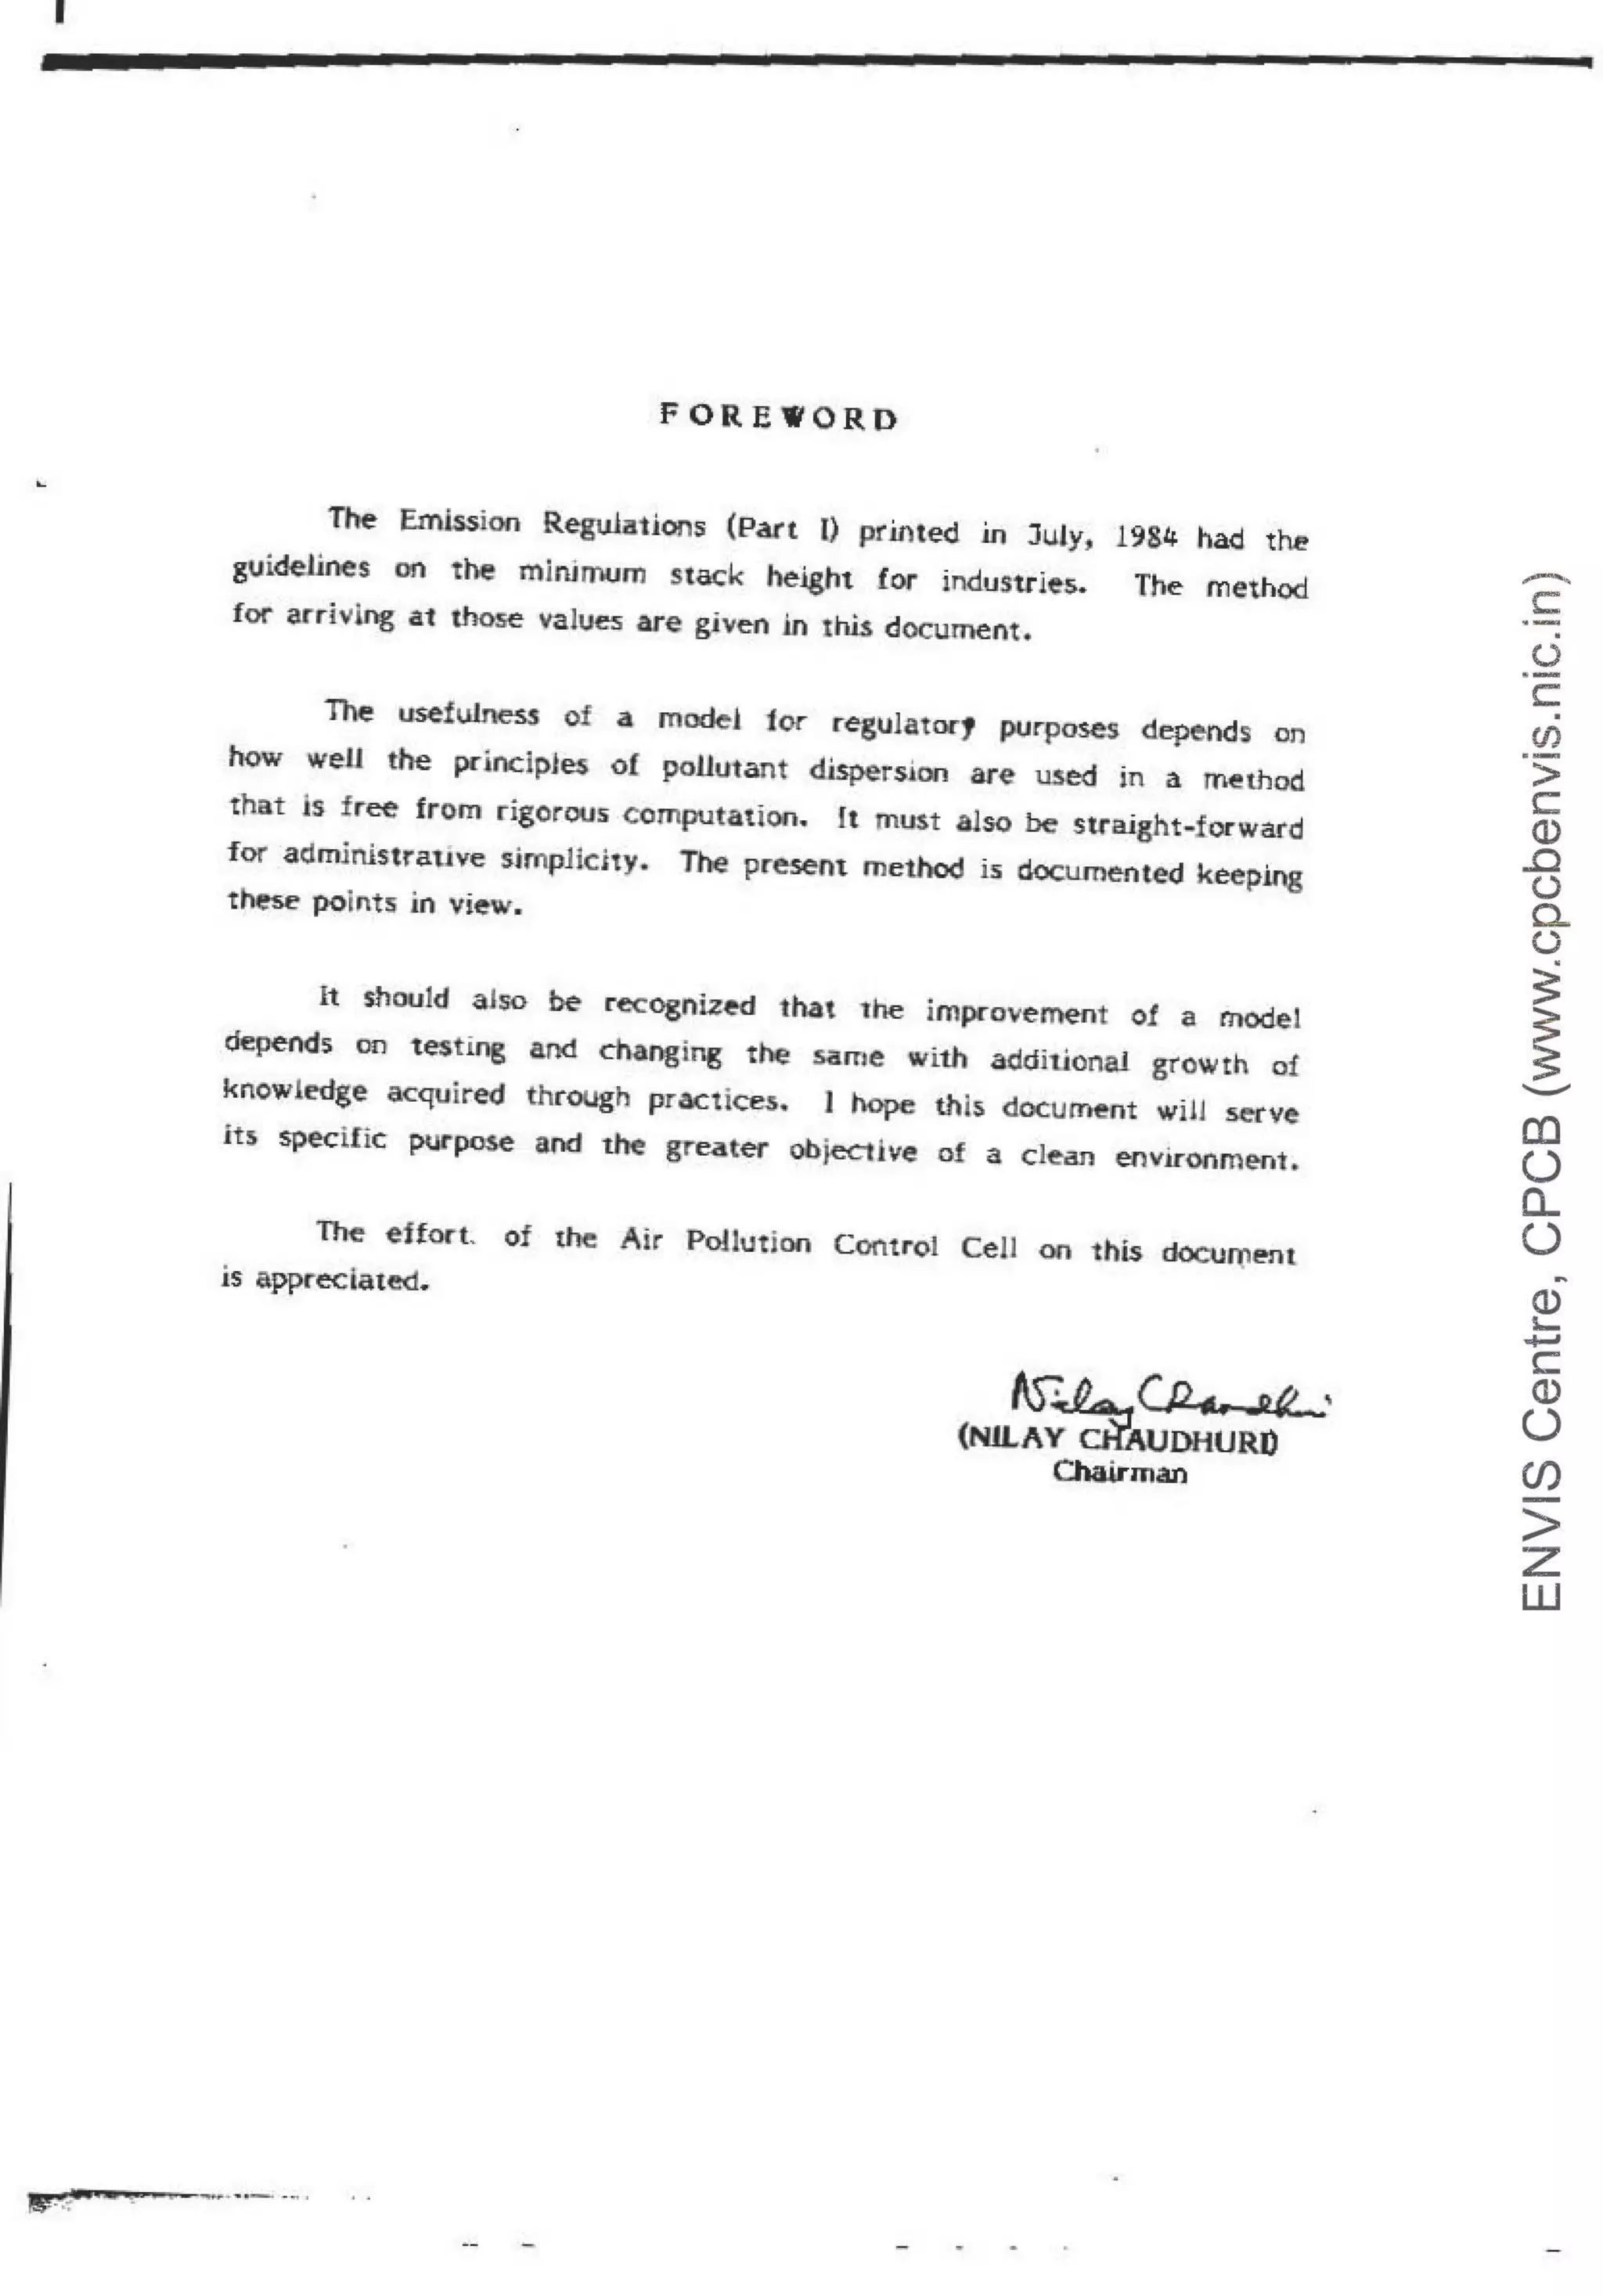
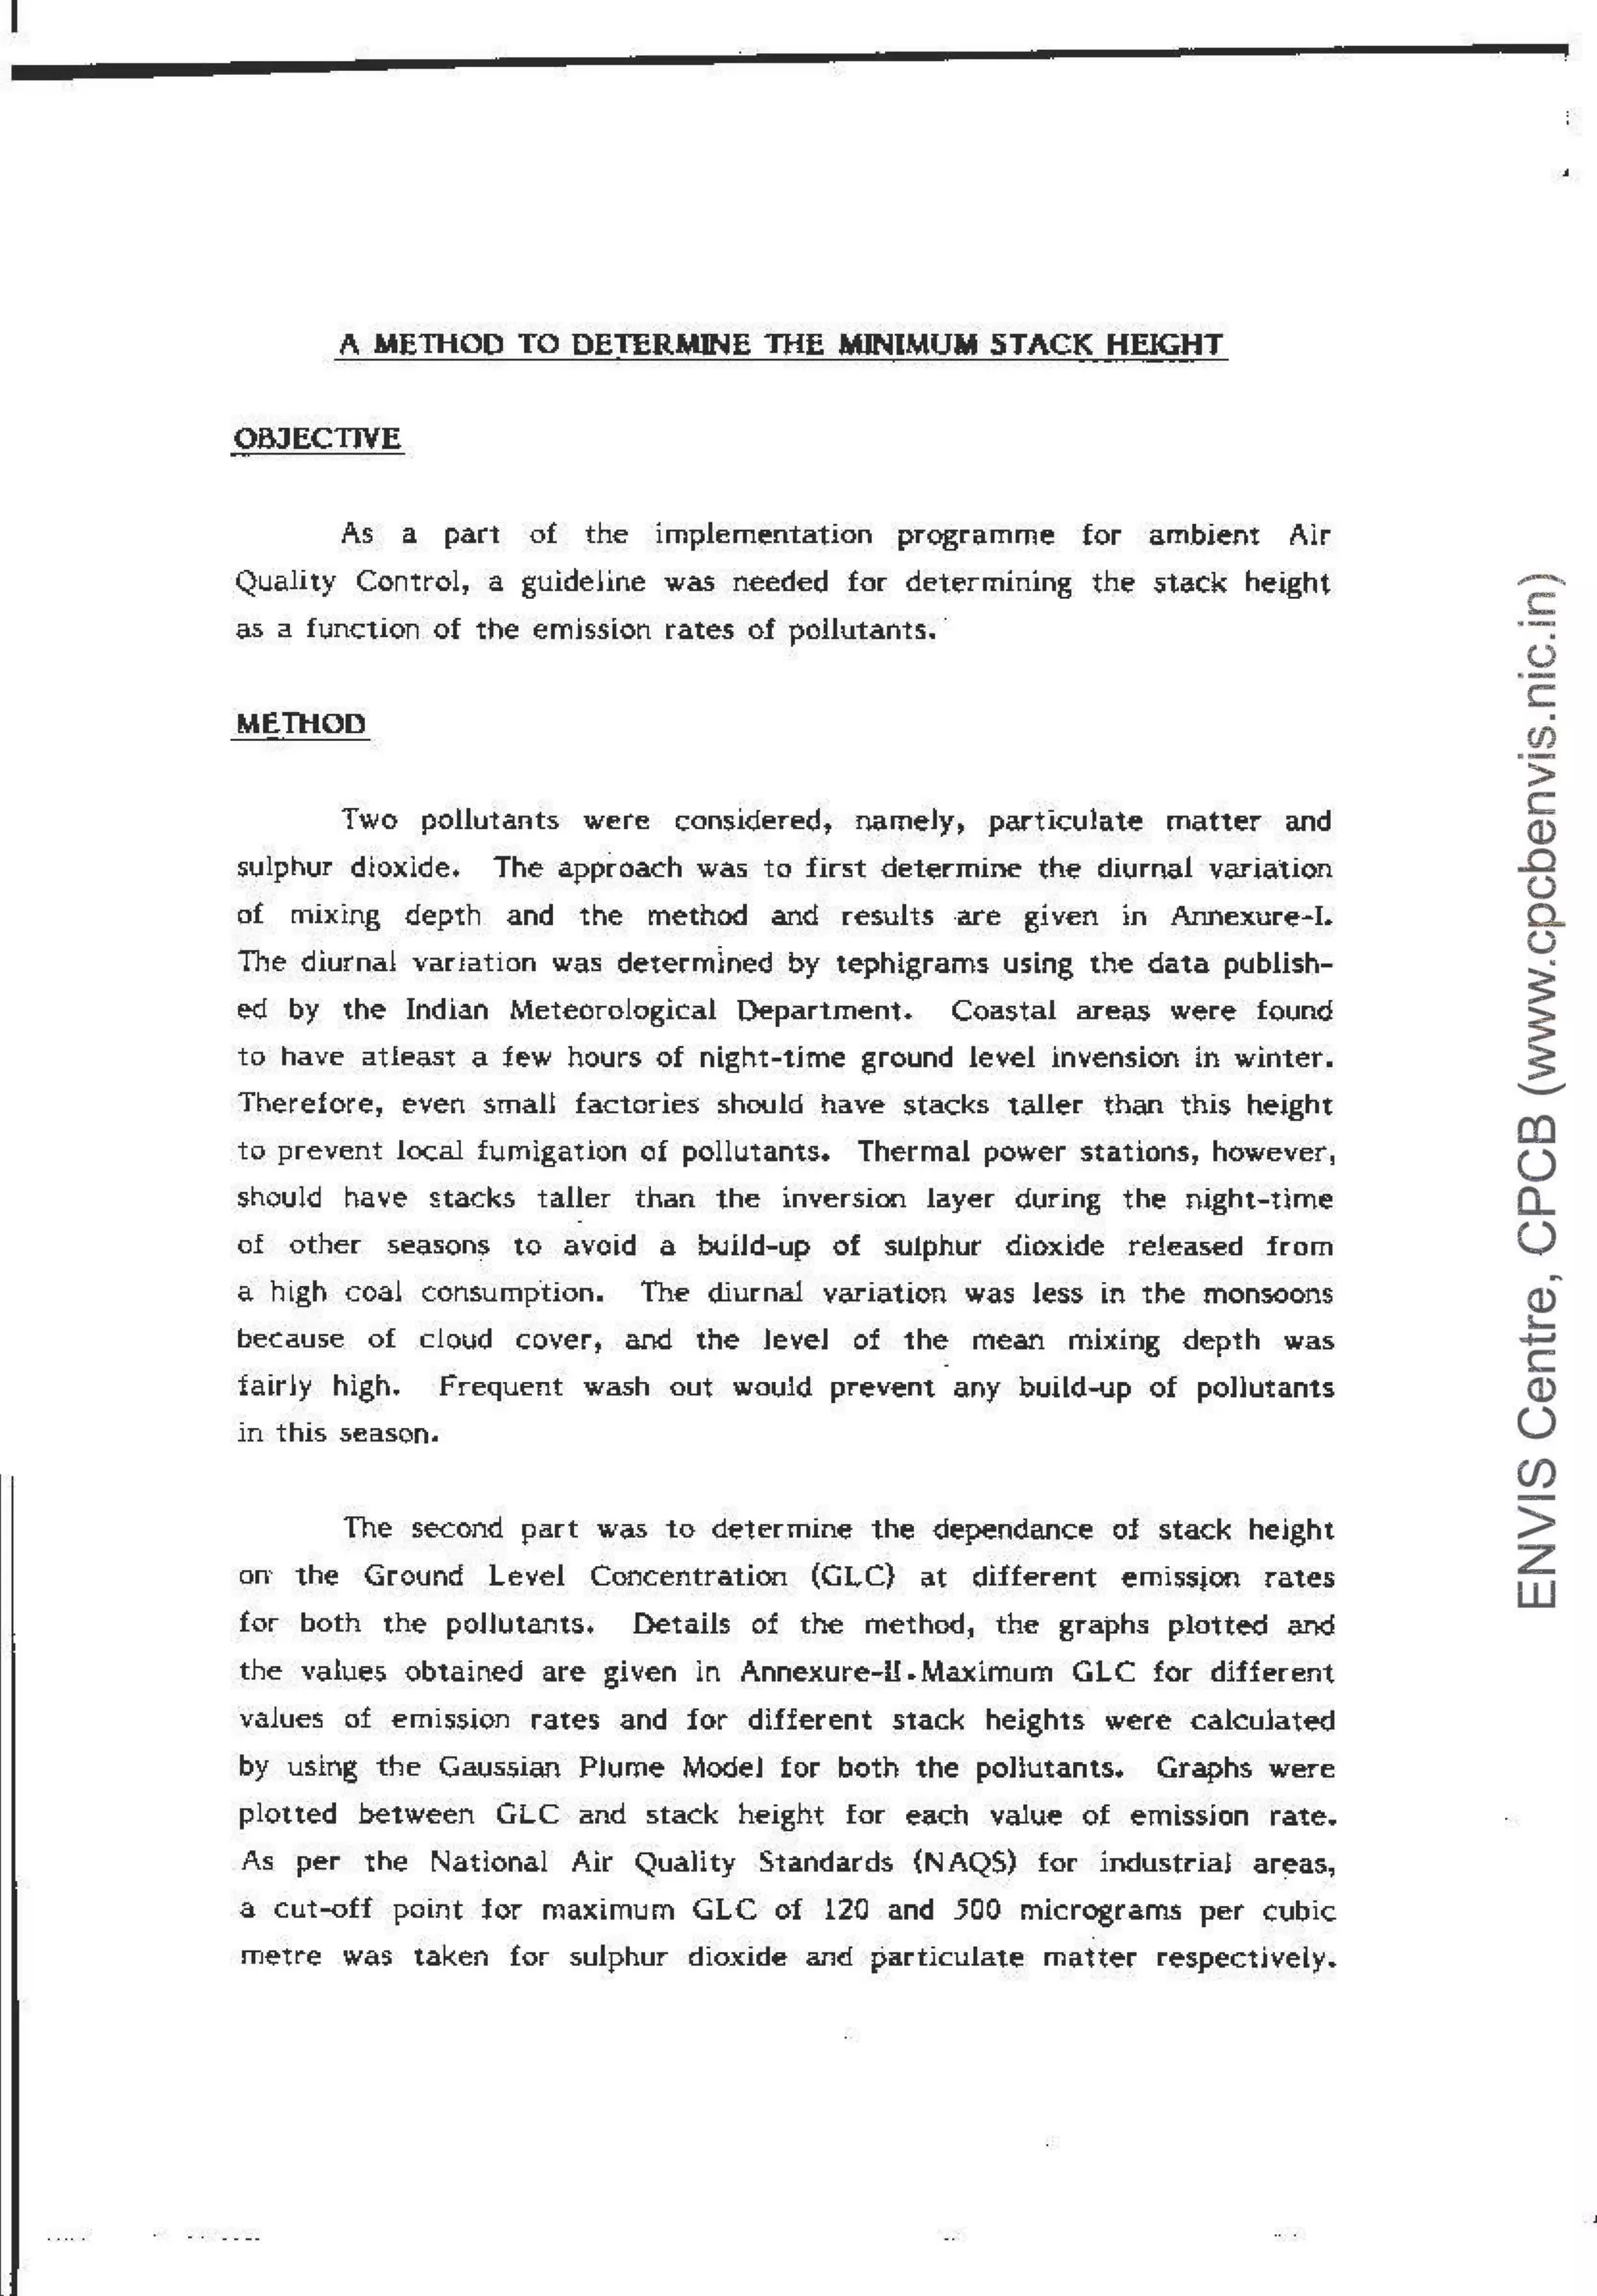
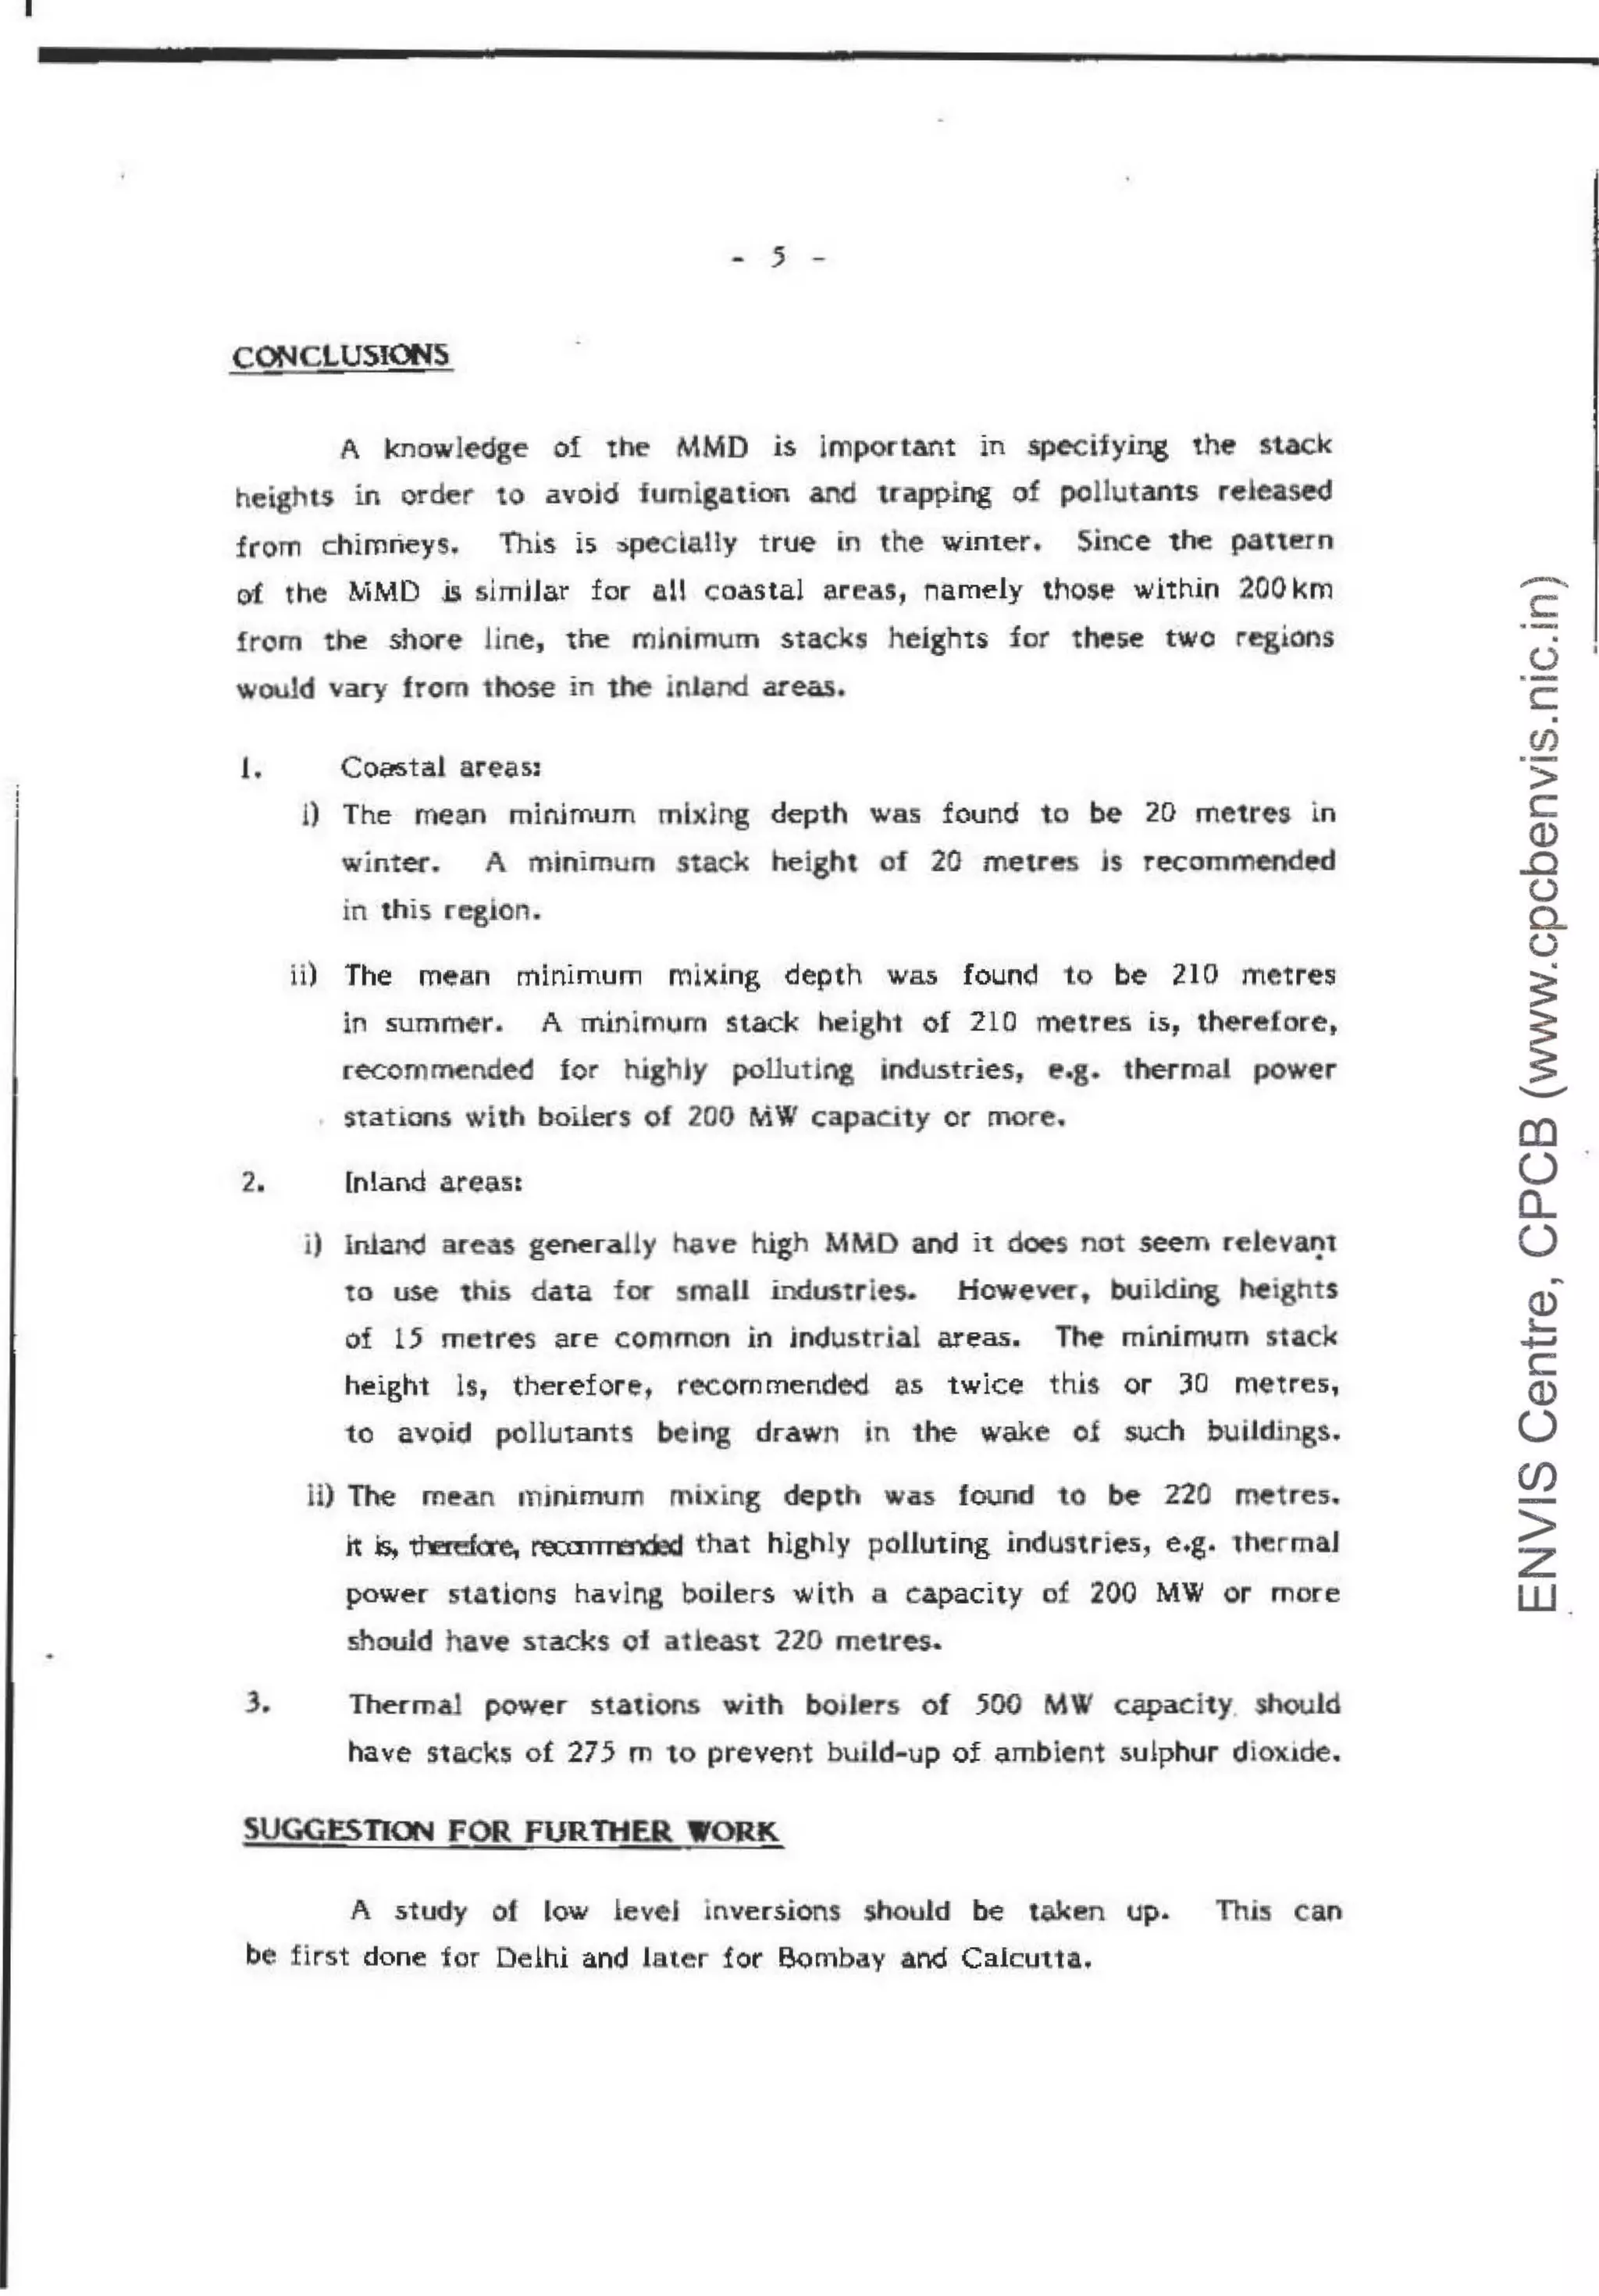
BOMBAY-APRIL
2000
1900Fl+tt,- ,-~ . ~· ..... ~ .,
ma I I I · t _ ~- - ~ - · · - -· · . __
11001 ,=;1T .. t --J -t]1111111 _
1600-t--i~I+~ I _j_.,_,___
,_,__..._, I I I ........,
1s.oo+- r-+---t--+-t-+-L :::_r__ t-CIr·
trttr
1400 . ; l I I- ! -+ I I- I - I - i -1 --;
1300 1 1 r r -i-+ - +- · I--->·-- - ·-
~ 1 200 t- ' t- ---· ... --- l j
~ 1l00 -+---1---~~~-+--+-~f--..,..._-+-~r---+--+--ir---t---f
-
! 1000 -------'---l---'-'-------'----4-
r-
3 900 .-~
- I f I
w 800 ' ' -t- ' -t--t
::::t -
C> 700 . .
~ soo I
~ 500
400 -
JOO
200+--k· ~ . ' .-
-- ti
wo . . f J I . _,__
0 - ~
0 i· 2 3 E. 5 6 7 8 9 10 Tl 12 TJ l t. l 5 l6 17 lB 19 20 21 22· 23 21..
T!ME (Hours }
DfUA RAY - JULY ' - ·-- -](https://image.slidesharecdn.com/amethodtodeterminetheminimumstackheightcpcb-230505112102-63f43c9a/75/A-METHOD-TO-DETERMINE-THE-MINIMUM-STACK-HEIGHT_CPCB-pdf-23-2048.jpg)
![-,
-
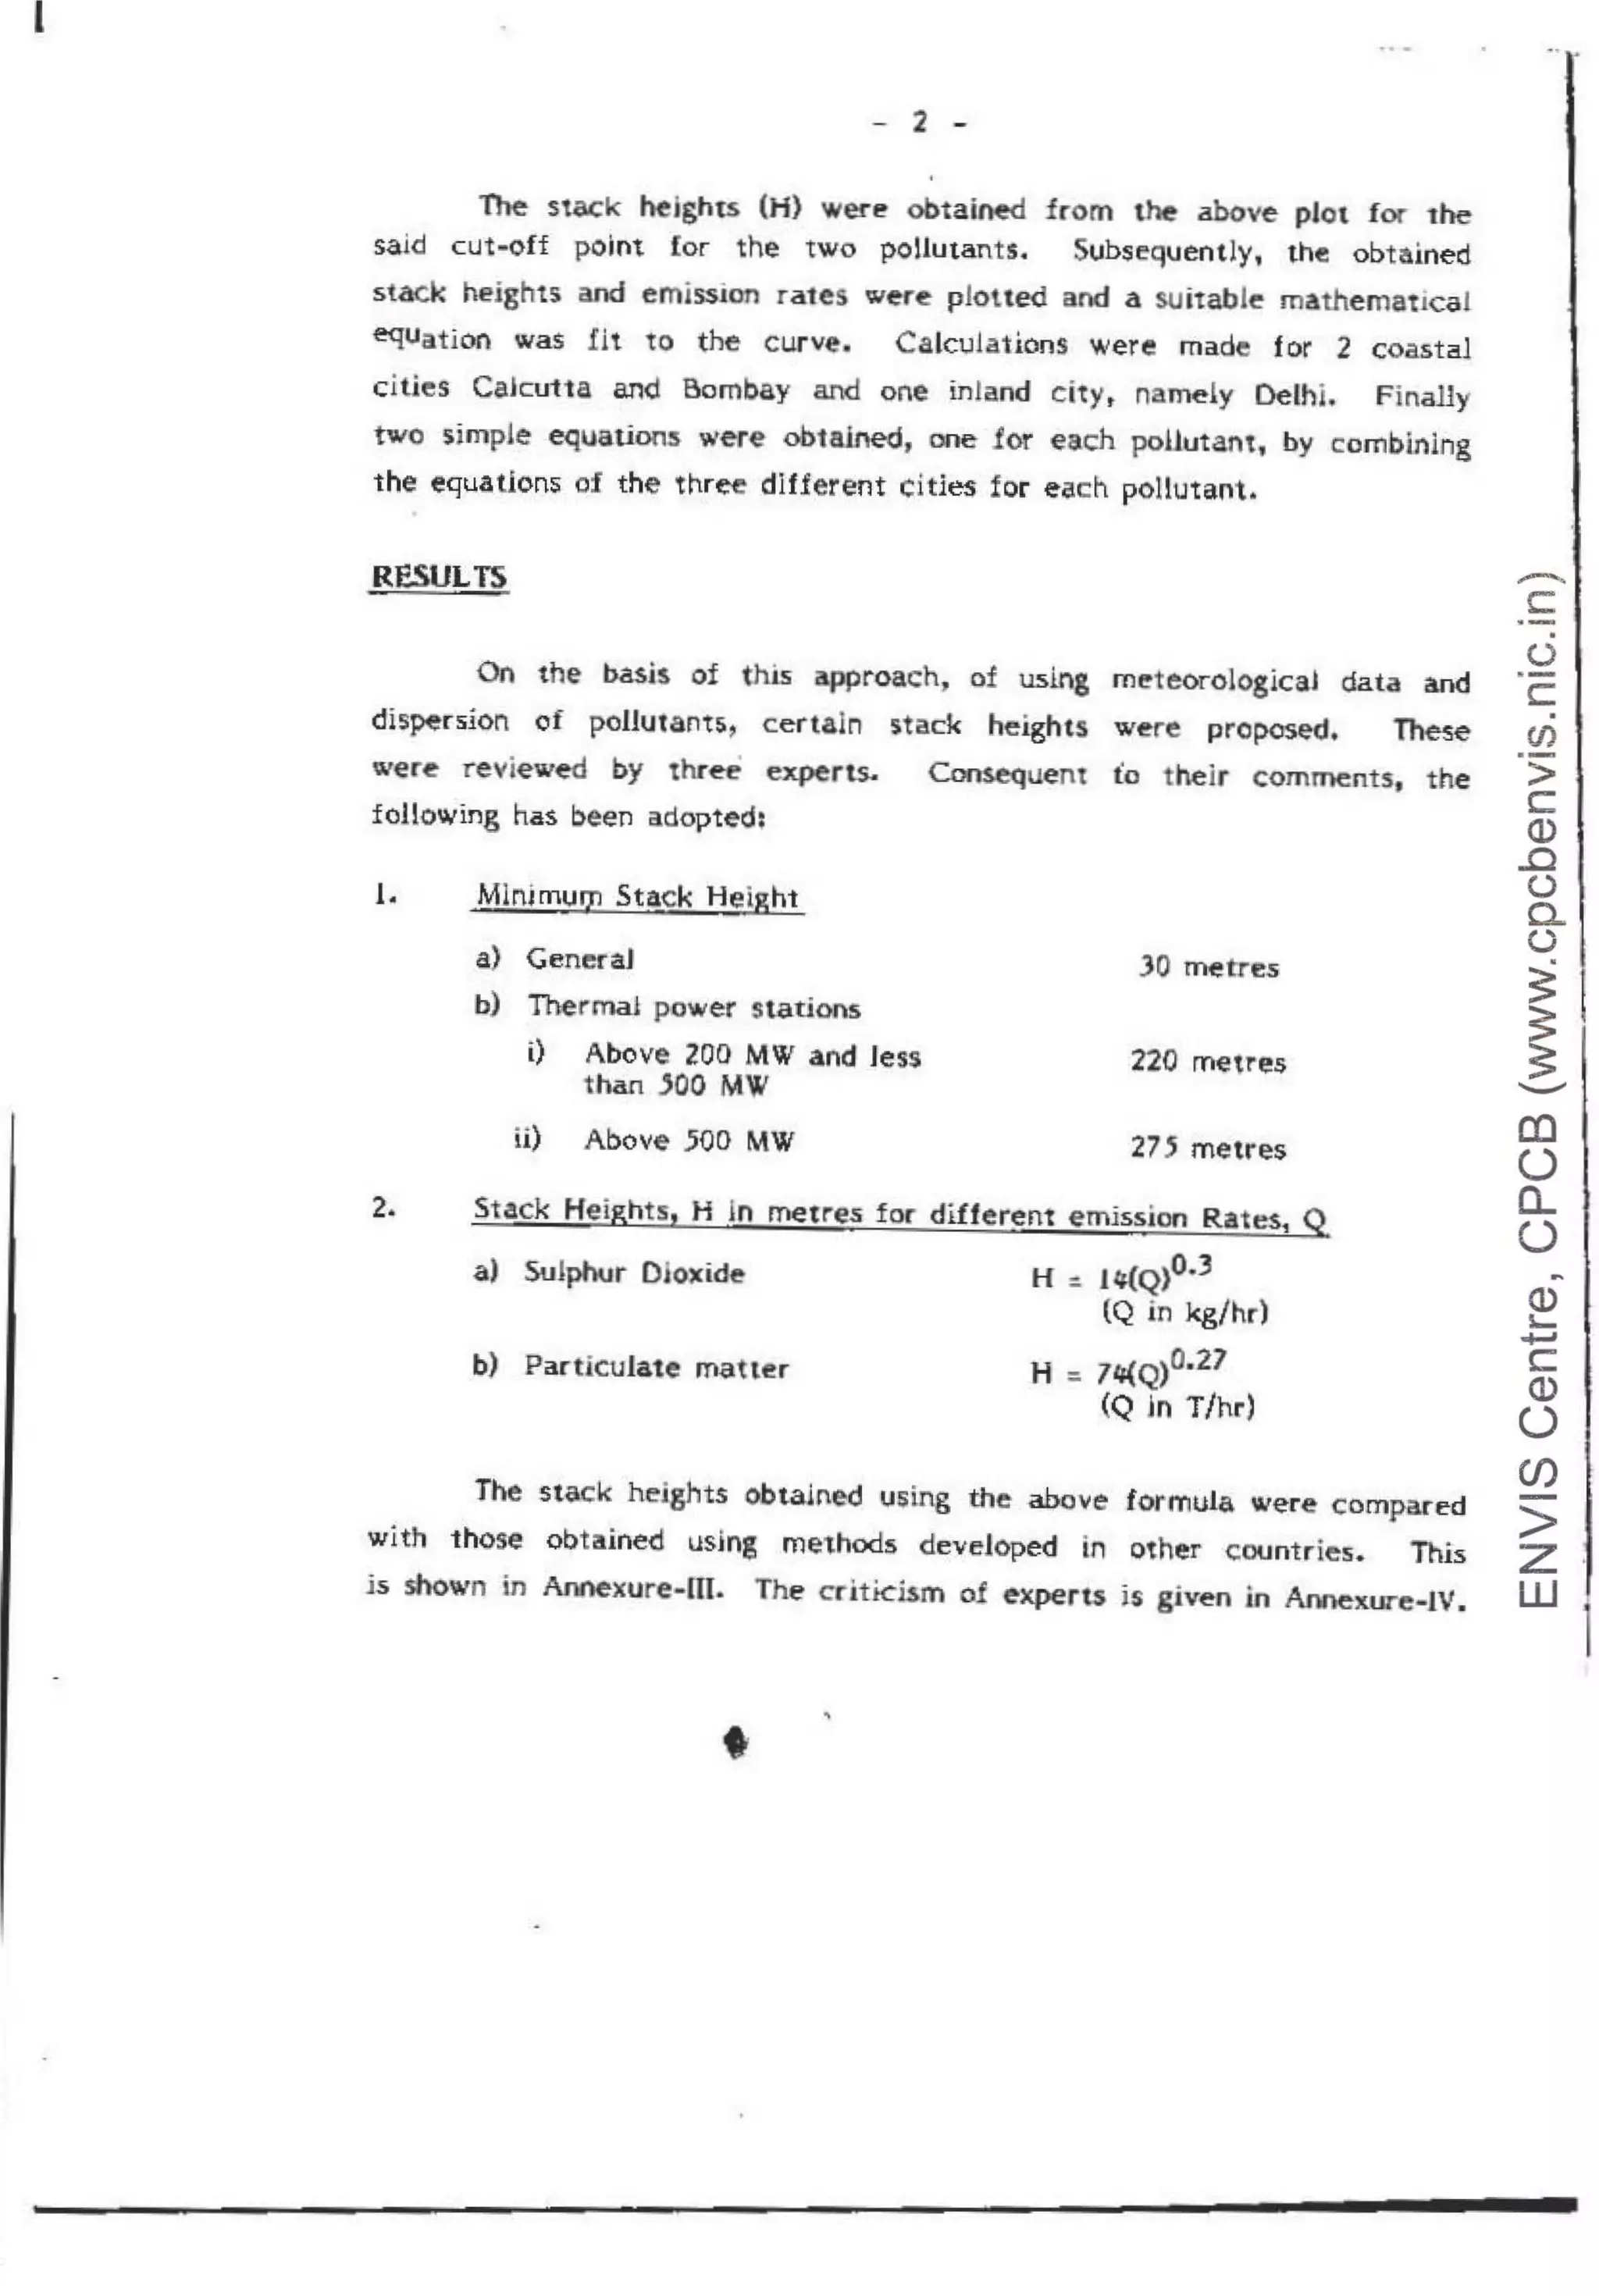
TIME {Hours 1 - )
...._......;.··..~:'·'·~··· · ·
--...,...........-~ .......,
2000 T I I t t I r f I r I.._J__,I'..J___
j___J=r.~.....:l. ! l l-I i ,
1900 ...f,.,.......J .. ··-...1 · • -i ·· -----4- -·+-- •1--
...... . ··- -~ -
-- ·L ••-f--' ~- --+ - -
18oo--.............. -I- .. ....... ~ -4·---1- - --1·-- - ~-
I I I I
~ ~ I
oo-+-niJ
17 '
1~0] l
1500
L---- - I-·
.. ·-·+-----+---+---- - - -+---"1
-~-- -
I
. I I ! I I I ~ ·1 I I +------+--!-·- -f: ~
1400
. I I l I I
; I I
: ~ t r I 1
. I I ~ ··- -1- ···- 4
·--....-
~~~:J I ii
~ I I
.!: 11 o·:o~ ·
~ - ~
:: 100~
w 800
::z::
(.') 700
:::r 900 J - -r--
<.!) I S
-I ~ I
i ... ~-
z
600
-
x
-
~ 500 I~
400
lOO
I
l
200
I
lOO .......·---..
0
0 1 2 l 4 S S 7 8 9 10 11 12 t3 1/. 15 16' 11 t8 19 20 2] 22 Z3 24
TM: {Hourst JJ!lr'
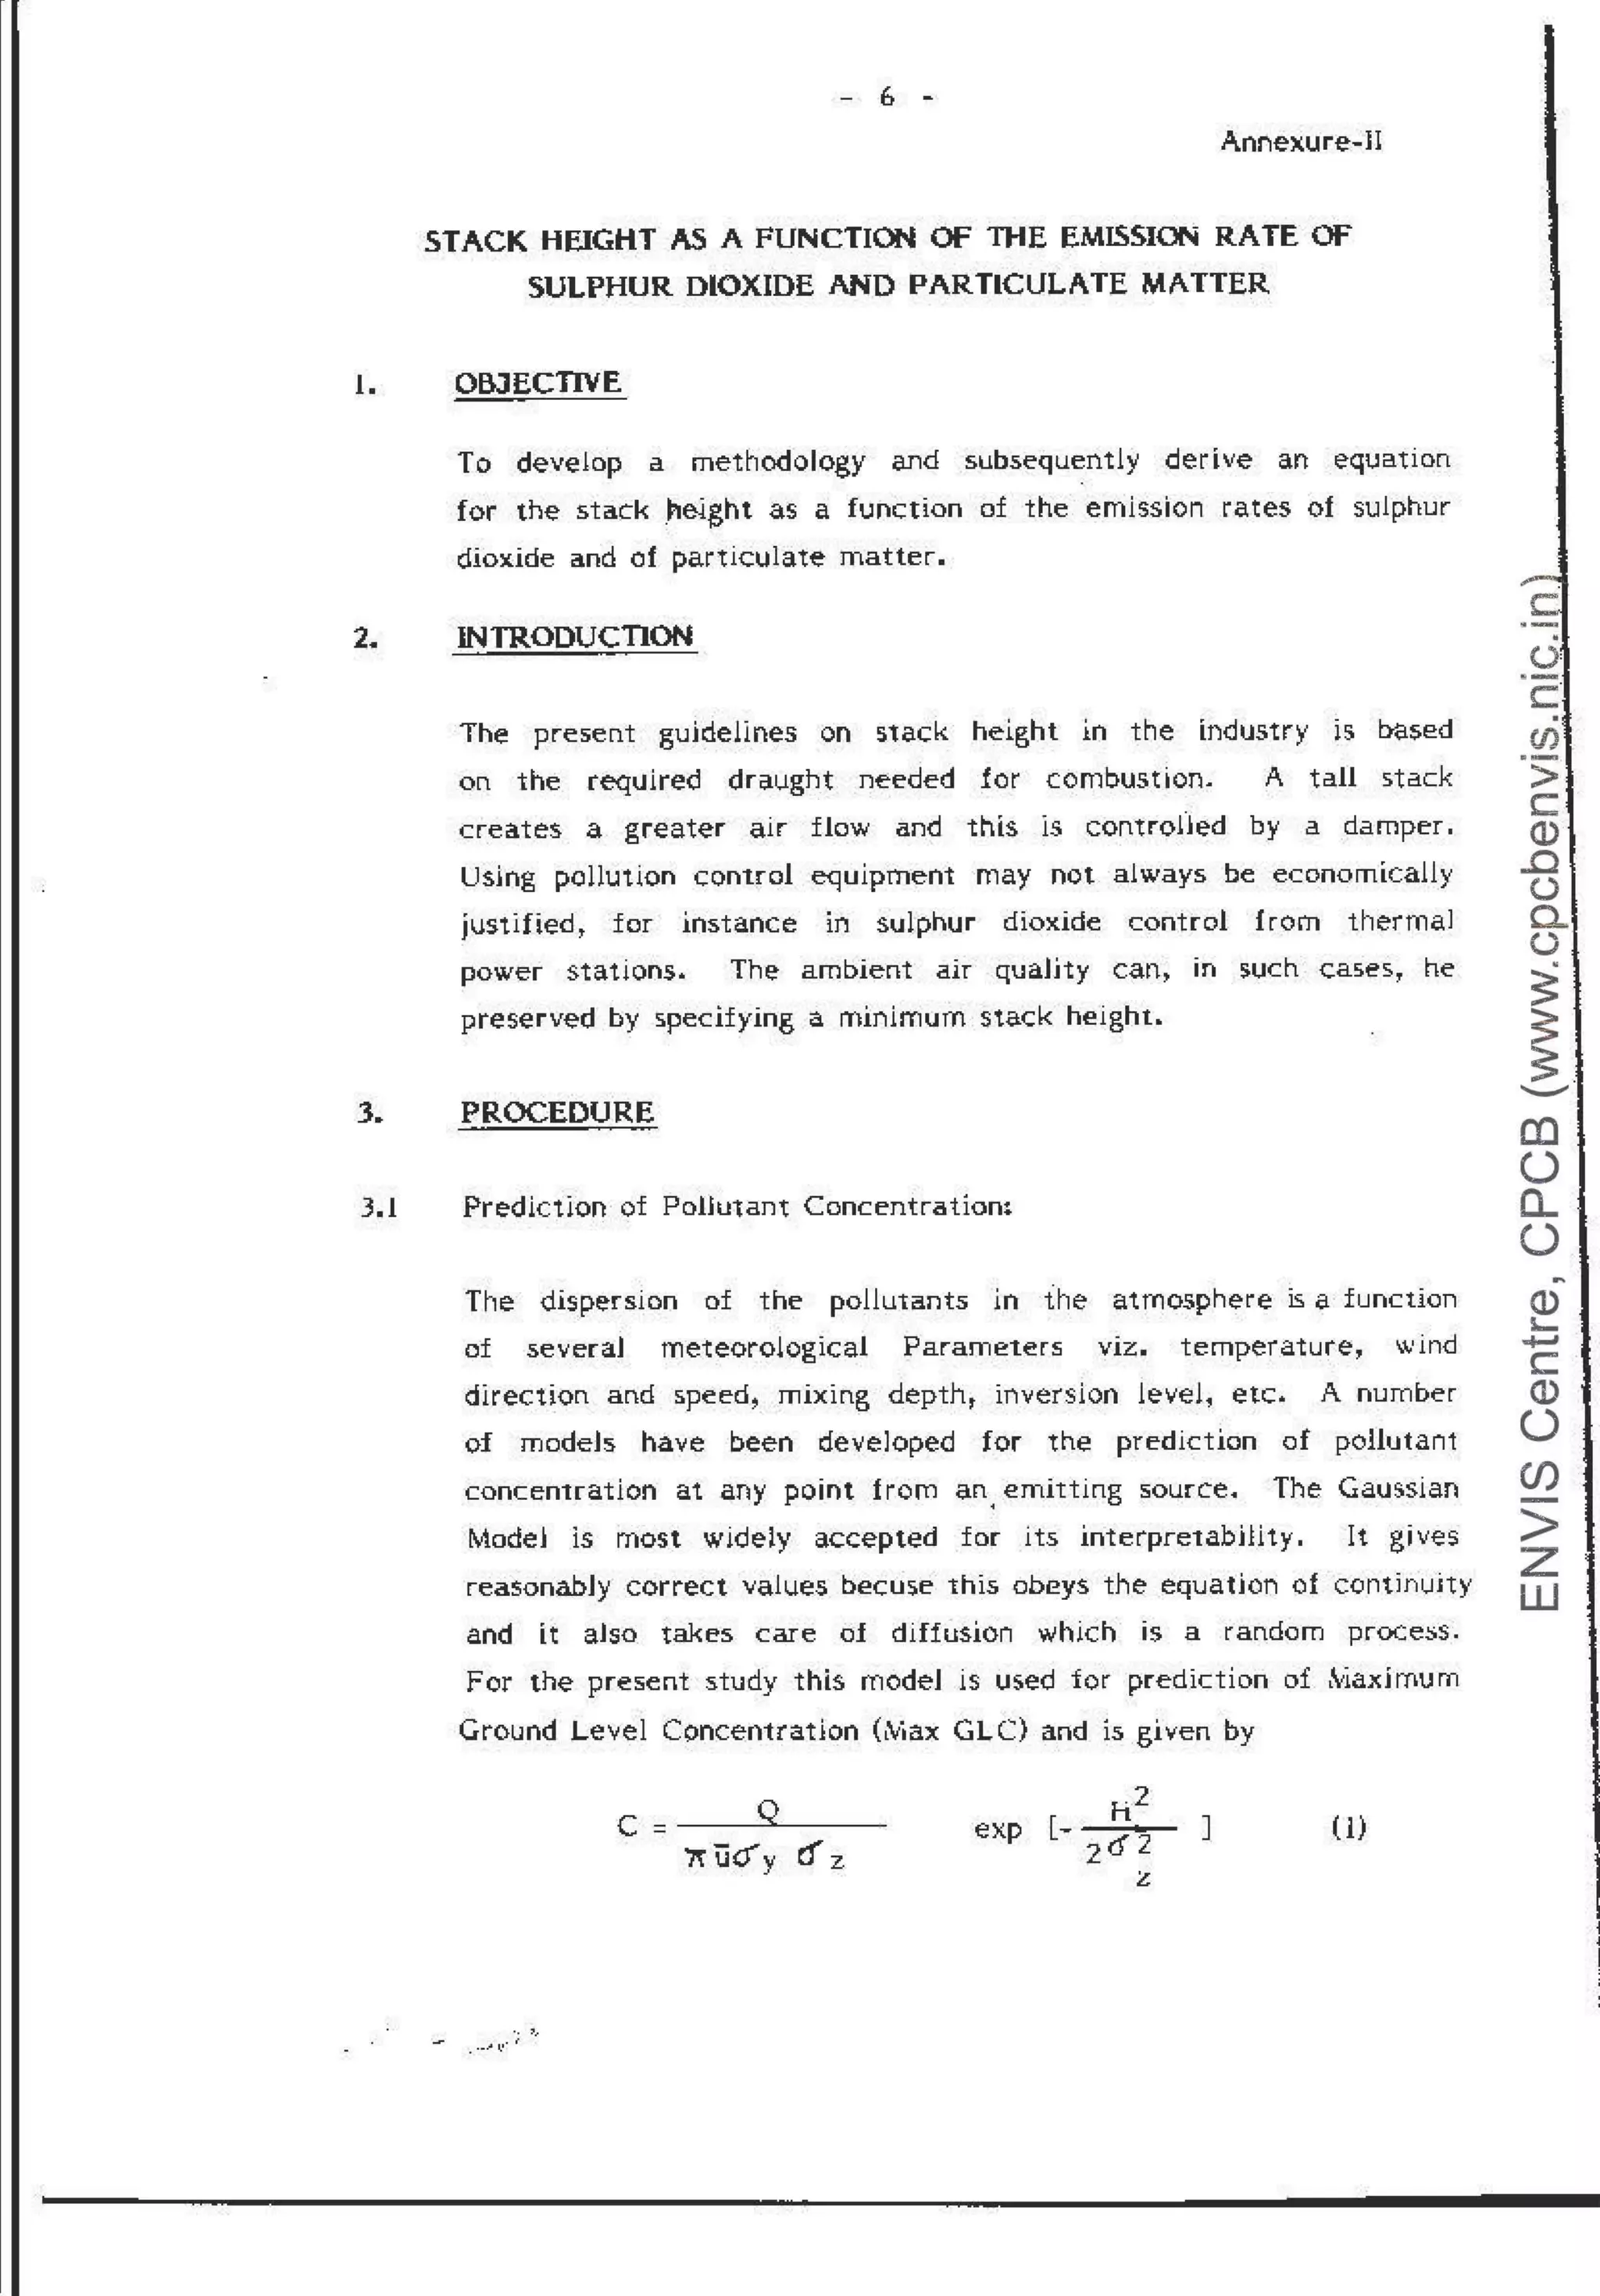
FIGURE-3 RANGE OF D!URNAL VARIATION OF MIXING HEIGHT (1963- 67)
ENVIS Centre, CPCB (www.cpcbenvis.nic.in)
-](https://image.slidesharecdn.com/amethodtodeterminetheminimumstackheightcpcb-230505112102-63f43c9a/75/A-METHOD-TO-DETERMINE-THE-MINIMUM-STACK-HEIGHT_CPCB-pdf-24-2048.jpg)
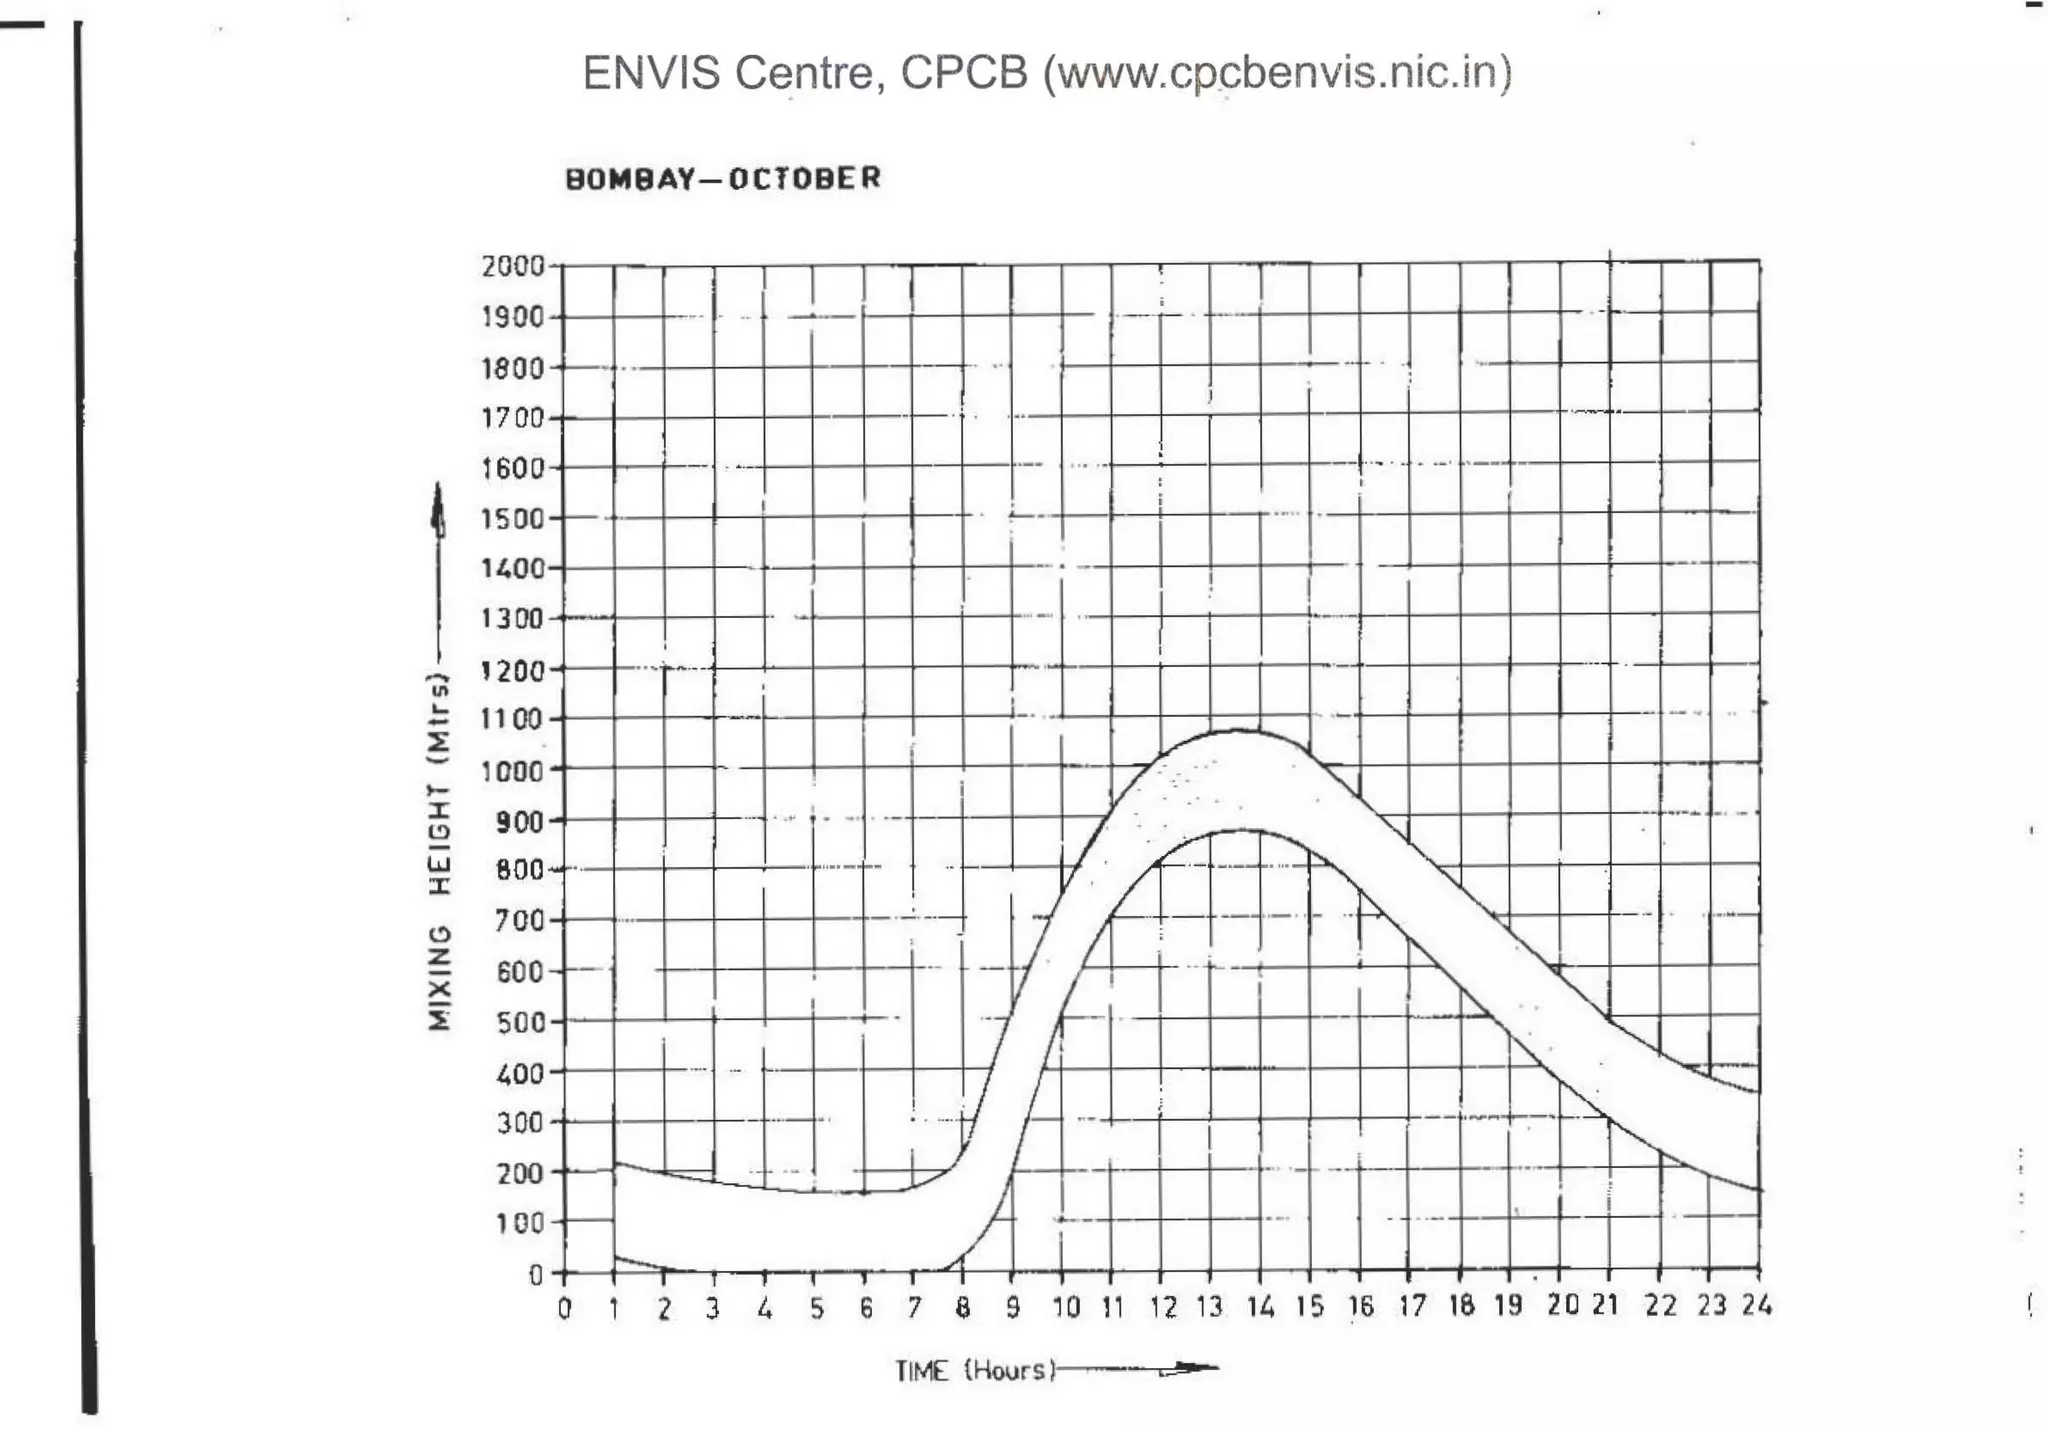
![BOMBAY-OCTOBER
I
~.............~- ·-- - - - - - - - --+---ii
i l
- - _ ___
,_----"'f'i_j__]
.-t--1--t-t-i~ • ~ I
.
~ 2 ..+--1--+-o~--'--..-'A~~ +-_
I - --+--J
~ l
f. 1 _,_---t--i'if::~ ----- "' ~-
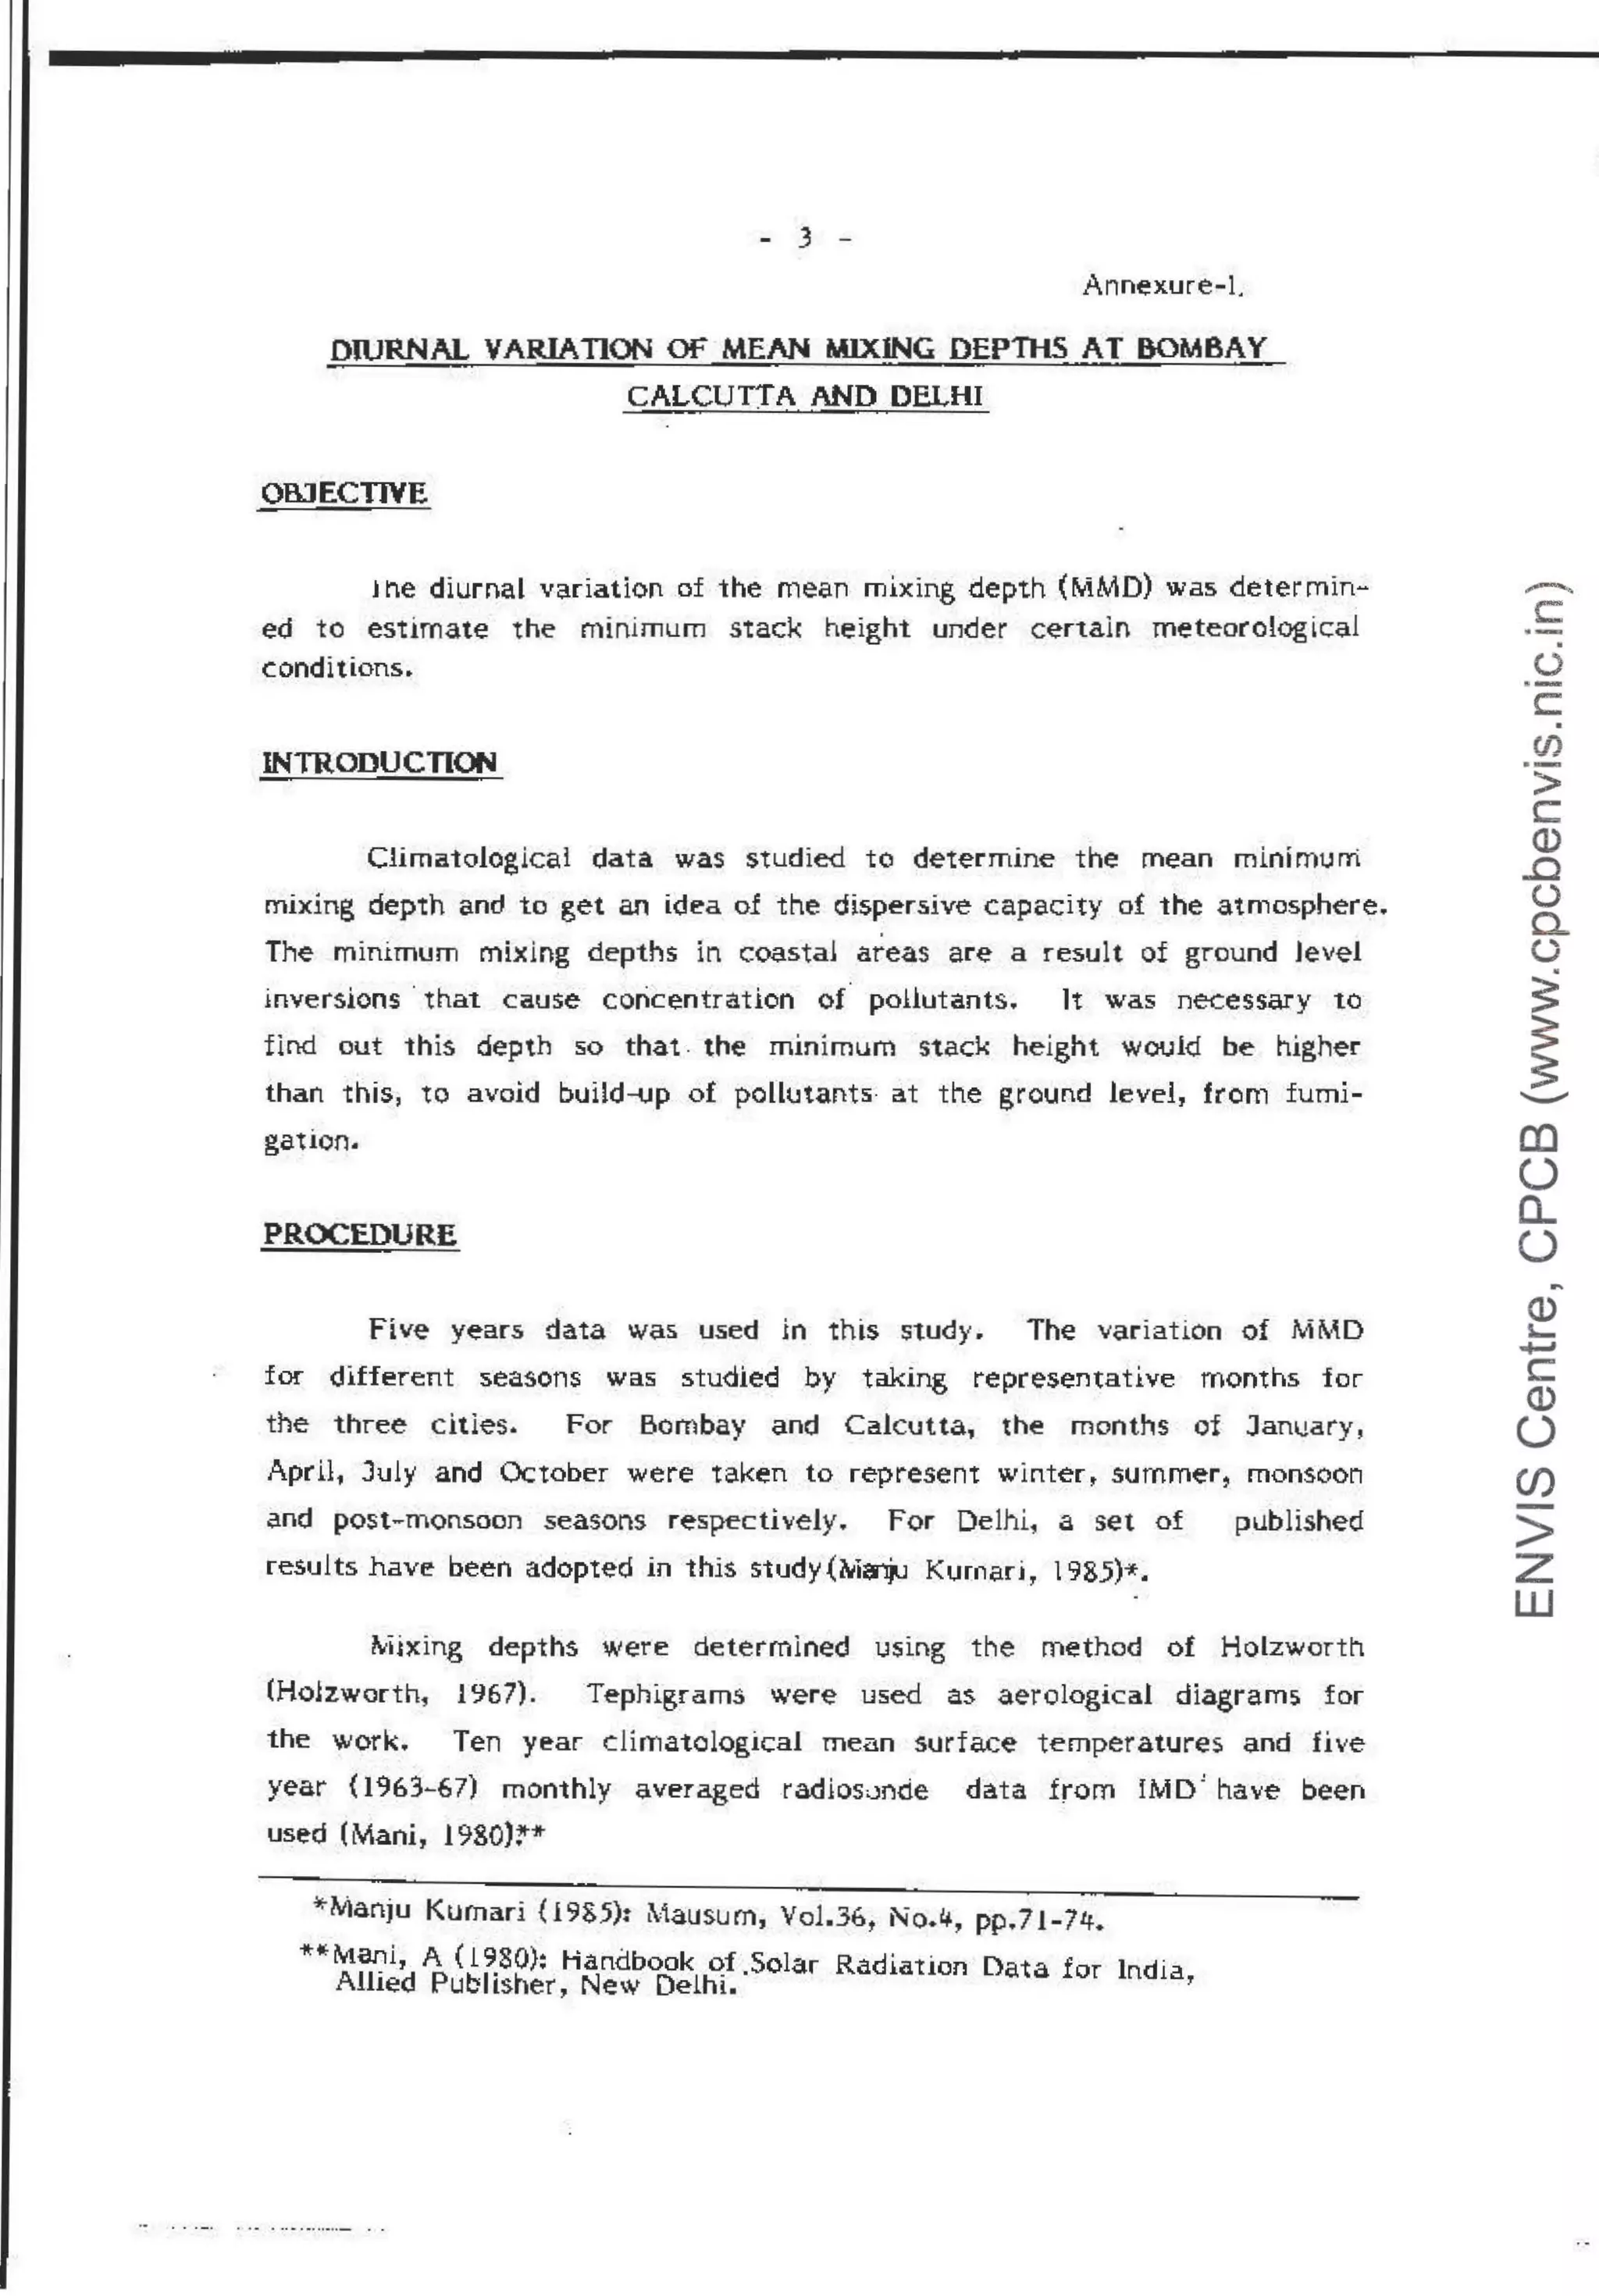
120 lL.0
ST
ACl< t-EIGH1, m1s. a;:!!lazs
-
c:
·-
(.)
c:.
CJ)
·-
>
c:
Q)
.c
(.)
0..
(.)
~
~
............
co
(.)
a..
(.)
-
Q)
s....
+J
c
Q)
(.)
(/)
>
z
w
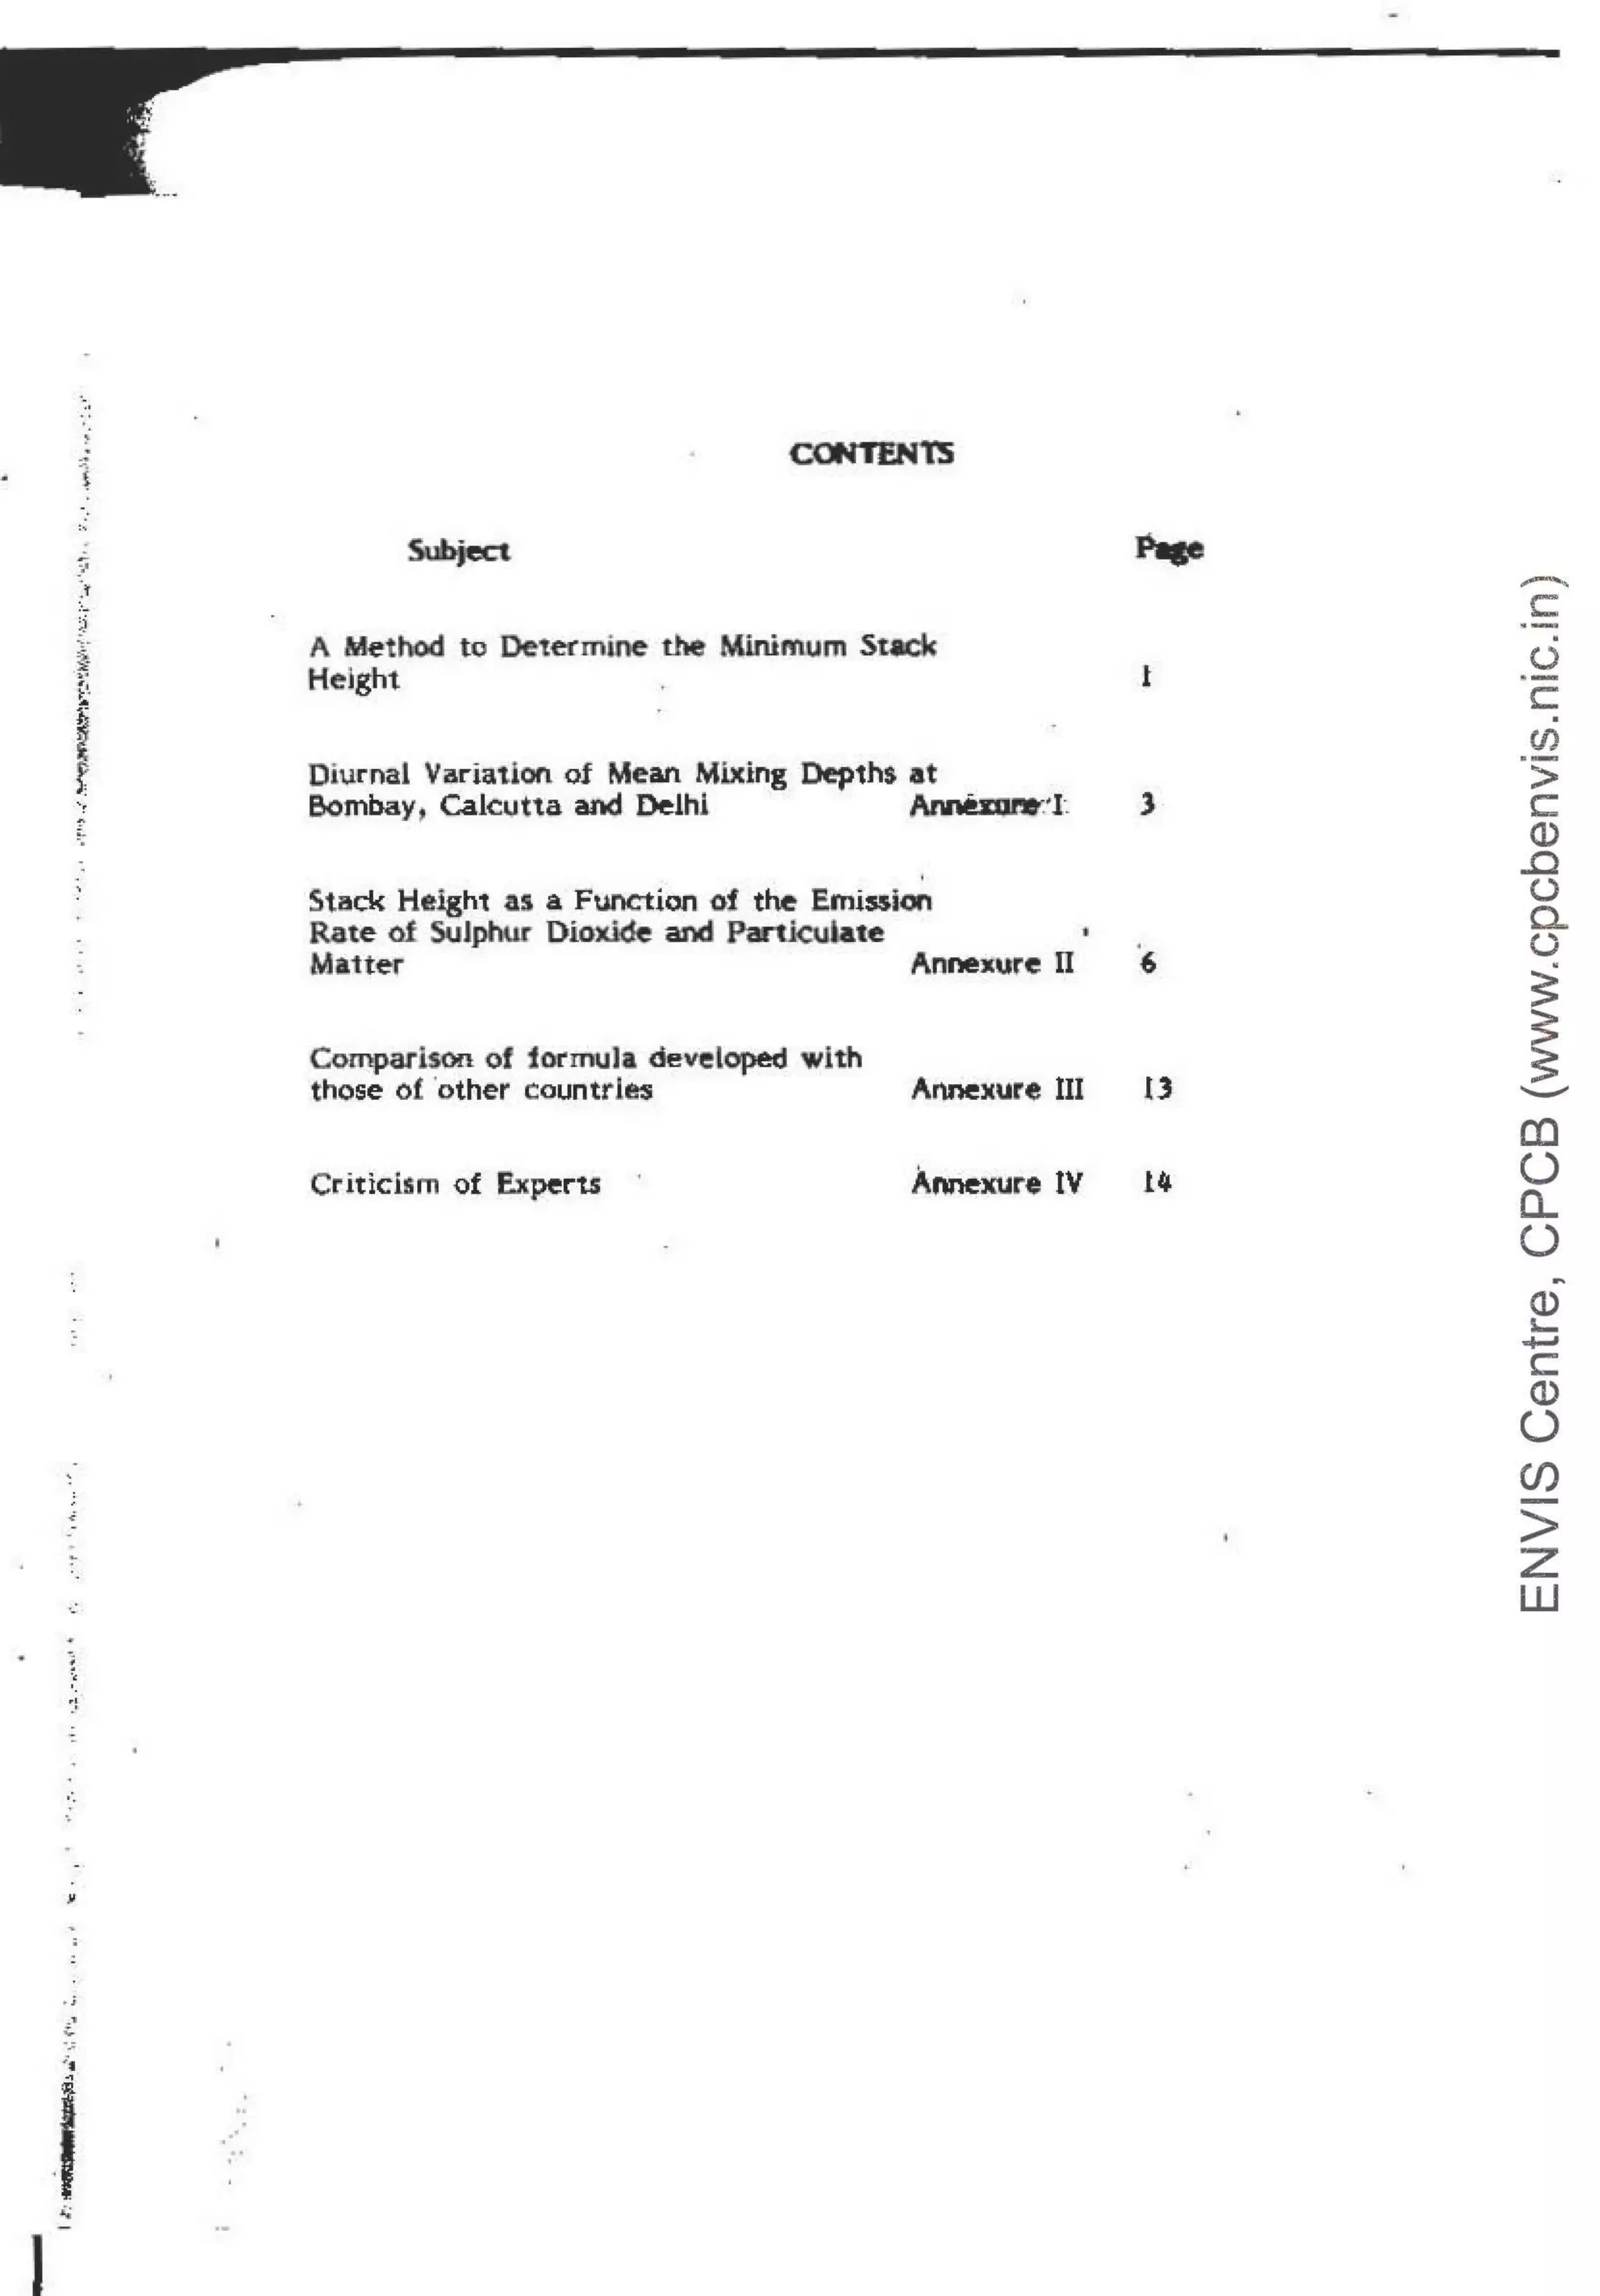
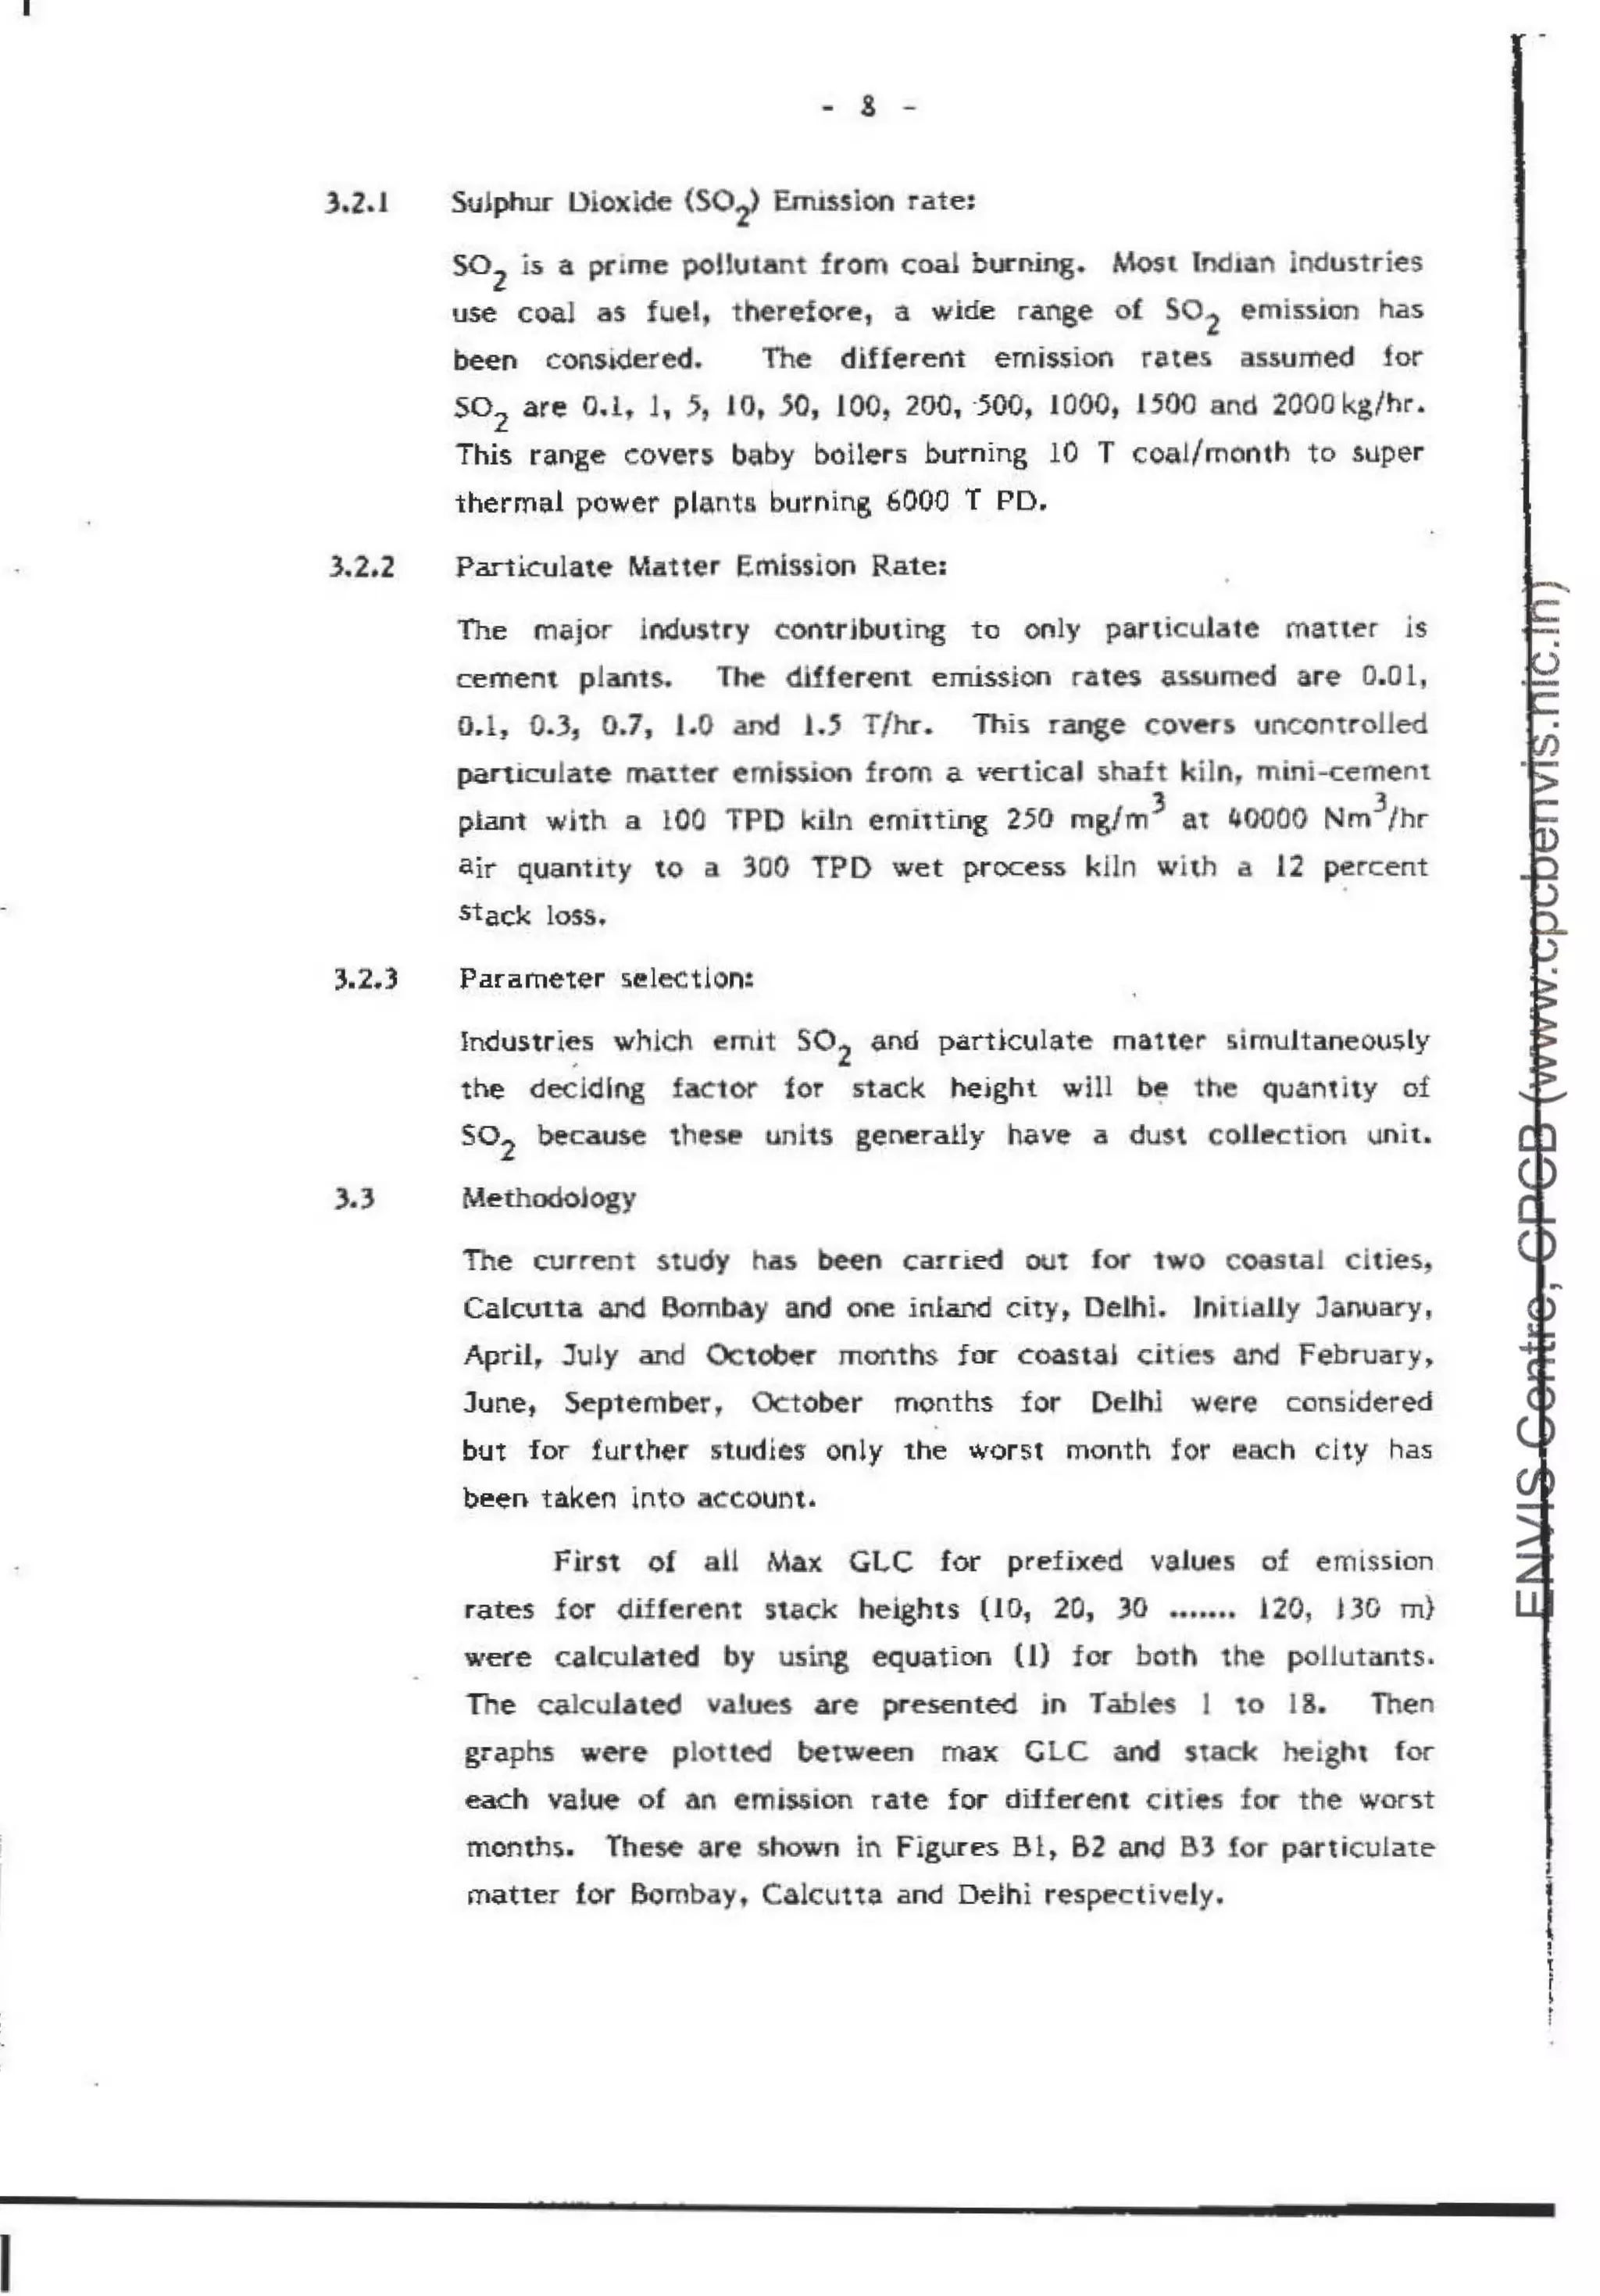
FIGURE-81 MAXIMUM GROUND LEVEL PARTICULATE MATTER CONCENmAlfo,M
Vs STACK HEtGHT FOR DIFFERENT EMISSION RATES ~
I](https://image.slidesharecdn.com/amethodtodeterminetheminimumstackheightcpcb-230505112102-63f43c9a/75/A-METHOD-TO-DETERMINE-THE-MINIMUM-STACK-HEIGHT_CPCB-pdf-37-2048.jpg)
![I
LIST OF PUBUCATIONS
CONTROL Of tJRBAN POLLUTION stRIES
I u • -a~ T1r··1~.,. "" P~lhi IP~~i...dl. cu PS/2.' 1~7a, 7'i.
) 110lutll••I ~o;l•tr Jll>(ltl T~mr<)t'( or Oelhi CUP5 ! J I, IJ?B·7ll.
I wuinl<ml!"C~ lp.:n;on, frNcm•nr~ D4;p(IHl •n CIH4~ c:11•• CUl'lll/411i~&..i~
4. 8t1,u1 o1 lfll-""r !O upply •rid Wos;ew.1cr. f:~ll&eri~r , Tl'Ulll'lt~, a DI-I 1n Cl!!<!ii I! T..,...r.~ at 1r.c11~
r.vl'$ 1n11t'rll· OO
& Inv" "1crr, • "'M'f!1ii1TJ1tm or P.-.111111'.ln ~IYl·~·fuOA ~n ..,,., A."(l"l'ld iA.Qr•·M11nuri1 Rittrt0" l,4.tlr1~1·
CU,8/'11 1U.1 e2
9. Jn• a~ T4rrMMO!Y Q! C1~N11~arh ~"'"min..-,. R~p<ll'l t:.Uf'S 1911M1 •12,
?. Jni-L., T«1rn.qry pf Pcr.:hc"'"''Y' CJP$.,~,-1~~3 .a.11
I . l;l..,·tcul•r All P~lytu;>n L" !l"lh-A ~'"! 'm' ""''Y $1~~, L919'.l·l3: .Cl.JP':S/ 10.1 S8l ~
; ;."*'1"~ tt-1li:in Coa:l!l:irv al· p,,,.,.. ~·01i.11a<1 tDo:G' T~1 A"'"' ~1m..11t. Ul , Iii Dlfli'll; Cl:.IPS.11 :µ~~· .a2:
PROGRAMME OBJ~CllVE sau.:s
' 'P'MfU ll1ill--,t.o:mrSl...,.UrmnT~ al a&..: ~·•l•l'J.«I
., ~<!l~WoR"-• e.u..,""'•-...... aod-tn ""°'_.~
~Evt'1~1
~ ~111 Oud~,.,.. Flo-"'""'"-"'lllL" ..... - - r~oi ~
l"l!l'UHV7J'lQZ.aJ
4 l!!!!m. ~-----' i:-..-_,-c;ii D<'-1i"11 mml ~ 0~$<
•l!Gl1'5!tl/ 1Hl~
! t.lmpt~ Du•da- C- ,..i P·rlSdic" lar 9..,...,, 11(N,M 'IC_."I t rld :
l'V!l!illDr! •iw.il••<:ll 1,.
! llCU!IPIU!l"I! lr>!l!!$1!'Y 1E"IJl ,,;hJ'H1r.Cl1~ ,..~O~f~ ,·3 ! 1 Ml ,92
& Wt~ll' 11',ol•u,'1!1' C1mt•o<-An o.~rv1ftV· i>AO e~s.. : 1/ , 9U·e3
11.,,..,.1 r,,11 C•~il "" Sod• Ur.• i:. lt•n1>11sta~ H~"'"I Cham1aol& Wil!SI Mntal 1'1!0131!~ 1 1 :v1 ge2 l:i3.
~ ~rAll'' fl' ~ AY1ll)Ml~n18I ?oll~ 1io•1. K<l•oro"' Rrrm, Y,·- lloln911 l'!l!Oltl'Jt 1Zt• IM!i!:·8~.
B l'crtMmal'C!! ~·~""or w~~;-:&• T•e&1rn~nt Pio~• Di Cl~nHl'I FIOOf MLlll l"l!IClll~~/] S 1] 116U~S
10. "'c~r~mu'" ~ 1 1 1~ Qr w~i;r~"'~1~' r.~~l•nO"'I Pl•1•L at M ~t-.f D•lrv ~Q(l,!>llf>,• l Ml-63
I ' ! •vir~• mlll'11~! S!l'1~~ ~u•pon, ~-. M..gh~I~~ PR08!6 t,~I IN:l•l3,
, :3 ..........""-""~ fl Geor.--l r~tiDi" Z!rlC C.an~rol IYI w.nar Pi;Ml1Jf10l"I ii' J ti;, pl41yrJn IMi.ttv, "9!!!1n"''"'
1•1U)9'~S I 1B 11"lli ·~
1~ ~hn.in C.:>1"1'~ '" 111~1;-r..o~.i.. fibr• lnduur, w1tM - •1•1 r6fi!PWMI 1g ol"'I' at tl4ril!~r PE>!¥ Fi'""',
~lr~ll~Y . A ~~H ~IW'~ PPOl!f.5.< , 9/ 1983 ·!14
14 "'x-•l'l91 ii" '·""· '"""""'' w~.~~l'"'P· Of" M.ar•.... c..11.1k 1~11 u .11 i lt!JA ~-~!!!ji'. c.....~
"9'01CS/10.l IM~.M '
t II; ~I l'l>!klllCll' ;,- s,;.,.,.,c:n.m.... iS<>I>"'• v....~ C•"'P. Cut- Dim Muwn.-
'1!0e!Sf11 r lw,J•M .
'81 !'Mtoi'JM<li:• i:i"'°"9"~~T1NU11U11 PIMO n Mi i Slw.,._, rlQID!k ~...i ~
IM.nill".U 1"'1;19U-ll'11111U-M
•7 &IM• otll'nlv'-!lf-~ ""Olle-•-P1111ut"°"~ i..o- "'-"" .,...,. _.,;u.
1~ "'IORS:lJ:''9&Wil§.
111 Q'~~. -~~ cfW- - IT-U ~~~_.... LI!-="
"1tCllUIJl.1'1ill~
OOMP'AEHEflSIVS IHDVSTflV DOOLJMEiNJ si=mES
1 ~l'l'lfl'fh•n•1... l l'l!lllstry DocumvitMor. M;o<t• F1br" ll'Outl"f, QOlNO!l/ 11it1t.9C!
2. 114'111mo111 14'1•01'•! :;~~dlrd• ,,.,,, N!.,:i. F1tff ln<lusttI' Cl)l~El~l11 ll?lll·IO
:I. CDm!lf"lll'!•Ni•V. 1!'¢uSlry Ooc;u,..,enl 011 R~fin...los: COINl>Q/ 3t1 M1 •H
• . M111m•I 1Mt1or>P~ =>r•""8·d~ 0;1 A~rin..1.... cc~~ Ds1•11sia1 &1
! C-11f11~Cn11y~ lr.!•1~1~ ~U"'~"L {;~lor·Al"'411 •1
'Abt'ldilodl lndUHl'I' C.:C:Jlfjl;Hj:/t/ 1~7~-llO
I MIJl l~1wl ~t1Q111 1 $bnci.n:i~ "°v8"ic s..oa !ndon~y COINDS/ &11 i?i IO
'1 ~~mptf~9~llvt' 1n01J..,r( Coou"1~n1 ~ tv.~(!(ul ,; l&uttt !r1du'tLry, C01r-i08n I ,1lllO·~ ,
g, M1n!ll!•I l't!l!lo:>l'!I: 5l!!nclor<I• ~~a• :""''~''f COIN PS,'~/ 1Oeo.I I
i . Cam!Y'tl•~•I.,, indll~ Oocum~nr """~mM'(ID IMolt•;,,.., 9•w-1" a!l!l 1l15f! l!•riQ•I IMvtl••
hl'1•: ~Q!tiQ~ •' 10119111 ·B2.
1
·0. M1r11rn•f !"l!!!il!tQn.t• ~·Jrr.,uTt. Fe-c1?11:rn~Dfl 1Wlolrc!t14!5_ i&t"""41t!:ti-j 1111!.d C1ttUll "1r·c~!
inllHll"I' S«t'IM·
''· t:~ Rl!l!j!Jlll~l"O''"• rJi;!f '9&1~ Pnt r COiikDSJ t ,, ' ""'""'
ASSESSMEHT &· DEVEL.OJ"MSfT s:TVOY Of RNER M$1tll SERll:S
I L,_ l111•1Wnf ........ _..I!~ ._,...,c,r.....,..~111Pli~
l. au.. e- ~j. _... w.-- i-.i;,...-. n. "-hill'Pu a.. ,...."-No
S•l:- ~:z;1~7!J
a Sc.hr 111· b ·lcom! >1 a."111 ~ a1 ...-. ii;-.~and ~.,,._$
(Pt. 'll1I: s-w,
mot: ADsmes,111~,.l'fl
4 ~'"""""lfllll1'11 ~ :
s.......,~ :S.~•5"' ~- ~1- e.tm-n"""K I~
AO$OlllllF'','!1"1..a,_
II. u- Tt!tl'llilll'Y ~Got. O..mon ar.d 01u 101n Gl>&I At>fo<lil*d• •D~llaS...511 ..a:.1·U
!, 5ttMi;l w- <l4i•l'l'f •~ M•i,... 11;....,,. 1G"'"'~ S"••I o,,.r:Ag l l•nni.,,,.. 1t'lt !kl su.....y·
ADl50llll~1 5>'1tU-lll
7 Utni;t 9H••' R1•p<11t ! P~n l~E~!i•~ Gin~• BuiN:,t,l)SOPl0171 l MZ·U
• IOIWG l•lllV:OI (14 'll'!PU!r 0...11'!'1 ~t Uu~ra-1.l'iitO'd (;91193 Fatml~ mbi.1~r 1" ,liQ'liOll!l.5(9/~ 982·83.
D. Qumj~y '"~ TN!ll!I 01 R;•..,. Yam...... ,~7~-e• AD~A8$t,0/19U al.
,o. IMlrl s~o-~ti,. '"""""'''r <)4 w...... l'<lnut101i: lh~ arU11M~i.1rr• ....." 11'.rM. Th• D11~-Dl,a"ll
S1o1~·U•1n "'~li:Oftas.n 1r 11163·8'4.
I 1 WIUll' O~•lltY ...OM~in1Jr An L-ri E"'"''"'~ce A.OSOfllHt , 211 ll•HNI
COASTAL PCl t.L.U'TICN COH't~OL SERIES
'· 111• Clttt:t"GtiliO" <it liodia.. couu.ud i:..,.t.o.-ts '••t LT"1i1ll ,..lliiiC..111 OOJ'OC1'/t;J!ta.1111:.
1 U• ~-fO" Ql1 r..di:.lnol''.t>11•••"1<l' C.,..._ P!lfolt l.,,..l(;i111•1
• Q" ~CS<'U'1114-illi.
"'•·lat
!!;•.f/JI·
~. ,001.
"' 1001·
"' 1ii·
"' »-·
Illa 100·
1'1~. 401·
Jiii 1001·
~. 401·
~, !IOI·
"' <IQ,•.
"' ~t·
Ml M),.,
Ra 1001
Ill IOOI'•
II& .-01•
-
c:
(.)
c
(/)
>
c:
Q)
..0
(.)
0...
(.)
~
~
....._....
CD
0
a..
0
Q)
,._
+-'
c
Q)
0.
(f)
>
z
w](https://image.slidesharecdn.com/amethodtodeterminetheminimumstackheightcpcb-230505112102-63f43c9a/75/A-METHOD-TO-DETERMINE-THE-MINIMUM-STACK-HEIGHT_CPCB-pdf-46-2048.jpg)


