SlideShare a Scribd company logo
1 of 22
Download to read offline
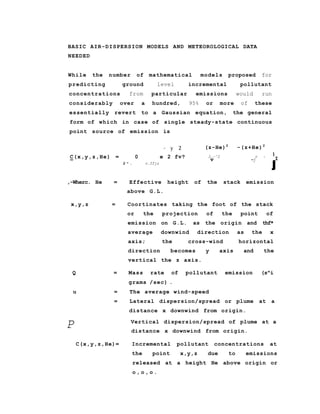
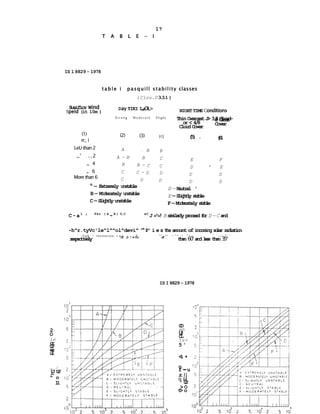
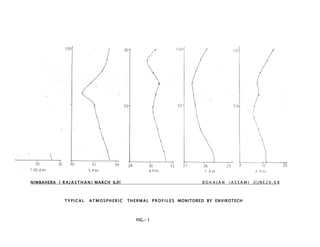
I
METEOROLOGICAL CONDITIONS IN NORTHERN INDIA AND
AIR ~ POLLUTION DISPERSION MODELLING
By
Dr. G-D. Agc^r.wal, Technical Advisor
Envirotech Instruments (P) Ltd., New Delhi.
INTRODUCTION
substainable Development the Key to Environmental
Protection: For developing countries like India, it can
never be a question of choosing between environment and
development - the nation stands to lose if one were to
be chosen at the cost of the other. The interests of
the nation lie only in planning development in a manner
that it shall not harm or adversely affect our natural
resources or environmental quality in either the short
or in the long rui and shall in other words be sust-
ainable.
Modelling the Key to planning for Substainable
Development: As would be obvious, all planning involves
some assessment or prediction of future. Ensuring that
the proposed projects or activities shall be
sustainable and shall not affect environmental quality
in the long run requires reliable prediction of future
impacts. And such prediction shall need to be well-
quantified to help decide the extents to which
development can be sustained by a local environment and
also to decide appropriate technologies, designs and
polluti on-control or amelioration measures. An EIA
(Environmental Impact Assessment) without quantitative
modelling of cause-effect relationships is little mor-
than a set of apprehensions or platitudes.
Pollutant Dispersion Modelling Key to Air Quality
Management: Thus the most important tool to ambient
air-quality management in India to ensure that human
activities do not deyrade air-quality that start
2
adversely affecting ecological or other sensitive
interests, becomes mathematical modelling of the
dispersion or spread of the pollutants in the
atmosphere. In the absence of reliable modelling of
such dispersion, decisions on site clearance of
proposed projects, fixing of emission limits, design of
stacks and of pollution control equipments shall all
either be oversafe (and hence, in a way, development
restrictive) or undersafe (and hence shall damage
environmental quality). For rational and optimal
decisions, it is absolutely imperitive to develop
models that shall provide practically reliable air-
quality predications.
1.4 Meteorology the Most Critical Factor:
Meteorology being the science that defines all physical
characteristics of the atmosphere including all forms
and factors of it's movement and the spread of
pollutants, - modelling of such spread becomes
intrinsically dependent not only on having reliable and
appropriate meteorological data but also on having a
good practical understanding of the meteorology of the
area. It is not adequate for environmental scientists,
.particularly those involved with air-quality-management
or with carrying out EIAs for air-polluting activities,
to collect data from the meteorological department, IMD
or to refer to IMD for advice but to understand the
behaviour themselves so as to correctly decide the data
needs. And when necessary, these scientists/engineers
have to be able to make appropriate meteorological
measurements themselves.
1.5 This paper discusses some meteorological behaviours
observed during environmental studies in the plains of
northern India and their relevance to mathematical
modelling of dispersion of air pollutants. It brings
out the need for intensive collection of appropriate
location-specific meteorological data as also of use
of models that have been validated on field under
Indian Conditions.
3
2.2 On a first look one may feel that the only meteorolo-
gical parameter involved in the equation is u, the
average wind speed. But soon one would realise that
both yy and Jz. very much depend on meteorological
conditions that control atmospheric dispersivities. In
fact all the different models proposed (100 or more in
number) are merely efforts to obtain better estimates
of y and z under the complex meteorological controlling-1
*
factors and/or to account for in a realistic manner,
the variations in ^ and^z from point to point and from
moment to moment. Most models classify the meteoro-
logical conditions controlling the dispersivities into
a number of Stability Classes and then provide
equations to compute^y and for each Stability-Class.
The most popular classification has been the 6-class
passquill-Gifford-Turner (1,2) system, later extended
by Holz-worth (3) to add a seventh G stability-class to
the original A to F.
2.3 The effective height, He, is not the physical height of
the stack but has to include the plume-rise due to
thermal and inertial factors. Plume rise again depends
on meteorological factors including wind speed, ambient
temperature and atmospheric stability.
2.4 Even the coordinates x and y are not independent of
meteorology, since the average down-wind direction
decides the x-axis, and any change in wind direction
shall change the coordinates of all points and in turn
also affectyy,y~z and all other terms.
2.5 Overall one could say that all terms in the basic model
equation depend on meteorological data, except the rate
of emission Q, and the vertical coordinates z.
Obviously the reliability of modelling results becomes
very intimately related to obtaining appropriate and
reliable meteorological data.
BASIC AIR-DISPERSION MODELS AND METEOROLOGICAL DATA
NEEDED
While the number of mathematical models proposed for
predicting ground level incremental pollutant
concentrations from particular emissions would run
considerably over a hundred, 95% or more of these
essentially revert to a Gaussian equation, the general
form of which in case of single steady-state continuous
point source of emission is
- y 2
C(x,y,z,He) = 0 e 2 fv?
2 " . v.ffjz
(z-He)2
-(z+He)2
2.-^2 r 7
v -j
1
I
J
,-Wherc. He = Effective height of the stack emission
above G.L.
x,y,z = Coortinates taking the foot of the stack
or the projection of the point of
emission on G.L. as the origin and thf*
average downwind direction as the x
axis; the cross-wind horizontal
direction becomes y axis and the
vertical the z axis.
Q = Mass rate of pollutant emission (s^i
grams /sec) .
u = The average wind-speed
= Lateral dispersion/spread or plume at a
distance x downwind from origin.
Vertical dispersion/spread of plume at a
distance x downwind from origin.
C(x,y,z,He)= Incremental pollutant concentrations at
the point x,y,z due to emissions
released at a height He above origin or
o , o , o .
P
5
2.6 Meteorological data needed
modelling shall include:
for pollutant-dispersion
a. Average Wind Direction to define coordinates
b. Average Wind-speed to provide u
c. Atmospheric Stability to determine / , z and
class He
d. Ambient Temperature : to calculate He
e. Atmospheric Temperature : to calculate He, or to
Lapse Rate determine stability i
some models
f. Incoming solar rediation : to determine "stability
and out-going earth's Class" in some models
re-radiation
All models need (a), (b) and (c) above, while some also
need (d) (e) and (f)
2.7 All meteorological characteristics keep varying from
moment to moment and taking long-time average values
for wind-direction, wind-speed, atmospheric-stability
or even ambient temperature shall be meaningless as the
inter-relationships are not arithmatic or straight line
ones but are very complex. The most reliable approach
may be to take sets of values corresponding to small
specific time periods, compute pollutant concentra-
tions for these small periods and then integrate these
for longer periods, as necessary. Very short initial
averaging periods become impractical due to effort and
cost involved. Practical approach would be to collect
data for 30/60 minute averaging period and either to
carry out computations individually for each such
period and then integrate, or to generate frequency
distributions .for Wind speed-direction-stability
combinations, termed" Stability Wind-roses" and work on
the basis of these. The second approach saves computer
time,but cannot be as reliable or informative as the
6
first particularly if variations and peak concentra-
tions are to be evaluated. And these should always be
of interest even if standards do not talk about them.
Another major question is as to where these wouiJ be
done. Wind-speeds know to vary with height as dcas
temerature and lapse rate and as was ovserved in our
stuides in northern India, even wind direction.
(See Tables 2 & 3). In such a case what point these
characteristics (wind-direction, wind-speed, ambient
temperataure) should relate to? obviously the most
critical would be the values of these parameters at
the point(and height) of pollutant emission though an
idea of variations with height wouil also be desirable
even if not essential.
While parameters like wind-direction,wind-speed amient
temperature and even lapse-rate are easily understood
and their method of determmination well known,
definition and determination of stabliityclasses.
On which so much depends is a much more hazy area. A
preliminary discussion of the simpler approaches is
given is Section 4.
THERMAL STRATIFIICATION AND MIXING HEIGHTS
A considerably complicting facator in modelling
pollutant dispersion is the thermal stratification
existing of the atmosphere, particularly in the ground
layer. Differential heating/ cooling of the different
layers results, in density stratifications, the most
critical of which beacome thermal inversions where
warm layers sitting over colder ones act almost as
flexible lids and block vertical diffusion/dispersion
across them. The inversion occuring close to the
ground surface almost each night and per-down periods,
caused by the back radiation from heated earth-surface
7
and buildiny structures are termed "yround-based
inversion" and very significantly affect pollutant -
dispersions and consequent environmental impacts. The
understanding and characterisation of these inversions
is absolutely essential to any meaninyful modelling of
pollutant dispersions, (see Fig.l)
3.2 By acting as sort of Flexible lids, to block vertical
dispersion, inversions limit the height of the
atmosphere to which it could be considered a mixed
fluid medium. The constrained heights within which
mixing is allowed to take place are termed "Mixiny
Heiyhts" of the atmosphere. It should be obvious that
pollutants discharged within the "mixiny heiyht" zone
shall disperse only within this zone, while those
discharyed above the level of "mixiny heiyht" shall not
come to the yround untill the inversion breaks.
3.3 Conventional pollutant-dispersion modelliny takes
thermal stratification and consequent "mixiny heiyhts"
into account in three ways:
a. Accountiny for these in selection of the
"stability-class".
b. Limitiny maximum plume-rise to (mixiny heiyht-
physical stack heiyht) when the physical stack
top is within the mixiny zone.
c. Limitiny maximum z to mixiny heiyht when the
emission is released within the mixiny zone.
Better and more exact accountiny of thermal strati-
fication in modelliny shall be hiyh'ly desirable even if
rather complex.
3.4 Indian Meteoroloy ica.l Department carries out
measurements of thermal stratifications at selected
8
meteorological stations daily at 5.30 hrs morning and
evening by a technique called "Radio-Sonde". The
technique involves release of a hydrogen-filled ballon
into the atmosphere carrying sensors and transmitter?-;
to signal temperature, pressure, humidity etc. as the
baloon rises up in the atmosphere, thus providing the
thermal structure of the atmosphere. The exact
position of the baloon is tracked by sensitive
instruments at all moments. From the data, the
lapse-rates of different layers and the mixing heiyht
for the time of measurement are obtained. The values
are then extrapolated for other timings of that day.
Such tests are extremely costly, need very sophisti-
cated instrumentation and are not possible for location
of pollutant sources. One has to accept data from
nearest IMD station to be applicable which is rarely
true. A major weakness of "Radio-Sonde" technique and
the data provided by it is that is provides thermal
structure only beyond the lowest 300-400 m above ground
And it is only these lowest 300-400 m that are most
important from air-pollution modelling point of view.
3.5 An alternative shall be to use a tethered hydrogen-
filled baloon carrying an appropriate thermistor cabled
to an instrument on the ground. The baloon can be
lowered/raised to different • heights and the thermal
structure at different times of the day obtained. The
study can be conducted at the sites of proposed
emission sources, or close to existing sources. Some
typical shapes obtained , during Envirotech studies are
given in Fig.l. Although theoretically there is no
limitation, in practice it shall be difficult to use
this method above 100-150 m height above ground. The
method is not automatic and is suite cumbersome.
Capital costs are low but cost of baloons and of
hydrogen supply make operational costs sizeable.
9
3.6 An instrumental technique called "SODAR" is a more
practical alternative. The technique uses longitudinal
(ultra-sound) waves transmitted through a special
antenna and the waves reflected by various atmospheric
non-homoyenuities monitored and interpreted. The
instrumentation now developed and available in India
from National Physical Laboratory New Delhi provides a
continuous picture of stratification and other
atmospheric structures. A typical plot is shown in
Fig.2. From this the mixing heiyhts can be easily
computed. The mixing heights near the J.K. Cement Plant
at Nimbahera, Rajasthan, the first industrial house in
India to commission such environmental studies in India
for parts of recent • months are yiven in Fig 3. The
installation shall cost around Rs.10 lakhs and operating
costs shall be about Rs.'l.O lakh /Year. Thus the method
is not cheap but the information provided by it are
invaluable.
4. DETERMINATION OF STABILITY CLASS.
4.1 As had been discussed in Section 2, determination of
the Stability status or class is essential step in all
pollution-dispersion modelling. There are a number of
alternative methods proposed and used for selecting
"Stability Class" applicable at a particular location
at a Particular time. Some of these are briefly
discussed below:
a. Turner's Table: The simplest method is to use
Turner's Table as given in Table-1 which needs
only average wind-speed and some qualitative
information about solar radiation/cloud cover.
Being very simple and needing very little data, it
is almost the universally adopted method in India.
b. Wind speed nd In-coming/Out-goiny radiation: This
is an improvement over Turner's Table by replacing
the qualitative day/night and solar-radiation/
10
cloud-cover data by actually measurement radiation
data .
Richardson Number Method: Richardson number, or
Bulk Richardson Number Ri, is defined as
R i = g O / z) where y is the acceleration due to
gravity, o the ambient potential temperature, o/ z
the gradient of potential temperature with height
and u/ z the gradient of average wind velocity
with height. Negative Values of Ri indicate
unstable and turbulent atmosphere, larger the
numberical value more the unstability. Zero value
of Ri indicates neutral atmosphere and positive
values "Stable" conditions. Higher the value,
higher the stability.
Slade's Approach (4.5): This uses the
wind-direction fluctuation range over an hour to
compute surface turbulance, o, and the Pasquill's
Stability Class (A to F) is assigned based on the
Value of o.
Stability Length Approach: Stability Length, L,
absolute
the Von
constant
specific
energy and u*, the shear velocity is given by* _
u =( - ) 1/2, being the eddy shear stress.
Dr.Swadas in his Ph.D Thesis (6) described a
method to compute L from , the standard
deviation of wind-direction fluctuations. For
was defind by Monnin - Ob ikhov as below:
L = -u*3
R (q) (H)
1 Cp
L = - u *3 Where T is the
K(g ) (H) temperature.
T p
g the acceleration due to gravity, k
Karman constant CP the specific heat at
pressure, the density of air, H the
11
neutral (or adiabatic) atmosphere, L becomes
infinte, it is negative for unstable conditions
and positive for stable conditions, the numerical
values indicating the extent of stability or
in-stability.
f. SODAR Method: The SODAR plots can also be used to
determine Stability class.
g. There could be other approaches also involving
other micrometeorological characteristics. In fact
there can probably be no micrometeorological
parameter which is not related to Stability Class
and perfact determination of stability appears an
impossible task.
. Table 2 shows some typical Stability Classes as
determined by two different methods. -
4.2 The above discussion would make it abundantly clear
that determining the Stability Class is by far the most
critical, the most difficult and the most doubtful and
hazy step in the entire modelling exercise.
5 . C U R R E N T P R A C T I C E O F O B T A I N I N G M E T E O R O L O G I C A L D A T A
5.1 The most common current practice of consultants and
other agencies involved with EIAs or predicting air
„ pollutant dispersions for other purposes is to obtain
meteorological data from IMD publication such as the
30-years average or "normals" for various parameters
published in book-worm (7). The tables in this
publication provide monthly average frequency
distributions for the morning and evening times for
wind directions divided in 16 sectors and also the
percentage of calm periods. They also yive the average
number of days in the month with wind speeds above 20
km pH. Obviously these data are not adequate to plot
12
wind-roses, to select stability classes or to carry out
any dispersion modelling by any method whatever.
On special arrangement, and on payment, IMD provides
wind-speed and direction-recorder data that can be used
to compile wind-roses. Data on cloud-cover, solar-
radiation, mixing heights etc. can also be obtained
from IMD on special arrangement. However all these data
are for the locations where IMD operates Met-Stations,
with appropriate instrumentation. Thus Radio-Sonde
measurements are carried out only at some 20 stations
spread around the country. Also the wind data is
recorded at 10 m height above G.L.
In many cases, often to satisfy requirements laid down
by Pollution Control Boards, Departments of Environment
and other regulatory agencies, large industrial
establishments (or their consultants) set up weather
monitoring stations. These stations conventionally
include facilities to record temperature, humidity,
pressure, wind speed and wind-direction. Measurements
of lapse-rates, velocity-gradients, solar-radiation or
mixing heights are rarely done.
SHORTCOMINGS OF CURRENT METEOROLOGICAL FRAMEWORK
The shortcomings or lacunae in the meteorological data
currently used (or made available) for dispersion
modelling can be grouped as below:
a. Applicability for the location and height of the
emission source and dispersion area.
b. Parameters needed but usually not done or
available.
c. Reliability, frequency and format of data.
13
6.2 Applicability of Data of Nearest IMD Station: IMD
stations are located at a few selected cities generally
at air-ports. Air-ports are almost always in plain-open
terrain, 15-20 kms or even more from the cities. Thus
while these stations shall provide reliable data on
regional meteorology, they shall not apply to built up,
habitated or industrial areas. The differences between
the met-dta for the Palam Air-port and the Safdarjang
Air-port, the two stations maintained in Delhi and
barely 20 kms apart, shall amply prove this point. How
justified would it be to use Palam data for Panipat,
Karnal, Meerut or Moradabad if it does not hold for
Saf-darjang? And in such a case how meaningful it would
be to carry -out modelling exercises using data from-
far-away IMD stations, separated by undulating
landscape.
6.3 Applicability of IMD Radio-Sonde Data: Besides the fact
of such data being non-applicable due to intervening
distance and terrain separating the point of interest
from the rather sparsely distributed Radio-Sonde
stations, the "mixing-height" and "inversion" data
available has another problem - Radio-Sonde is blind to
the 300-400m surface layer closest to the ground. Since
in air-quality management, it is the layers closest to
the ground that are most important, the "Radio-Sonde"
data is near-useless so far as pollutant-dispersion
modelling is concerned. Desired instrumentation in this
area shall be "SODAR" which can sense layers from 50 to
2000m from GL.
6.4 Applicability of Wind data taken at 10m Height:
Traditionally wind-speed and direction data are
monitored at 10m height above G.L. by DMD as also all
consultants and other agencies. Recording data at this
standard height helps meteorologists compare the wind-
status of different locations. However, the 10m height
data has no relevance to air quality modelling or
14
management. Again in traditional practice one assumes
that wind-direction does not change with height while
wind-speed increases as one goes up, varyiny with
height according to a power-law. Monitoring by
Envirotech at several locations in Northern Indian
plains (including locations in Rajasthan, M .P., U.P.,
Bihar and Assam) have shown that none of the above
.hold, particularly- under conditions of stable
atmosphere and low mixing heights which happen to be
the most critical conditions from air-guality
management point of view. Some recent data from
Nimbahera Rajasthan, given in table 2 and 3 amply
demonstrate it. Thus for meaningful pollution-
dispersion modelling, wind speed and direction
measurements should be done as close as possible to the
height of the emission cource, and not at the standard
10m height.
6.5 Parameters needed for Reliable Stability Classi-
fication: As discussed in Section 4, the weakest link
in dispersion-modelling is the "Stability Class" and
the normal method of determining stability using
turners table is not very reliable. Table 3 gives the
Stability Classes for Nimbahera as determined using
Turner's Table as also those based on Richardson
Number. Obviously Stability Class based on Richardson
Number or on Stability Length or mixing height should
better represent the actual state of the atmosphere
than that based on general judgements or even actual
measurements on incoming or* nett rediation.
7. CHOICE OF DISPERSION MODELS
7.1 ISI/Bureau of Indian Standards suggested the use of
Pasqu.ill-Gif ford and Mc-ElRoy' s models for flat and
undulating terrains respectively in IS-8829. The
choice was guided by the simplicity of the models than
any validation for Indian conditions. Unfortunately
15
it were termed only a "Guideline", there has been
little effort to' validate the models on field and the
models have been applied as Gospel Truth in most
modelling exercises. This should not be allowed to
continue, without adequate validation on field.
7.2 During the past decade, USEPA and other agencies in the
developed countries have developed a number of new
models, e.g. PEM-I, PEM-II, CDM etc. each suited to
handle a particular situation. Package computer-
programmes for these models are paraded as panacea for
modelling needs, are sold for high costs and are used
by consultants as "Statussymbols" and for winning jobs.
Obviously none of these can be considered better than
Pasquill-Gifford or Mc-Ebroy's, until these are
validated on field under Indian conditions-such as a
very large percentage of calm period, very low mixing
heights etc. The same can be said about the various
plume-rise models.
7.3 Currently the best bet seems to be to use - IS: 8829
procedures and in parallel also the models and approach
developed by Prof. M.P. Singh and his group at the
Centre of Atmospheric Sciences, IIT, New Delhi. The
latter though so far not tested under many field
situations, has been especially developed in India,
for Indian conditions, and the limited validation
exercises so far indicate this to be better than other
models tried by the Centre.
8 . SUMMERY AND RECOMMENDATIONS
In summary the following recommendations are made:
(i) Meteorological data should be collected at site.
Modelling on basis of data from the nearest IMD
station is meaningless and may be used only for
preliminary estimates.
16
(ii) Wind data, both speed and direction and
temperature need to be measured at a height as
close to the height of emission as possible. This
implies use of a tall mast and it should be
possible to also measure the parameters at 10m
height and/or some other heights by installing
additional sensors without too large an increase
in cost. The advantages of this will be to
compute Richardson numbers and also much better
overall understanding.
(iii) If logger based instrumentation is used, such as
WM-200, one can directly get hourly average wind-
speed, wind-direction and temperatures as also the
provide additional alternatives for selecting
stability class or using models that need such
data. Two sets of sensors to give these 5
parameters (speed, direction, temperature, jfu and
^ 0) at two different heights on a single mast-
should give enough meteorological data to try
alternate approaches to stability selection and
modelling (it may be mentioned that humidity or
pressure measurements would be unnecessary cost
increases and even radiation recording shall be
much more "costly than the advantage it can
provide).
(iv) If funds permit, installing and operating a SODAR
at the site shall be highly desirable. For large
projects it should be a must.
(v) Several alternative models should be tried and the
one giving the -best field validation for the
particular site or similar conditions should be
adopted.
standard deviations. These can
(vi) A lot of field research is needed in this critical
1?
T A B L E - I
IS 1 8829 - 1978
t a b l e i pasquill stability classes
( Clou.U 3.3.1 )
Suaificr Wind
Speid (it 10m )
Day TIKI IN8OL>
S i r o n g M o d e r a t e S l i g h t
(1) (2) (3) (<)
rr.; i
LeU than 2 A - B B
,,' . , 2 A - B B C
,, 4 B B - C C
,. 6 C C - D D
More than 6 C D D
NIOHT TIME Conditions
8 Clout
Cover
(61
Thin Overcast J> 3,8 Cloud-
or < 4/8
Cloud Cover
(5) .
A
— Extremely unstable
B — Moderately unstable
C — Slightly unstable
E F
D ' E
D D
D D
D — Neutral '
E — Slightly stable
F — Moderately stable
C-a1
' F
°r { A
~B ) U,C
°C
J »"«! B similarly proceed for D — C and
-h^r.tyVc'le^l^^ol^devi^ 'm
P' i e s the amount of incoming solar radiation
' - U g h . * i n s o l a t i o n r e L . T " " 3 5 a " d ^ T h c ' ' < « > " * '
respectively Cr ,0 !
°Ur of
than 60° and less than 35*
IS I 8829 - 1978
2
O
in
cr
UJ
ex
ul
< 2
(_J UJ
^ o
ll
CO
en
UJ
CL
ts>
5 '
<i •
o _
f ~ u
zc ll
o Ll
" UJ
> O
t> o
18 •
•ta £ l E = : A .
C O M I V U I I s. CM c.<- A//VO - blfitL C I IC NS f T l ^ i t P f / l L N ' l HLu^lli
( IM /V AH t; tN
l-N.Cf.j'n uj
ony K - <w ! 2 £ S
1
- M 1 ? s -- l- 11 ( ; 9 - f 1 - S ! : s - 0 f( /
ic HI ; ?£«.. ft i f v H i ; ytV.Hl ; £ Ml i ^t'.-Ht w j -icf-H
L C (•{ S E j s iv I f: Mt E S E ! AlA/1 ; E N t . N E E s t E SE; s C i E
c cc A'n j t S E !
1
A j A ' £ ; N N £ | E N t £S£ :
C IvC S £ S S 1 v'
1
Atv j A A U i NAJt t / v t ' AJJ£ ij t N t T £ i u A E
L-'il-C Nt si.. A j A j
1
A j £ N £ N E ! t N t 1 AJ IzN E
c-Uoc- £ S t s 1 /Vv j N N E | /V/VE | Af/vf ; Ai/VE | £ N t jA'Aiv £A/£
C Sec A' S tv' N A i E j NMt j A/AjE n £ E S E ' A AN-J /V £
C&C(- S /Vk' j N t N t ! n e E N t AWE E
Ch-c- S S t !n a j £ ; E N t j AJE | h N t M £ £ N E A-'A'E (V, iV
CCLC- £<> t i
• . 1
K i l , N E £ s £ j N t t s E j N E N £ £ s £ S S
0C
I CO £ $ t j K S A A l t S E ! AiE | s £ NA/E /V/ViE E s t S 5 E'
CCC s e | s s u N t E S E ! E N E 1 N h E N E E s E S S"E"
HOC'
i
St V E N E t : s £ A/fc i t N E e a j e £ NE E N E S A
12 o f • 'j t ; IvSK N t . E s E /Vt ; E s t £ AlE S t S A'
roc- S E t s£ E s t | A/L- ; s t NE E s t
1
s £ SS £
ACO '5 ' S ' l £ N fc i
j
/VM E E SE A t £ N £ S t s s £
j1 S £ E N £ £ j E A t E N.E s eeE
l6oc fc S E j s u N t E s E A/ E fc AJt M £ £ v c s s" £
ROC S L | ' Si £ N N t t fc nail £ S E s s £
I'btC- S t i S 1- M E E S t /vifc t AiE £/VE s £ S £ SS'iv'
Eicc fc S t b s t £ M N t /WE £ A/£ A £ S t £ s £ '
LOCV £ S £ s £ N Ai£ NN£ £/Vt A/A£ £ . S £ N £ K'_s A1
2{CV /,'A£ • S U N £ £ N N E A A £ A' IV S
LltL'
£ S E 'siv' e • N N E N N E £ N t A/E S E s S U
£ A E IV'Siv' £ E S E N N £ £ N t N £ s S i- E
2<i00 £ S E J K- E
i
£ MN E E N t
i
E N £ £ N't"
i
s IE
NIMBAHERA ( R A J A S T H A N ) MARCH 6,91 B O K A J A N ( A S S A M ) J [ J N E 2 6 , 6 8
T Y P I C A L A T M O S P H E R I C THERMAL P R O F I L E S MONITORED BY ENVIROTECH
FIG.- 1
Meteorological Conditions and Air Pollution Modelling in Northern India

More Related Content

What's hot

TCDF Pitch at ECCA 2017 Innovation Day
TCDF Pitch at ECCA 2017 Innovation Day TCDF Pitch at ECCA 2017 Innovation Day
TCDF Pitch at ECCA 2017 Innovation Day Harilaos Loukos
 
IRJET-Critical Analysis of Wind on Vertical Tall Structures
IRJET-Critical Analysis of Wind on Vertical Tall StructuresIRJET-Critical Analysis of Wind on Vertical Tall Structures
IRJET-Critical Analysis of Wind on Vertical Tall StructuresIRJET Journal
 
Engineering hydrology lab manual
Engineering hydrology lab manualEngineering hydrology lab manual
Engineering hydrology lab manualalibhatti89
 

What's hot (7)

TCDF Pitch at ECCA 2017 Innovation Day
TCDF Pitch at ECCA 2017 Innovation Day TCDF Pitch at ECCA 2017 Innovation Day
TCDF Pitch at ECCA 2017 Innovation Day
 
Nc climate change model projections chapter final draft 06
Nc climate change model projections chapter  final draft   06Nc climate change model projections chapter  final draft   06
Nc climate change model projections chapter final draft 06
 
abstract PhD
abstract PhDabstract PhD
abstract PhD
 
IRJET-Critical Analysis of Wind on Vertical Tall Structures
IRJET-Critical Analysis of Wind on Vertical Tall StructuresIRJET-Critical Analysis of Wind on Vertical Tall Structures
IRJET-Critical Analysis of Wind on Vertical Tall Structures
 
Engineering hydrology lab manual
Engineering hydrology lab manualEngineering hydrology lab manual
Engineering hydrology lab manual
 
Event 31
Event 31Event 31
Event 31
 
K366470
K366470K366470
K366470
 

Similar to Meteorological Conditions and Air Pollution Modelling in Northern India

Air quality dispersion modeling
Air quality dispersion modelingAir quality dispersion modeling
Air quality dispersion modelingECRD IN
 
CP_Sens_NatHaz_Correction
CP_Sens_NatHaz_CorrectionCP_Sens_NatHaz_Correction
CP_Sens_NatHaz_CorrectionJustin Pringle
 
Climate_Modelling_Saurabh.pdf
Climate_Modelling_Saurabh.pdfClimate_Modelling_Saurabh.pdf
Climate_Modelling_Saurabh.pdfAtikNawaz2
 
Paper id 36201531
Paper id 36201531Paper id 36201531
Paper id 36201531IJRAT
 
Technical Considerations of Adopting AERMOD into Australia and New Zealand
Technical Considerations of Adopting AERMOD into Australia and New Zealand Technical Considerations of Adopting AERMOD into Australia and New Zealand
Technical Considerations of Adopting AERMOD into Australia and New Zealand BREEZE Software
 
Climate Visibility Prediction Using Machine Learning
Climate Visibility Prediction Using Machine LearningClimate Visibility Prediction Using Machine Learning
Climate Visibility Prediction Using Machine LearningIRJET Journal
 
Climate Visibility Prediction Using Machine Learning
Climate Visibility Prediction Using Machine LearningClimate Visibility Prediction Using Machine Learning
Climate Visibility Prediction Using Machine LearningIRJET Journal
 
Airpollution Dispersion And Modelling Using Computers Ub Chitranshi
Airpollution Dispersion And Modelling Using Computers  Ub ChitranshiAirpollution Dispersion And Modelling Using Computers  Ub Chitranshi
Airpollution Dispersion And Modelling Using Computers Ub ChitranshiKetan Wadodkar
 
Simulate the dispersion pattern of Suspended Particulate Matter in the vicini...
Simulate the dispersion pattern of Suspended Particulate Matter in the vicini...Simulate the dispersion pattern of Suspended Particulate Matter in the vicini...
Simulate the dispersion pattern of Suspended Particulate Matter in the vicini...IJERA Editor
 
Utilizing CALPUFF for Offshore and Nearshore Dispersion Modeling Analyses
 Utilizing CALPUFF for Offshore and Nearshore Dispersion Modeling Analyses  Utilizing CALPUFF for Offshore and Nearshore Dispersion Modeling Analyses
Utilizing CALPUFF for Offshore and Nearshore Dispersion Modeling Analyses BREEZE Software
 
20.18 Optimization Problems In Air Pollution Modeling
20.18 Optimization Problems In Air Pollution Modeling20.18 Optimization Problems In Air Pollution Modeling
20.18 Optimization Problems In Air Pollution ModelingKelly Lipiec
 
STUDY AND CONTROL THE IMPACT OF AVIATION AND CLIMATIC CHANGES AND METRICS
STUDY AND CONTROL THE IMPACT OF AVIATION AND CLIMATIC CHANGES AND METRICSSTUDY AND CONTROL THE IMPACT OF AVIATION AND CLIMATIC CHANGES AND METRICS
STUDY AND CONTROL THE IMPACT OF AVIATION AND CLIMATIC CHANGES AND METRICSIAEME Publication
 
An Evaluation Of Aermod Model Sensitivity To Variations In Landuse Characteri...
An Evaluation Of Aermod Model Sensitivity To Variations In Landuse Characteri...An Evaluation Of Aermod Model Sensitivity To Variations In Landuse Characteri...
An Evaluation Of Aermod Model Sensitivity To Variations In Landuse Characteri...BREEZE Software
 
Weather Shocks, Climate Change and Business Cycles
Weather Shocks, Climate Change and Business CyclesWeather Shocks, Climate Change and Business Cycles
Weather Shocks, Climate Change and Business CyclesEwen Gallic
 
stouffl_hyo13rapport
stouffl_hyo13rapportstouffl_hyo13rapport
stouffl_hyo13rapportLoïc Stouff
 
ASME Energy Sustainability 2016
ASME Energy Sustainability 2016ASME Energy Sustainability 2016
ASME Energy Sustainability 2016Saadat Khan
 

Similar to Meteorological Conditions and Air Pollution Modelling in Northern India (20)

Air quality dispersion modeling
Air quality dispersion modelingAir quality dispersion modeling
Air quality dispersion modeling
 
CP_Sens_NatHaz_Correction
CP_Sens_NatHaz_CorrectionCP_Sens_NatHaz_Correction
CP_Sens_NatHaz_Correction
 
CLIM Fall 2017 Course: Statistics for Climate Research, Analysis for Climate ...
CLIM Fall 2017 Course: Statistics for Climate Research, Analysis for Climate ...CLIM Fall 2017 Course: Statistics for Climate Research, Analysis for Climate ...
CLIM Fall 2017 Course: Statistics for Climate Research, Analysis for Climate ...
 
Am4103223229
Am4103223229Am4103223229
Am4103223229
 
Climate_Modelling_Saurabh.pdf
Climate_Modelling_Saurabh.pdfClimate_Modelling_Saurabh.pdf
Climate_Modelling_Saurabh.pdf
 
Paper id 36201531
Paper id 36201531Paper id 36201531
Paper id 36201531
 
Technical Considerations of Adopting AERMOD into Australia and New Zealand
Technical Considerations of Adopting AERMOD into Australia and New Zealand Technical Considerations of Adopting AERMOD into Australia and New Zealand
Technical Considerations of Adopting AERMOD into Australia and New Zealand
 
Climate Visibility Prediction Using Machine Learning
Climate Visibility Prediction Using Machine LearningClimate Visibility Prediction Using Machine Learning
Climate Visibility Prediction Using Machine Learning
 
Climate Visibility Prediction Using Machine Learning
Climate Visibility Prediction Using Machine LearningClimate Visibility Prediction Using Machine Learning
Climate Visibility Prediction Using Machine Learning
 
Airpollution Dispersion And Modelling Using Computers Ub Chitranshi
Airpollution Dispersion And Modelling Using Computers  Ub ChitranshiAirpollution Dispersion And Modelling Using Computers  Ub Chitranshi
Airpollution Dispersion And Modelling Using Computers Ub Chitranshi
 
Ocean Modelling
Ocean ModellingOcean Modelling
Ocean Modelling
 
Simulate the dispersion pattern of Suspended Particulate Matter in the vicini...
Simulate the dispersion pattern of Suspended Particulate Matter in the vicini...Simulate the dispersion pattern of Suspended Particulate Matter in the vicini...
Simulate the dispersion pattern of Suspended Particulate Matter in the vicini...
 
Mine Risk Control
Mine Risk ControlMine Risk Control
Mine Risk Control
 
Utilizing CALPUFF for Offshore and Nearshore Dispersion Modeling Analyses
 Utilizing CALPUFF for Offshore and Nearshore Dispersion Modeling Analyses  Utilizing CALPUFF for Offshore and Nearshore Dispersion Modeling Analyses
Utilizing CALPUFF for Offshore and Nearshore Dispersion Modeling Analyses
 
20.18 Optimization Problems In Air Pollution Modeling
20.18 Optimization Problems In Air Pollution Modeling20.18 Optimization Problems In Air Pollution Modeling
20.18 Optimization Problems In Air Pollution Modeling
 
STUDY AND CONTROL THE IMPACT OF AVIATION AND CLIMATIC CHANGES AND METRICS
STUDY AND CONTROL THE IMPACT OF AVIATION AND CLIMATIC CHANGES AND METRICSSTUDY AND CONTROL THE IMPACT OF AVIATION AND CLIMATIC CHANGES AND METRICS
STUDY AND CONTROL THE IMPACT OF AVIATION AND CLIMATIC CHANGES AND METRICS
 
An Evaluation Of Aermod Model Sensitivity To Variations In Landuse Characteri...
An Evaluation Of Aermod Model Sensitivity To Variations In Landuse Characteri...An Evaluation Of Aermod Model Sensitivity To Variations In Landuse Characteri...
An Evaluation Of Aermod Model Sensitivity To Variations In Landuse Characteri...
 
Weather Shocks, Climate Change and Business Cycles
Weather Shocks, Climate Change and Business CyclesWeather Shocks, Climate Change and Business Cycles
Weather Shocks, Climate Change and Business Cycles
 
stouffl_hyo13rapport
stouffl_hyo13rapportstouffl_hyo13rapport
stouffl_hyo13rapport
 
ASME Energy Sustainability 2016
ASME Energy Sustainability 2016ASME Energy Sustainability 2016
ASME Energy Sustainability 2016
 

More from ECRD IN

Spectrophotometer Meter
Spectrophotometer MeterSpectrophotometer Meter
Spectrophotometer MeterECRD IN
 
Quality Assurance and Quality Control
Quality Assurance and Quality ControlQuality Assurance and Quality Control
Quality Assurance and Quality ControlECRD IN
 
Basic Chemistry Concepts
Basic Chemistry ConceptsBasic Chemistry Concepts
Basic Chemistry ConceptsECRD IN
 
Measurement of Respirable Suspended Pm10 Particles
Measurement of Respirable Suspended Pm10 ParticlesMeasurement of Respirable Suspended Pm10 Particles
Measurement of Respirable Suspended Pm10 ParticlesECRD IN
 
Measurement of Hydrogen Ion Concentration (pH)
Measurement of Hydrogen Ion Concentration (pH)Measurement of Hydrogen Ion Concentration (pH)
Measurement of Hydrogen Ion Concentration (pH)ECRD IN
 
Determination of Suspended PM in Atmosphere
Determination of Suspended PM in AtmosphereDetermination of Suspended PM in Atmosphere
Determination of Suspended PM in AtmosphereECRD IN
 
Basic Statistics Concepts
Basic Statistics ConceptsBasic Statistics Concepts
Basic Statistics ConceptsECRD IN
 
Air Pollution, Sources and Characteristics
Air Pollution, Sources and CharacteristicsAir Pollution, Sources and Characteristics
Air Pollution, Sources and CharacteristicsECRD IN
 
Air Pollution Its Origin and Effects
Air Pollution Its Origin and EffectsAir Pollution Its Origin and Effects
Air Pollution Its Origin and EffectsECRD IN
 
Air Pollution and Meteorology
Air Pollution and MeteorologyAir Pollution and Meteorology
Air Pollution and MeteorologyECRD IN
 
Dust-Caused Respiratory Occupational Diseases
Dust-Caused Respiratory Occupational DiseasesDust-Caused Respiratory Occupational Diseases
Dust-Caused Respiratory Occupational DiseasesECRD IN
 
Air Quality Monitoring
Air Quality MonitoringAir Quality Monitoring
Air Quality MonitoringECRD IN
 
Approach & Strategy to Meet new Ambient Air Quality Standards
Approach & Strategy to Meet new Ambient Air Quality StandardsApproach & Strategy to Meet new Ambient Air Quality Standards
Approach & Strategy to Meet new Ambient Air Quality StandardsECRD IN
 
Monitoring CO -NDIR Method
Monitoring CO -NDIR MethodMonitoring CO -NDIR Method
Monitoring CO -NDIR MethodECRD IN
 
Appropriate Instruments & techniques for Complying with Air Quality Standards
Appropriate Instruments & techniques for Complying with Air Quality StandardsAppropriate Instruments & techniques for Complying with Air Quality Standards
Appropriate Instruments & techniques for Complying with Air Quality StandardsECRD IN
 
Techniques of Measurement of Organic Pollutants
Techniques of Measurement of Organic PollutantsTechniques of Measurement of Organic Pollutants
Techniques of Measurement of Organic PollutantsECRD IN
 
Envirotech APM 460 BL
Envirotech APM 460 BLEnvirotech APM 460 BL
Envirotech APM 460 BLECRD IN
 
Monitoring of Gaseous Pollutants
Monitoring of Gaseous PollutantsMonitoring of Gaseous Pollutants
Monitoring of Gaseous PollutantsECRD IN
 
Filter Extraction of Heavy Metal & Benzo Pyrene
Filter Extraction of Heavy Metal & Benzo PyreneFilter Extraction of Heavy Metal & Benzo Pyrene
Filter Extraction of Heavy Metal & Benzo PyreneECRD IN
 
Maintenance of High Volume Dust Repairable Sampler
Maintenance of High Volume Dust Repairable SamplerMaintenance of High Volume Dust Repairable Sampler
Maintenance of High Volume Dust Repairable SamplerECRD IN
 

More from ECRD IN (20)

Spectrophotometer Meter
Spectrophotometer MeterSpectrophotometer Meter
Spectrophotometer Meter
 
Quality Assurance and Quality Control
Quality Assurance and Quality ControlQuality Assurance and Quality Control
Quality Assurance and Quality Control
 
Basic Chemistry Concepts
Basic Chemistry ConceptsBasic Chemistry Concepts
Basic Chemistry Concepts
 
Measurement of Respirable Suspended Pm10 Particles
Measurement of Respirable Suspended Pm10 ParticlesMeasurement of Respirable Suspended Pm10 Particles
Measurement of Respirable Suspended Pm10 Particles
 
Measurement of Hydrogen Ion Concentration (pH)
Measurement of Hydrogen Ion Concentration (pH)Measurement of Hydrogen Ion Concentration (pH)
Measurement of Hydrogen Ion Concentration (pH)
 
Determination of Suspended PM in Atmosphere
Determination of Suspended PM in AtmosphereDetermination of Suspended PM in Atmosphere
Determination of Suspended PM in Atmosphere
 
Basic Statistics Concepts
Basic Statistics ConceptsBasic Statistics Concepts
Basic Statistics Concepts
 
Air Pollution, Sources and Characteristics
Air Pollution, Sources and CharacteristicsAir Pollution, Sources and Characteristics
Air Pollution, Sources and Characteristics
 
Air Pollution Its Origin and Effects
Air Pollution Its Origin and EffectsAir Pollution Its Origin and Effects
Air Pollution Its Origin and Effects
 
Air Pollution and Meteorology
Air Pollution and MeteorologyAir Pollution and Meteorology
Air Pollution and Meteorology
 
Dust-Caused Respiratory Occupational Diseases
Dust-Caused Respiratory Occupational DiseasesDust-Caused Respiratory Occupational Diseases
Dust-Caused Respiratory Occupational Diseases
 
Air Quality Monitoring
Air Quality MonitoringAir Quality Monitoring
Air Quality Monitoring
 
Approach & Strategy to Meet new Ambient Air Quality Standards
Approach & Strategy to Meet new Ambient Air Quality StandardsApproach & Strategy to Meet new Ambient Air Quality Standards
Approach & Strategy to Meet new Ambient Air Quality Standards
 
Monitoring CO -NDIR Method
Monitoring CO -NDIR MethodMonitoring CO -NDIR Method
Monitoring CO -NDIR Method
 
Appropriate Instruments & techniques for Complying with Air Quality Standards
Appropriate Instruments & techniques for Complying with Air Quality StandardsAppropriate Instruments & techniques for Complying with Air Quality Standards
Appropriate Instruments & techniques for Complying with Air Quality Standards
 
Techniques of Measurement of Organic Pollutants
Techniques of Measurement of Organic PollutantsTechniques of Measurement of Organic Pollutants
Techniques of Measurement of Organic Pollutants
 
Envirotech APM 460 BL
Envirotech APM 460 BLEnvirotech APM 460 BL
Envirotech APM 460 BL
 
Monitoring of Gaseous Pollutants
Monitoring of Gaseous PollutantsMonitoring of Gaseous Pollutants
Monitoring of Gaseous Pollutants
 
Filter Extraction of Heavy Metal & Benzo Pyrene
Filter Extraction of Heavy Metal & Benzo PyreneFilter Extraction of Heavy Metal & Benzo Pyrene
Filter Extraction of Heavy Metal & Benzo Pyrene
 
Maintenance of High Volume Dust Repairable Sampler
Maintenance of High Volume Dust Repairable SamplerMaintenance of High Volume Dust Repairable Sampler
Maintenance of High Volume Dust Repairable Sampler
 

Recently uploaded

Call Girls In Okhla DELHI ~9654467111~ Short 1500 Night 6000
Call Girls In Okhla DELHI ~9654467111~ Short 1500 Night 6000Call Girls In Okhla DELHI ~9654467111~ Short 1500 Night 6000
Call Girls In Okhla DELHI ~9654467111~ Short 1500 Night 6000Sapana Sha
 
Horizon Net Zero Dawn – keynote slides by Ben Abraham
Horizon Net Zero Dawn – keynote slides by Ben AbrahamHorizon Net Zero Dawn – keynote slides by Ben Abraham
Horizon Net Zero Dawn – keynote slides by Ben Abrahamssuserbb03ff
 
Booking open Available Pune Call Girls Parvati Darshan 6297143586 Call Hot I...
Booking open Available Pune Call Girls Parvati Darshan  6297143586 Call Hot I...Booking open Available Pune Call Girls Parvati Darshan  6297143586 Call Hot I...
Booking open Available Pune Call Girls Parvati Darshan 6297143586 Call Hot I...Call Girls in Nagpur High Profile
 
BOOK Call Girls in (Dwarka) CALL | 8377087607 Delhi Escorts Services
BOOK Call Girls in (Dwarka) CALL | 8377087607 Delhi Escorts ServicesBOOK Call Girls in (Dwarka) CALL | 8377087607 Delhi Escorts Services
BOOK Call Girls in (Dwarka) CALL | 8377087607 Delhi Escorts Servicesdollysharma2066
 
VIP Call Girls Service Chaitanyapuri Hyderabad Call +91-8250192130
VIP Call Girls Service Chaitanyapuri Hyderabad Call +91-8250192130VIP Call Girls Service Chaitanyapuri Hyderabad Call +91-8250192130
VIP Call Girls Service Chaitanyapuri Hyderabad Call +91-8250192130Suhani Kapoor
 
Call Girls In Faridabad(Ballabgarh) Book ☎ 8168257667, @4999
Call Girls In Faridabad(Ballabgarh) Book ☎ 8168257667, @4999Call Girls In Faridabad(Ballabgarh) Book ☎ 8168257667, @4999
Call Girls In Faridabad(Ballabgarh) Book ☎ 8168257667, @4999Tina Ji
 
VIP Kolkata Call Girl Kalighat 👉 8250192130 Available With Room
VIP Kolkata Call Girl Kalighat 👉 8250192130  Available With RoomVIP Kolkata Call Girl Kalighat 👉 8250192130  Available With Room
VIP Kolkata Call Girl Kalighat 👉 8250192130 Available With Roomdivyansh0kumar0
 
(ANAYA) Call Girls Hadapsar ( 7001035870 ) HI-Fi Pune Escorts Service
(ANAYA) Call Girls Hadapsar ( 7001035870 ) HI-Fi Pune Escorts Service(ANAYA) Call Girls Hadapsar ( 7001035870 ) HI-Fi Pune Escorts Service
(ANAYA) Call Girls Hadapsar ( 7001035870 ) HI-Fi Pune Escorts Serviceranjana rawat
 
(DIYA) Call Girls Sinhagad Road ( 7001035870 ) HI-Fi Pune Escorts Service
(DIYA) Call Girls Sinhagad Road ( 7001035870 ) HI-Fi Pune Escorts Service(DIYA) Call Girls Sinhagad Road ( 7001035870 ) HI-Fi Pune Escorts Service
(DIYA) Call Girls Sinhagad Road ( 7001035870 ) HI-Fi Pune Escorts Serviceranjana rawat
 
(NANDITA) Hadapsar Call Girls Just Call 7001035870 [ Cash on Delivery ] Pune ...
(NANDITA) Hadapsar Call Girls Just Call 7001035870 [ Cash on Delivery ] Pune ...(NANDITA) Hadapsar Call Girls Just Call 7001035870 [ Cash on Delivery ] Pune ...
(NANDITA) Hadapsar Call Girls Just Call 7001035870 [ Cash on Delivery ] Pune ...ranjana rawat
 
Call Girls Mumbai Gayatri 8617697112 Independent Escort Service Mumbai
Call Girls Mumbai Gayatri 8617697112 Independent Escort Service MumbaiCall Girls Mumbai Gayatri 8617697112 Independent Escort Service Mumbai
Call Girls Mumbai Gayatri 8617697112 Independent Escort Service MumbaiCall girls in Ahmedabad High profile
 
Hot Call Girls |Delhi |Preet Vihar ☎ 9711199171 Book Your One night Stand
Hot Call Girls |Delhi |Preet Vihar ☎ 9711199171 Book Your One night StandHot Call Girls |Delhi |Preet Vihar ☎ 9711199171 Book Your One night Stand
Hot Call Girls |Delhi |Preet Vihar ☎ 9711199171 Book Your One night Standkumarajju5765
 
Freegle User Survey as visual display - BH
Freegle User Survey as visual display - BHFreegle User Survey as visual display - BH
Freegle User Survey as visual display - BHbill846304
 
Mumbai Call Girls, 💞 Prity 9892124323, Navi Mumbai Call girls
Mumbai Call Girls, 💞  Prity 9892124323, Navi Mumbai Call girlsMumbai Call Girls, 💞  Prity 9892124323, Navi Mumbai Call girls
Mumbai Call Girls, 💞 Prity 9892124323, Navi Mumbai Call girlsPooja Nehwal
 
Call Girl Nagpur Roshni Call 7001035870 Meet With Nagpur Escorts
Call Girl Nagpur Roshni Call 7001035870 Meet With Nagpur EscortsCall Girl Nagpur Roshni Call 7001035870 Meet With Nagpur Escorts
Call Girl Nagpur Roshni Call 7001035870 Meet With Nagpur EscortsCall Girls in Nagpur High Profile
 
DENR EPR Law Compliance Updates April 2024
DENR EPR Law Compliance Updates April 2024DENR EPR Law Compliance Updates April 2024
DENR EPR Law Compliance Updates April 2024itadmin50
 
VIP Call Girl Gorakhpur Aashi 8250192130 Independent Escort Service Gorakhpur
VIP Call Girl Gorakhpur Aashi 8250192130 Independent Escort Service GorakhpurVIP Call Girl Gorakhpur Aashi 8250192130 Independent Escort Service Gorakhpur
VIP Call Girl Gorakhpur Aashi 8250192130 Independent Escort Service GorakhpurSuhani Kapoor
 
(AISHA) Wagholi Call Girls Just Call 7001035870 [ Cash on Delivery ] Pune Esc...
(AISHA) Wagholi Call Girls Just Call 7001035870 [ Cash on Delivery ] Pune Esc...(AISHA) Wagholi Call Girls Just Call 7001035870 [ Cash on Delivery ] Pune Esc...
(AISHA) Wagholi Call Girls Just Call 7001035870 [ Cash on Delivery ] Pune Esc...ranjana rawat
 
VIP Call Girls Moti Ganpur ( Hyderabad ) Phone 8250192130 | ₹5k To 25k With R...
VIP Call Girls Moti Ganpur ( Hyderabad ) Phone 8250192130 | ₹5k To 25k With R...VIP Call Girls Moti Ganpur ( Hyderabad ) Phone 8250192130 | ₹5k To 25k With R...
VIP Call Girls Moti Ganpur ( Hyderabad ) Phone 8250192130 | ₹5k To 25k With R...Suhani Kapoor
 

Recently uploaded (20)

Call Girls In Okhla DELHI ~9654467111~ Short 1500 Night 6000
Call Girls In Okhla DELHI ~9654467111~ Short 1500 Night 6000Call Girls In Okhla DELHI ~9654467111~ Short 1500 Night 6000
Call Girls In Okhla DELHI ~9654467111~ Short 1500 Night 6000
 
Horizon Net Zero Dawn – keynote slides by Ben Abraham
Horizon Net Zero Dawn – keynote slides by Ben AbrahamHorizon Net Zero Dawn – keynote slides by Ben Abraham
Horizon Net Zero Dawn – keynote slides by Ben Abraham
 
Booking open Available Pune Call Girls Parvati Darshan 6297143586 Call Hot I...
Booking open Available Pune Call Girls Parvati Darshan  6297143586 Call Hot I...Booking open Available Pune Call Girls Parvati Darshan  6297143586 Call Hot I...
Booking open Available Pune Call Girls Parvati Darshan 6297143586 Call Hot I...
 
BOOK Call Girls in (Dwarka) CALL | 8377087607 Delhi Escorts Services
BOOK Call Girls in (Dwarka) CALL | 8377087607 Delhi Escorts ServicesBOOK Call Girls in (Dwarka) CALL | 8377087607 Delhi Escorts Services
BOOK Call Girls in (Dwarka) CALL | 8377087607 Delhi Escorts Services
 
VIP Call Girls Service Chaitanyapuri Hyderabad Call +91-8250192130
VIP Call Girls Service Chaitanyapuri Hyderabad Call +91-8250192130VIP Call Girls Service Chaitanyapuri Hyderabad Call +91-8250192130
VIP Call Girls Service Chaitanyapuri Hyderabad Call +91-8250192130
 
Call Girls In Faridabad(Ballabgarh) Book ☎ 8168257667, @4999
Call Girls In Faridabad(Ballabgarh) Book ☎ 8168257667, @4999Call Girls In Faridabad(Ballabgarh) Book ☎ 8168257667, @4999
Call Girls In Faridabad(Ballabgarh) Book ☎ 8168257667, @4999
 
VIP Kolkata Call Girl Kalighat 👉 8250192130 Available With Room
VIP Kolkata Call Girl Kalighat 👉 8250192130  Available With RoomVIP Kolkata Call Girl Kalighat 👉 8250192130  Available With Room
VIP Kolkata Call Girl Kalighat 👉 8250192130 Available With Room
 
(ANAYA) Call Girls Hadapsar ( 7001035870 ) HI-Fi Pune Escorts Service
(ANAYA) Call Girls Hadapsar ( 7001035870 ) HI-Fi Pune Escorts Service(ANAYA) Call Girls Hadapsar ( 7001035870 ) HI-Fi Pune Escorts Service
(ANAYA) Call Girls Hadapsar ( 7001035870 ) HI-Fi Pune Escorts Service
 
(DIYA) Call Girls Sinhagad Road ( 7001035870 ) HI-Fi Pune Escorts Service
(DIYA) Call Girls Sinhagad Road ( 7001035870 ) HI-Fi Pune Escorts Service(DIYA) Call Girls Sinhagad Road ( 7001035870 ) HI-Fi Pune Escorts Service
(DIYA) Call Girls Sinhagad Road ( 7001035870 ) HI-Fi Pune Escorts Service
 
(NANDITA) Hadapsar Call Girls Just Call 7001035870 [ Cash on Delivery ] Pune ...
(NANDITA) Hadapsar Call Girls Just Call 7001035870 [ Cash on Delivery ] Pune ...(NANDITA) Hadapsar Call Girls Just Call 7001035870 [ Cash on Delivery ] Pune ...
(NANDITA) Hadapsar Call Girls Just Call 7001035870 [ Cash on Delivery ] Pune ...
 
Call Girls Mumbai Gayatri 8617697112 Independent Escort Service Mumbai
Call Girls Mumbai Gayatri 8617697112 Independent Escort Service MumbaiCall Girls Mumbai Gayatri 8617697112 Independent Escort Service Mumbai
Call Girls Mumbai Gayatri 8617697112 Independent Escort Service Mumbai
 
Hot Call Girls |Delhi |Preet Vihar ☎ 9711199171 Book Your One night Stand
Hot Call Girls |Delhi |Preet Vihar ☎ 9711199171 Book Your One night StandHot Call Girls |Delhi |Preet Vihar ☎ 9711199171 Book Your One night Stand
Hot Call Girls |Delhi |Preet Vihar ☎ 9711199171 Book Your One night Stand
 
Freegle User Survey as visual display - BH
Freegle User Survey as visual display - BHFreegle User Survey as visual display - BH
Freegle User Survey as visual display - BH
 
Mumbai Call Girls, 💞 Prity 9892124323, Navi Mumbai Call girls
Mumbai Call Girls, 💞  Prity 9892124323, Navi Mumbai Call girlsMumbai Call Girls, 💞  Prity 9892124323, Navi Mumbai Call girls
Mumbai Call Girls, 💞 Prity 9892124323, Navi Mumbai Call girls
 
Call Girl Nagpur Roshni Call 7001035870 Meet With Nagpur Escorts
Call Girl Nagpur Roshni Call 7001035870 Meet With Nagpur EscortsCall Girl Nagpur Roshni Call 7001035870 Meet With Nagpur Escorts
Call Girl Nagpur Roshni Call 7001035870 Meet With Nagpur Escorts
 
DENR EPR Law Compliance Updates April 2024
DENR EPR Law Compliance Updates April 2024DENR EPR Law Compliance Updates April 2024
DENR EPR Law Compliance Updates April 2024
 
Green Marketing
Green MarketingGreen Marketing
Green Marketing
 
VIP Call Girl Gorakhpur Aashi 8250192130 Independent Escort Service Gorakhpur
VIP Call Girl Gorakhpur Aashi 8250192130 Independent Escort Service GorakhpurVIP Call Girl Gorakhpur Aashi 8250192130 Independent Escort Service Gorakhpur
VIP Call Girl Gorakhpur Aashi 8250192130 Independent Escort Service Gorakhpur
 
(AISHA) Wagholi Call Girls Just Call 7001035870 [ Cash on Delivery ] Pune Esc...
(AISHA) Wagholi Call Girls Just Call 7001035870 [ Cash on Delivery ] Pune Esc...(AISHA) Wagholi Call Girls Just Call 7001035870 [ Cash on Delivery ] Pune Esc...
(AISHA) Wagholi Call Girls Just Call 7001035870 [ Cash on Delivery ] Pune Esc...
 
VIP Call Girls Moti Ganpur ( Hyderabad ) Phone 8250192130 | ₹5k To 25k With R...
VIP Call Girls Moti Ganpur ( Hyderabad ) Phone 8250192130 | ₹5k To 25k With R...VIP Call Girls Moti Ganpur ( Hyderabad ) Phone 8250192130 | ₹5k To 25k With R...
VIP Call Girls Moti Ganpur ( Hyderabad ) Phone 8250192130 | ₹5k To 25k With R...
 

Meteorological Conditions and Air Pollution Modelling in Northern India

  • 1. I METEOROLOGICAL CONDITIONS IN NORTHERN INDIA AND AIR ~ POLLUTION DISPERSION MODELLING By Dr. G-D. Agc^r.wal, Technical Advisor Envirotech Instruments (P) Ltd., New Delhi. INTRODUCTION substainable Development the Key to Environmental Protection: For developing countries like India, it can never be a question of choosing between environment and development - the nation stands to lose if one were to be chosen at the cost of the other. The interests of the nation lie only in planning development in a manner that it shall not harm or adversely affect our natural resources or environmental quality in either the short or in the long rui and shall in other words be sust- ainable. Modelling the Key to planning for Substainable Development: As would be obvious, all planning involves some assessment or prediction of future. Ensuring that the proposed projects or activities shall be sustainable and shall not affect environmental quality in the long run requires reliable prediction of future impacts. And such prediction shall need to be well- quantified to help decide the extents to which development can be sustained by a local environment and also to decide appropriate technologies, designs and polluti on-control or amelioration measures. An EIA (Environmental Impact Assessment) without quantitative modelling of cause-effect relationships is little mor- than a set of apprehensions or platitudes. Pollutant Dispersion Modelling Key to Air Quality Management: Thus the most important tool to ambient air-quality management in India to ensure that human activities do not deyrade air-quality that start
  • 2. 2 adversely affecting ecological or other sensitive interests, becomes mathematical modelling of the dispersion or spread of the pollutants in the atmosphere. In the absence of reliable modelling of such dispersion, decisions on site clearance of proposed projects, fixing of emission limits, design of stacks and of pollution control equipments shall all either be oversafe (and hence, in a way, development restrictive) or undersafe (and hence shall damage environmental quality). For rational and optimal decisions, it is absolutely imperitive to develop models that shall provide practically reliable air- quality predications. 1.4 Meteorology the Most Critical Factor: Meteorology being the science that defines all physical characteristics of the atmosphere including all forms and factors of it's movement and the spread of pollutants, - modelling of such spread becomes intrinsically dependent not only on having reliable and appropriate meteorological data but also on having a good practical understanding of the meteorology of the area. It is not adequate for environmental scientists, .particularly those involved with air-quality-management or with carrying out EIAs for air-polluting activities, to collect data from the meteorological department, IMD or to refer to IMD for advice but to understand the behaviour themselves so as to correctly decide the data needs. And when necessary, these scientists/engineers have to be able to make appropriate meteorological measurements themselves. 1.5 This paper discusses some meteorological behaviours observed during environmental studies in the plains of northern India and their relevance to mathematical modelling of dispersion of air pollutants. It brings out the need for intensive collection of appropriate location-specific meteorological data as also of use of models that have been validated on field under Indian Conditions.
  • 3. 3 2.2 On a first look one may feel that the only meteorolo- gical parameter involved in the equation is u, the average wind speed. But soon one would realise that both yy and Jz. very much depend on meteorological conditions that control atmospheric dispersivities. In fact all the different models proposed (100 or more in number) are merely efforts to obtain better estimates of y and z under the complex meteorological controlling-1 * factors and/or to account for in a realistic manner, the variations in ^ and^z from point to point and from moment to moment. Most models classify the meteoro- logical conditions controlling the dispersivities into a number of Stability Classes and then provide equations to compute^y and for each Stability-Class. The most popular classification has been the 6-class passquill-Gifford-Turner (1,2) system, later extended by Holz-worth (3) to add a seventh G stability-class to the original A to F. 2.3 The effective height, He, is not the physical height of the stack but has to include the plume-rise due to thermal and inertial factors. Plume rise again depends on meteorological factors including wind speed, ambient temperature and atmospheric stability. 2.4 Even the coordinates x and y are not independent of meteorology, since the average down-wind direction decides the x-axis, and any change in wind direction shall change the coordinates of all points and in turn also affectyy,y~z and all other terms. 2.5 Overall one could say that all terms in the basic model equation depend on meteorological data, except the rate of emission Q, and the vertical coordinates z. Obviously the reliability of modelling results becomes very intimately related to obtaining appropriate and reliable meteorological data.
  • 4. BASIC AIR-DISPERSION MODELS AND METEOROLOGICAL DATA NEEDED While the number of mathematical models proposed for predicting ground level incremental pollutant concentrations from particular emissions would run considerably over a hundred, 95% or more of these essentially revert to a Gaussian equation, the general form of which in case of single steady-state continuous point source of emission is - y 2 C(x,y,z,He) = 0 e 2 fv? 2 " . v.ffjz (z-He)2 -(z+He)2 2.-^2 r 7 v -j 1 I J ,-Wherc. He = Effective height of the stack emission above G.L. x,y,z = Coortinates taking the foot of the stack or the projection of the point of emission on G.L. as the origin and thf* average downwind direction as the x axis; the cross-wind horizontal direction becomes y axis and the vertical the z axis. Q = Mass rate of pollutant emission (s^i grams /sec) . u = The average wind-speed = Lateral dispersion/spread or plume at a distance x downwind from origin. Vertical dispersion/spread of plume at a distance x downwind from origin. C(x,y,z,He)= Incremental pollutant concentrations at the point x,y,z due to emissions released at a height He above origin or o , o , o . P
  • 5. 5 2.6 Meteorological data needed modelling shall include: for pollutant-dispersion a. Average Wind Direction to define coordinates b. Average Wind-speed to provide u c. Atmospheric Stability to determine / , z and class He d. Ambient Temperature : to calculate He e. Atmospheric Temperature : to calculate He, or to Lapse Rate determine stability i some models f. Incoming solar rediation : to determine "stability and out-going earth's Class" in some models re-radiation All models need (a), (b) and (c) above, while some also need (d) (e) and (f) 2.7 All meteorological characteristics keep varying from moment to moment and taking long-time average values for wind-direction, wind-speed, atmospheric-stability or even ambient temperature shall be meaningless as the inter-relationships are not arithmatic or straight line ones but are very complex. The most reliable approach may be to take sets of values corresponding to small specific time periods, compute pollutant concentra- tions for these small periods and then integrate these for longer periods, as necessary. Very short initial averaging periods become impractical due to effort and cost involved. Practical approach would be to collect data for 30/60 minute averaging period and either to carry out computations individually for each such period and then integrate, or to generate frequency distributions .for Wind speed-direction-stability combinations, termed" Stability Wind-roses" and work on the basis of these. The second approach saves computer time,but cannot be as reliable or informative as the
  • 6. 6 first particularly if variations and peak concentra- tions are to be evaluated. And these should always be of interest even if standards do not talk about them. Another major question is as to where these wouiJ be done. Wind-speeds know to vary with height as dcas temerature and lapse rate and as was ovserved in our stuides in northern India, even wind direction. (See Tables 2 & 3). In such a case what point these characteristics (wind-direction, wind-speed, ambient temperataure) should relate to? obviously the most critical would be the values of these parameters at the point(and height) of pollutant emission though an idea of variations with height wouil also be desirable even if not essential. While parameters like wind-direction,wind-speed amient temperature and even lapse-rate are easily understood and their method of determmination well known, definition and determination of stabliityclasses. On which so much depends is a much more hazy area. A preliminary discussion of the simpler approaches is given is Section 4. THERMAL STRATIFIICATION AND MIXING HEIGHTS A considerably complicting facator in modelling pollutant dispersion is the thermal stratification existing of the atmosphere, particularly in the ground layer. Differential heating/ cooling of the different layers results, in density stratifications, the most critical of which beacome thermal inversions where warm layers sitting over colder ones act almost as flexible lids and block vertical diffusion/dispersion across them. The inversion occuring close to the ground surface almost each night and per-down periods, caused by the back radiation from heated earth-surface
  • 7. 7 and buildiny structures are termed "yround-based inversion" and very significantly affect pollutant - dispersions and consequent environmental impacts. The understanding and characterisation of these inversions is absolutely essential to any meaninyful modelling of pollutant dispersions, (see Fig.l) 3.2 By acting as sort of Flexible lids, to block vertical dispersion, inversions limit the height of the atmosphere to which it could be considered a mixed fluid medium. The constrained heights within which mixing is allowed to take place are termed "Mixiny Heiyhts" of the atmosphere. It should be obvious that pollutants discharged within the "mixiny heiyht" zone shall disperse only within this zone, while those discharyed above the level of "mixiny heiyht" shall not come to the yround untill the inversion breaks. 3.3 Conventional pollutant-dispersion modelliny takes thermal stratification and consequent "mixiny heiyhts" into account in three ways: a. Accountiny for these in selection of the "stability-class". b. Limitiny maximum plume-rise to (mixiny heiyht- physical stack heiyht) when the physical stack top is within the mixiny zone. c. Limitiny maximum z to mixiny heiyht when the emission is released within the mixiny zone. Better and more exact accountiny of thermal strati- fication in modelliny shall be hiyh'ly desirable even if rather complex. 3.4 Indian Meteoroloy ica.l Department carries out measurements of thermal stratifications at selected
  • 8. 8 meteorological stations daily at 5.30 hrs morning and evening by a technique called "Radio-Sonde". The technique involves release of a hydrogen-filled ballon into the atmosphere carrying sensors and transmitter?-; to signal temperature, pressure, humidity etc. as the baloon rises up in the atmosphere, thus providing the thermal structure of the atmosphere. The exact position of the baloon is tracked by sensitive instruments at all moments. From the data, the lapse-rates of different layers and the mixing heiyht for the time of measurement are obtained. The values are then extrapolated for other timings of that day. Such tests are extremely costly, need very sophisti- cated instrumentation and are not possible for location of pollutant sources. One has to accept data from nearest IMD station to be applicable which is rarely true. A major weakness of "Radio-Sonde" technique and the data provided by it is that is provides thermal structure only beyond the lowest 300-400 m above ground And it is only these lowest 300-400 m that are most important from air-pollution modelling point of view. 3.5 An alternative shall be to use a tethered hydrogen- filled baloon carrying an appropriate thermistor cabled to an instrument on the ground. The baloon can be lowered/raised to different • heights and the thermal structure at different times of the day obtained. The study can be conducted at the sites of proposed emission sources, or close to existing sources. Some typical shapes obtained , during Envirotech studies are given in Fig.l. Although theoretically there is no limitation, in practice it shall be difficult to use this method above 100-150 m height above ground. The method is not automatic and is suite cumbersome. Capital costs are low but cost of baloons and of hydrogen supply make operational costs sizeable.
  • 9. 9 3.6 An instrumental technique called "SODAR" is a more practical alternative. The technique uses longitudinal (ultra-sound) waves transmitted through a special antenna and the waves reflected by various atmospheric non-homoyenuities monitored and interpreted. The instrumentation now developed and available in India from National Physical Laboratory New Delhi provides a continuous picture of stratification and other atmospheric structures. A typical plot is shown in Fig.2. From this the mixing heiyhts can be easily computed. The mixing heights near the J.K. Cement Plant at Nimbahera, Rajasthan, the first industrial house in India to commission such environmental studies in India for parts of recent • months are yiven in Fig 3. The installation shall cost around Rs.10 lakhs and operating costs shall be about Rs.'l.O lakh /Year. Thus the method is not cheap but the information provided by it are invaluable. 4. DETERMINATION OF STABILITY CLASS. 4.1 As had been discussed in Section 2, determination of the Stability status or class is essential step in all pollution-dispersion modelling. There are a number of alternative methods proposed and used for selecting "Stability Class" applicable at a particular location at a Particular time. Some of these are briefly discussed below: a. Turner's Table: The simplest method is to use Turner's Table as given in Table-1 which needs only average wind-speed and some qualitative information about solar radiation/cloud cover. Being very simple and needing very little data, it is almost the universally adopted method in India. b. Wind speed nd In-coming/Out-goiny radiation: This is an improvement over Turner's Table by replacing the qualitative day/night and solar-radiation/
  • 10. 10 cloud-cover data by actually measurement radiation data . Richardson Number Method: Richardson number, or Bulk Richardson Number Ri, is defined as R i = g O / z) where y is the acceleration due to gravity, o the ambient potential temperature, o/ z the gradient of potential temperature with height and u/ z the gradient of average wind velocity with height. Negative Values of Ri indicate unstable and turbulent atmosphere, larger the numberical value more the unstability. Zero value of Ri indicates neutral atmosphere and positive values "Stable" conditions. Higher the value, higher the stability. Slade's Approach (4.5): This uses the wind-direction fluctuation range over an hour to compute surface turbulance, o, and the Pasquill's Stability Class (A to F) is assigned based on the Value of o. Stability Length Approach: Stability Length, L, absolute the Von constant specific energy and u*, the shear velocity is given by* _ u =( - ) 1/2, being the eddy shear stress. Dr.Swadas in his Ph.D Thesis (6) described a method to compute L from , the standard deviation of wind-direction fluctuations. For was defind by Monnin - Ob ikhov as below: L = -u*3 R (q) (H) 1 Cp L = - u *3 Where T is the K(g ) (H) temperature. T p g the acceleration due to gravity, k Karman constant CP the specific heat at pressure, the density of air, H the
  • 11. 11 neutral (or adiabatic) atmosphere, L becomes infinte, it is negative for unstable conditions and positive for stable conditions, the numerical values indicating the extent of stability or in-stability. f. SODAR Method: The SODAR plots can also be used to determine Stability class. g. There could be other approaches also involving other micrometeorological characteristics. In fact there can probably be no micrometeorological parameter which is not related to Stability Class and perfact determination of stability appears an impossible task. . Table 2 shows some typical Stability Classes as determined by two different methods. - 4.2 The above discussion would make it abundantly clear that determining the Stability Class is by far the most critical, the most difficult and the most doubtful and hazy step in the entire modelling exercise. 5 . C U R R E N T P R A C T I C E O F O B T A I N I N G M E T E O R O L O G I C A L D A T A 5.1 The most common current practice of consultants and other agencies involved with EIAs or predicting air „ pollutant dispersions for other purposes is to obtain meteorological data from IMD publication such as the 30-years average or "normals" for various parameters published in book-worm (7). The tables in this publication provide monthly average frequency distributions for the morning and evening times for wind directions divided in 16 sectors and also the percentage of calm periods. They also yive the average number of days in the month with wind speeds above 20 km pH. Obviously these data are not adequate to plot
  • 12. 12 wind-roses, to select stability classes or to carry out any dispersion modelling by any method whatever. On special arrangement, and on payment, IMD provides wind-speed and direction-recorder data that can be used to compile wind-roses. Data on cloud-cover, solar- radiation, mixing heights etc. can also be obtained from IMD on special arrangement. However all these data are for the locations where IMD operates Met-Stations, with appropriate instrumentation. Thus Radio-Sonde measurements are carried out only at some 20 stations spread around the country. Also the wind data is recorded at 10 m height above G.L. In many cases, often to satisfy requirements laid down by Pollution Control Boards, Departments of Environment and other regulatory agencies, large industrial establishments (or their consultants) set up weather monitoring stations. These stations conventionally include facilities to record temperature, humidity, pressure, wind speed and wind-direction. Measurements of lapse-rates, velocity-gradients, solar-radiation or mixing heights are rarely done. SHORTCOMINGS OF CURRENT METEOROLOGICAL FRAMEWORK The shortcomings or lacunae in the meteorological data currently used (or made available) for dispersion modelling can be grouped as below: a. Applicability for the location and height of the emission source and dispersion area. b. Parameters needed but usually not done or available. c. Reliability, frequency and format of data.
  • 13. 13 6.2 Applicability of Data of Nearest IMD Station: IMD stations are located at a few selected cities generally at air-ports. Air-ports are almost always in plain-open terrain, 15-20 kms or even more from the cities. Thus while these stations shall provide reliable data on regional meteorology, they shall not apply to built up, habitated or industrial areas. The differences between the met-dta for the Palam Air-port and the Safdarjang Air-port, the two stations maintained in Delhi and barely 20 kms apart, shall amply prove this point. How justified would it be to use Palam data for Panipat, Karnal, Meerut or Moradabad if it does not hold for Saf-darjang? And in such a case how meaningful it would be to carry -out modelling exercises using data from- far-away IMD stations, separated by undulating landscape. 6.3 Applicability of IMD Radio-Sonde Data: Besides the fact of such data being non-applicable due to intervening distance and terrain separating the point of interest from the rather sparsely distributed Radio-Sonde stations, the "mixing-height" and "inversion" data available has another problem - Radio-Sonde is blind to the 300-400m surface layer closest to the ground. Since in air-quality management, it is the layers closest to the ground that are most important, the "Radio-Sonde" data is near-useless so far as pollutant-dispersion modelling is concerned. Desired instrumentation in this area shall be "SODAR" which can sense layers from 50 to 2000m from GL. 6.4 Applicability of Wind data taken at 10m Height: Traditionally wind-speed and direction data are monitored at 10m height above G.L. by DMD as also all consultants and other agencies. Recording data at this standard height helps meteorologists compare the wind- status of different locations. However, the 10m height data has no relevance to air quality modelling or
  • 14. 14 management. Again in traditional practice one assumes that wind-direction does not change with height while wind-speed increases as one goes up, varyiny with height according to a power-law. Monitoring by Envirotech at several locations in Northern Indian plains (including locations in Rajasthan, M .P., U.P., Bihar and Assam) have shown that none of the above .hold, particularly- under conditions of stable atmosphere and low mixing heights which happen to be the most critical conditions from air-guality management point of view. Some recent data from Nimbahera Rajasthan, given in table 2 and 3 amply demonstrate it. Thus for meaningful pollution- dispersion modelling, wind speed and direction measurements should be done as close as possible to the height of the emission cource, and not at the standard 10m height. 6.5 Parameters needed for Reliable Stability Classi- fication: As discussed in Section 4, the weakest link in dispersion-modelling is the "Stability Class" and the normal method of determining stability using turners table is not very reliable. Table 3 gives the Stability Classes for Nimbahera as determined using Turner's Table as also those based on Richardson Number. Obviously Stability Class based on Richardson Number or on Stability Length or mixing height should better represent the actual state of the atmosphere than that based on general judgements or even actual measurements on incoming or* nett rediation. 7. CHOICE OF DISPERSION MODELS 7.1 ISI/Bureau of Indian Standards suggested the use of Pasqu.ill-Gif ford and Mc-ElRoy' s models for flat and undulating terrains respectively in IS-8829. The choice was guided by the simplicity of the models than any validation for Indian conditions. Unfortunately
  • 15. 15 it were termed only a "Guideline", there has been little effort to' validate the models on field and the models have been applied as Gospel Truth in most modelling exercises. This should not be allowed to continue, without adequate validation on field. 7.2 During the past decade, USEPA and other agencies in the developed countries have developed a number of new models, e.g. PEM-I, PEM-II, CDM etc. each suited to handle a particular situation. Package computer- programmes for these models are paraded as panacea for modelling needs, are sold for high costs and are used by consultants as "Statussymbols" and for winning jobs. Obviously none of these can be considered better than Pasquill-Gifford or Mc-Ebroy's, until these are validated on field under Indian conditions-such as a very large percentage of calm period, very low mixing heights etc. The same can be said about the various plume-rise models. 7.3 Currently the best bet seems to be to use - IS: 8829 procedures and in parallel also the models and approach developed by Prof. M.P. Singh and his group at the Centre of Atmospheric Sciences, IIT, New Delhi. The latter though so far not tested under many field situations, has been especially developed in India, for Indian conditions, and the limited validation exercises so far indicate this to be better than other models tried by the Centre. 8 . SUMMERY AND RECOMMENDATIONS In summary the following recommendations are made: (i) Meteorological data should be collected at site. Modelling on basis of data from the nearest IMD station is meaningless and may be used only for preliminary estimates.
  • 16. 16 (ii) Wind data, both speed and direction and temperature need to be measured at a height as close to the height of emission as possible. This implies use of a tall mast and it should be possible to also measure the parameters at 10m height and/or some other heights by installing additional sensors without too large an increase in cost. The advantages of this will be to compute Richardson numbers and also much better overall understanding. (iii) If logger based instrumentation is used, such as WM-200, one can directly get hourly average wind- speed, wind-direction and temperatures as also the provide additional alternatives for selecting stability class or using models that need such data. Two sets of sensors to give these 5 parameters (speed, direction, temperature, jfu and ^ 0) at two different heights on a single mast- should give enough meteorological data to try alternate approaches to stability selection and modelling (it may be mentioned that humidity or pressure measurements would be unnecessary cost increases and even radiation recording shall be much more "costly than the advantage it can provide). (iv) If funds permit, installing and operating a SODAR at the site shall be highly desirable. For large projects it should be a must. (v) Several alternative models should be tried and the one giving the -best field validation for the particular site or similar conditions should be adopted. standard deviations. These can (vi) A lot of field research is needed in this critical
  • 17. 1? T A B L E - I IS 1 8829 - 1978 t a b l e i pasquill stability classes ( Clou.U 3.3.1 ) Suaificr Wind Speid (it 10m ) Day TIKI IN8OL> S i r o n g M o d e r a t e S l i g h t (1) (2) (3) (<) rr.; i LeU than 2 A - B B ,,' . , 2 A - B B C ,, 4 B B - C C ,. 6 C C - D D More than 6 C D D NIOHT TIME Conditions 8 Clout Cover (61 Thin Overcast J> 3,8 Cloud- or < 4/8 Cloud Cover (5) . A — Extremely unstable B — Moderately unstable C — Slightly unstable E F D ' E D D D D D — Neutral ' E — Slightly stable F — Moderately stable C-a1 ' F °r { A ~B ) U,C °C J »"«! B similarly proceed for D — C and -h^r.tyVc'le^l^^ol^devi^ 'm P' i e s the amount of incoming solar radiation ' - U g h . * i n s o l a t i o n r e L . T " " 3 5 a " d ^ T h c ' ' < « > " * ' respectively Cr ,0 ! °Ur of than 60° and less than 35* IS I 8829 - 1978 2 O in cr UJ ex ul < 2 (_J UJ ^ o ll CO en UJ CL ts> 5 ' <i • o _ f ~ u zc ll o Ll " UJ > O t> o
  • 18. 18 • •ta £ l E = : A . C O M I V U I I s. CM c.<- A//VO - blfitL C I IC NS f T l ^ i t P f / l L N ' l HLu^lli ( IM /V AH t; tN l-N.Cf.j'n uj ony K - <w ! 2 £ S 1 - M 1 ? s -- l- 11 ( ; 9 - f 1 - S ! : s - 0 f( / ic HI ; ?£«.. ft i f v H i ; ytV.Hl ; £ Ml i ^t'.-Ht w j -icf-H L C (•{ S E j s iv I f: Mt E S E ! AlA/1 ; E N t . N E E s t E SE; s C i E c cc A'n j t S E ! 1 A j A ' £ ; N N £ | E N t £S£ : C IvC S £ S S 1 v' 1 Atv j A A U i NAJt t / v t ' AJJ£ ij t N t T £ i u A E L-'il-C Nt si.. A j A j 1 A j £ N £ N E ! t N t 1 AJ IzN E c-Uoc- £ S t s 1 /Vv j N N E | /V/VE | Af/vf ; Ai/VE | £ N t jA'Aiv £A/£ C Sec A' S tv' N A i E j NMt j A/AjE n £ E S E ' A AN-J /V £ C&C(- S /Vk' j N t N t ! n e E N t AWE E Ch-c- S S t !n a j £ ; E N t j AJE | h N t M £ £ N E A-'A'E (V, iV CCLC- £<> t i • . 1 K i l , N E £ s £ j N t t s E j N E N £ £ s £ S S 0C I CO £ $ t j K S A A l t S E ! AiE | s £ NA/E /V/ViE E s t S 5 E' CCC s e | s s u N t E S E ! E N E 1 N h E N E E s E S S"E" HOC' i St V E N E t : s £ A/fc i t N E e a j e £ NE E N E S A 12 o f • 'j t ; IvSK N t . E s E /Vt ; E s t £ AlE S t S A' roc- S E t s£ E s t | A/L- ; s t NE E s t 1 s £ SS £ ACO '5 ' S ' l £ N fc i j /VM E E SE A t £ N £ S t s s £ j1 S £ E N £ £ j E A t E N.E s eeE l6oc fc S E j s u N t E s E A/ E fc AJt M £ £ v c s s" £ ROC S L | ' Si £ N N t t fc nail £ S E s s £ I'btC- S t i S 1- M E E S t /vifc t AiE £/VE s £ S £ SS'iv' Eicc fc S t b s t £ M N t /WE £ A/£ A £ S t £ s £ ' LOCV £ S £ s £ N Ai£ NN£ £/Vt A/A£ £ . S £ N £ K'_s A1 2{CV /,'A£ • S U N £ £ N N E A A £ A' IV S LltL' £ S E 'siv' e • N N E N N E £ N t A/E S E s S U £ A E IV'Siv' £ E S E N N £ £ N t N £ s S i- E 2<i00 £ S E J K- E i £ MN E E N t i E N £ £ N't" i s IE
  • 19. NIMBAHERA ( R A J A S T H A N ) MARCH 6,91 B O K A J A N ( A S S A M ) J [ J N E 2 6 , 6 8 T Y P I C A L A T M O S P H E R I C THERMAL P R O F I L E S MONITORED BY ENVIROTECH FIG.- 1