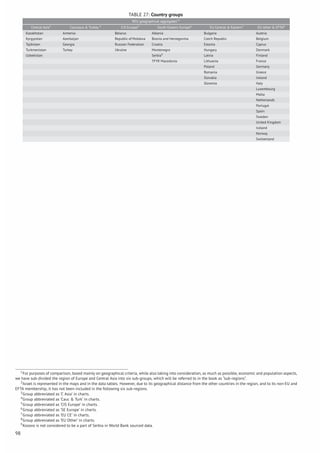
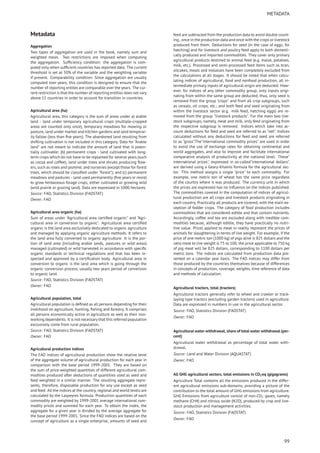
The document is the 2014 FAO Statistical Yearbook for Europe and Central Asia. It provides detailed data and trends on food and agriculture in the region. Some key facts:
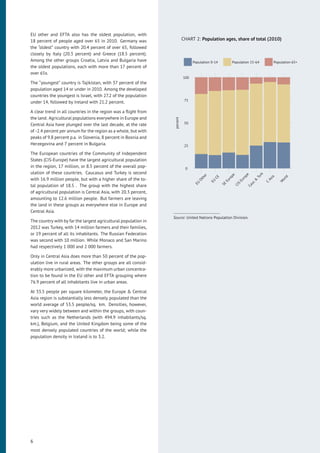
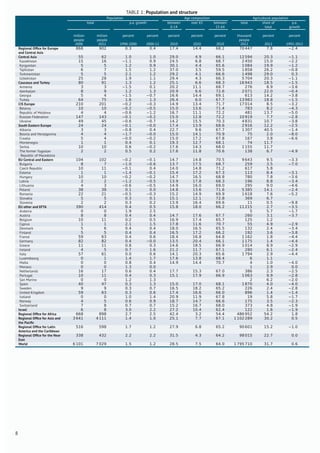
- Population in the region is aging, with those over 65 making up over 15% of the total in 2010.
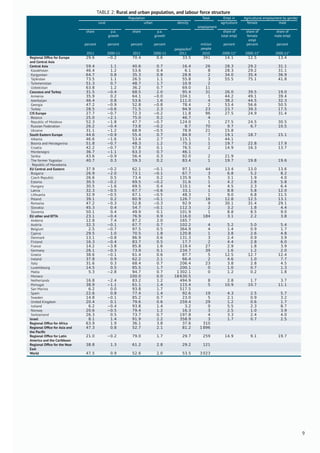
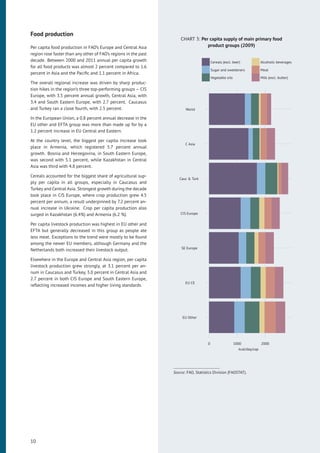
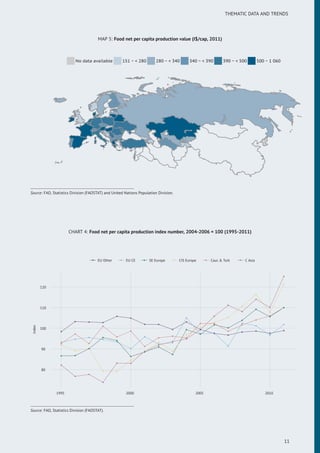
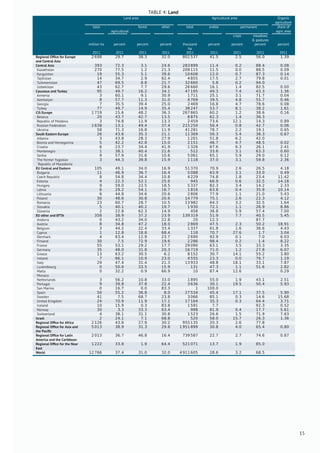
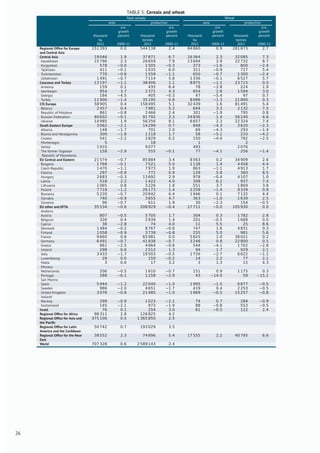
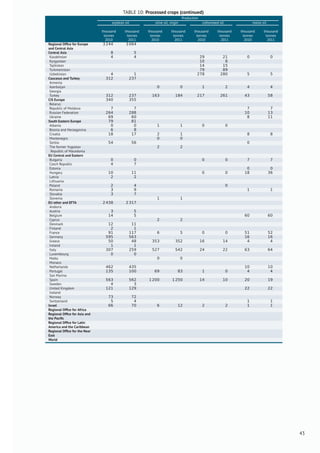
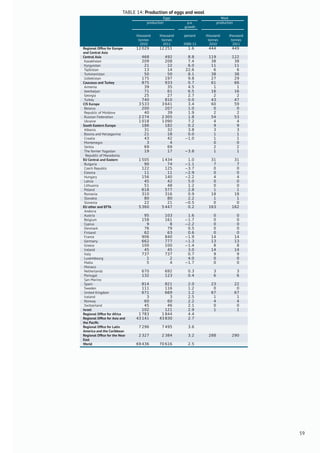
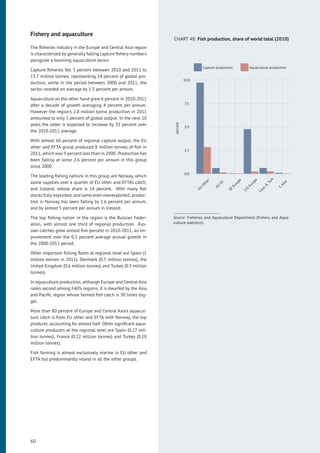
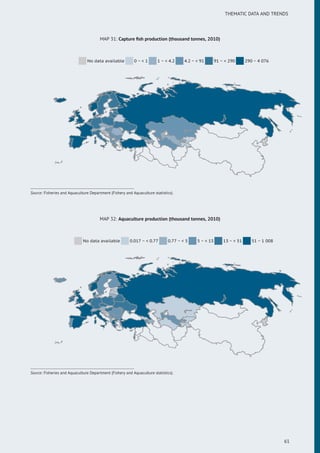
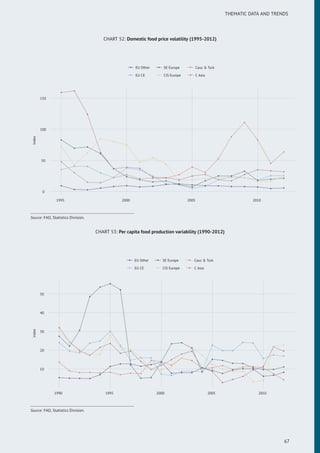
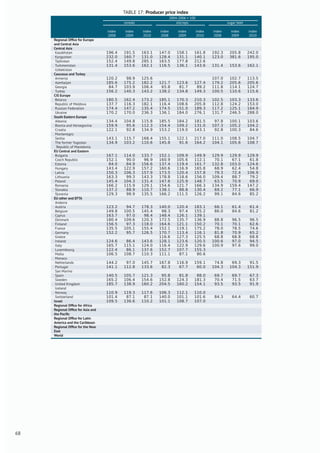
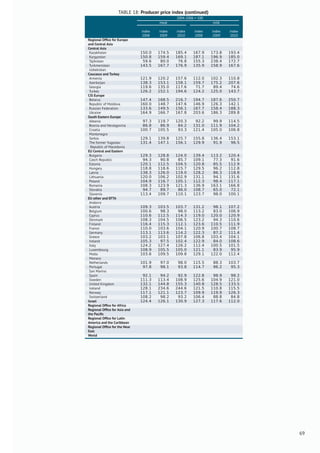
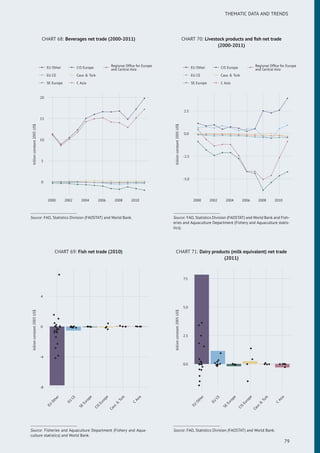
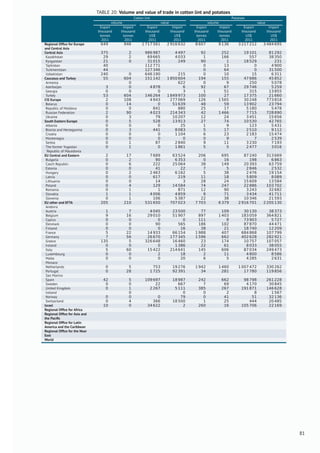
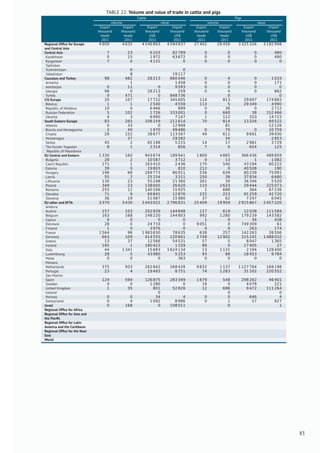
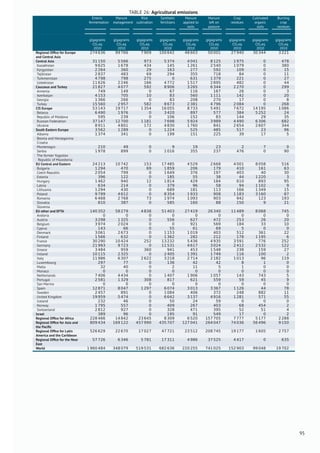
- Per capita supply of food was highest for cereals and lowest for fish. Total food production increased between 1995-2011.
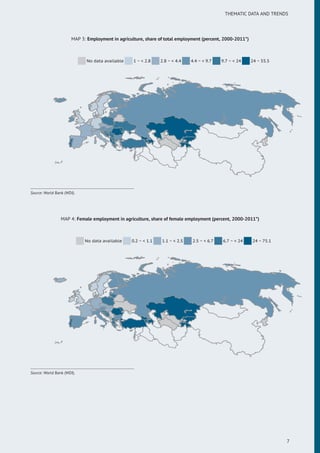
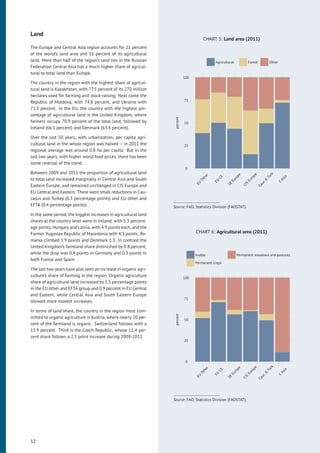
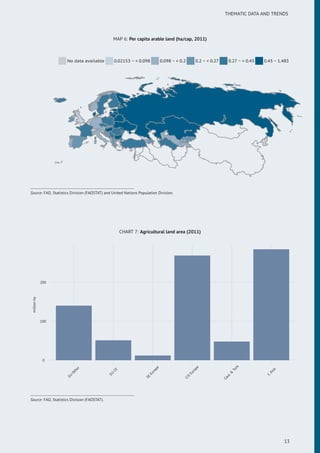
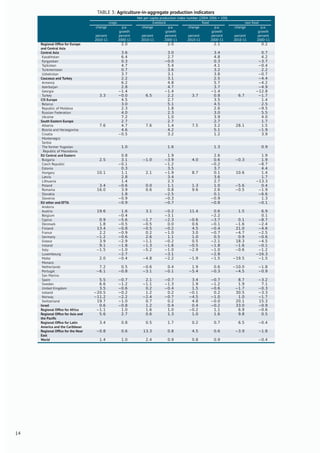
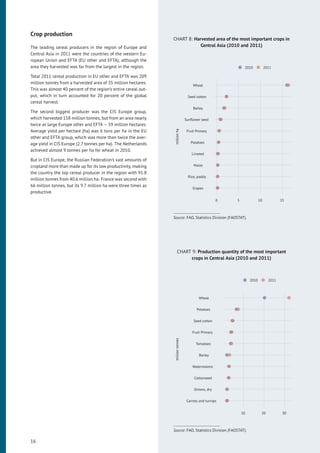
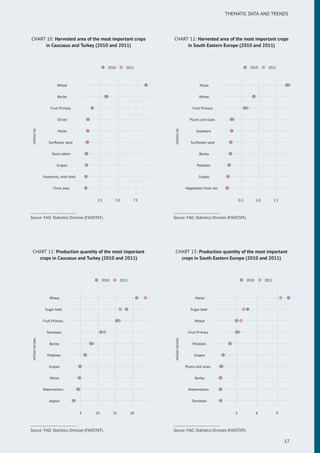
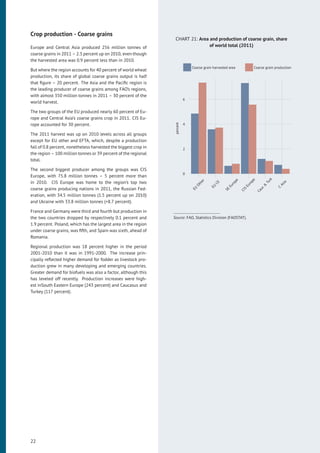
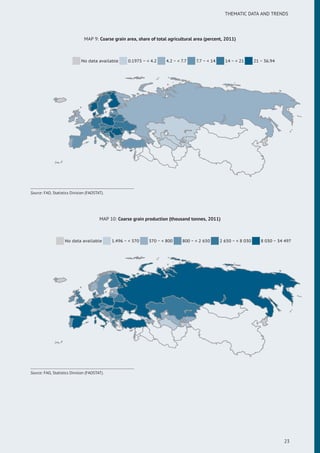
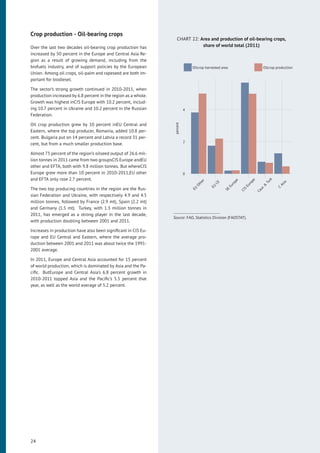
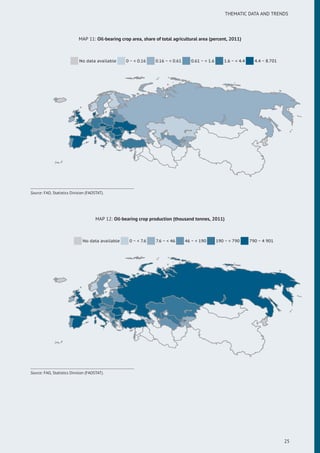
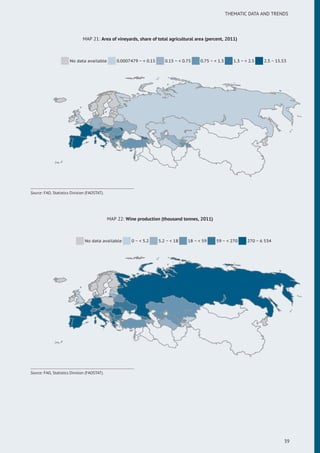
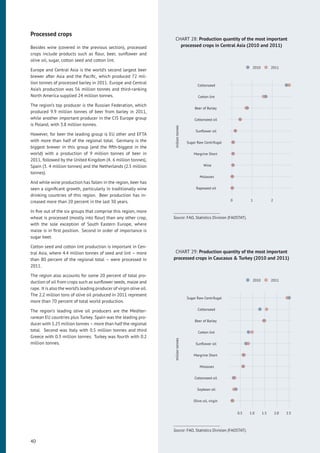
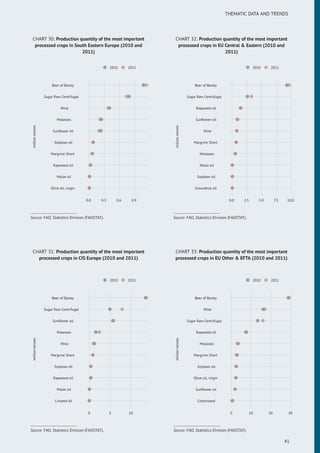
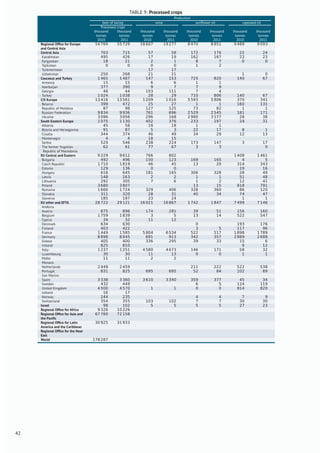
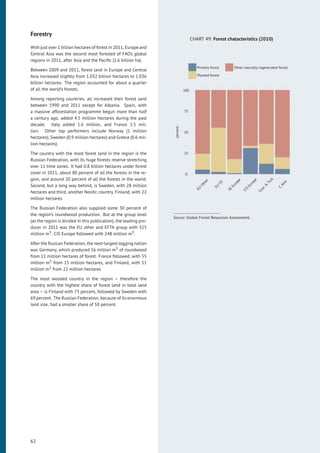
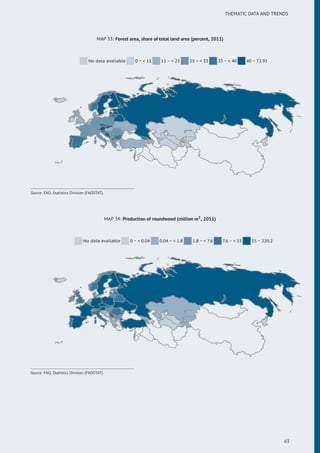
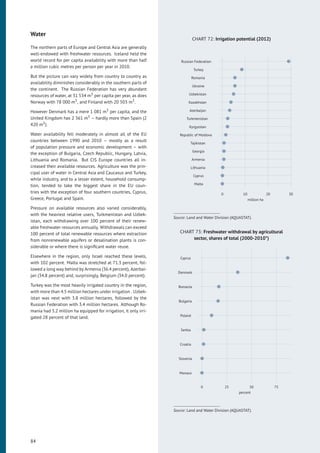
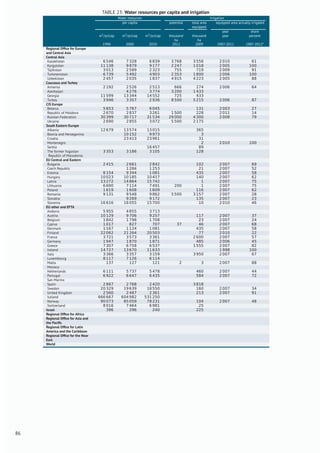
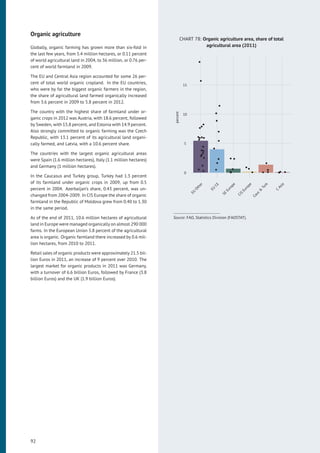
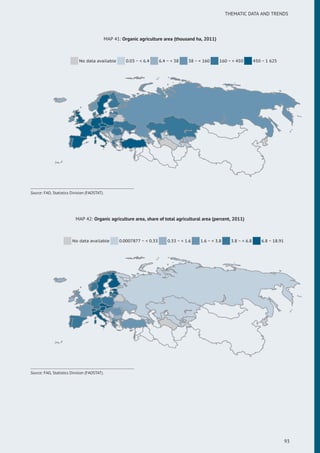
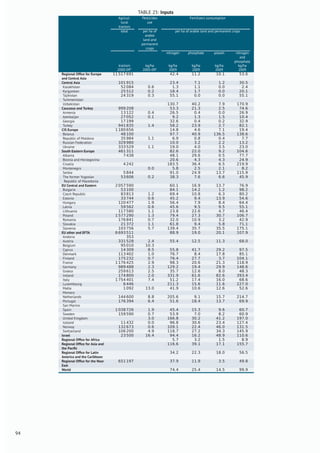
- Agricultural land makes up over 50% of total land area. Major crops include wheat, coarse grains, and oil-bearing crops.
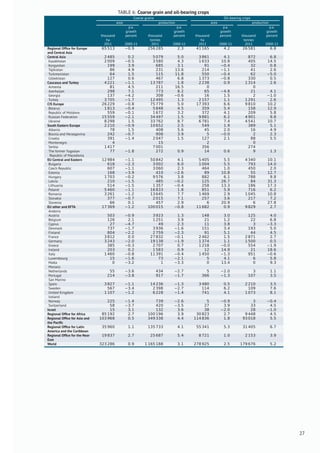
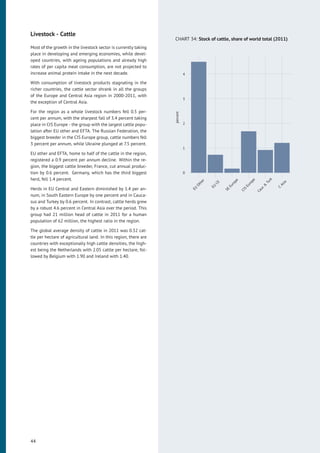
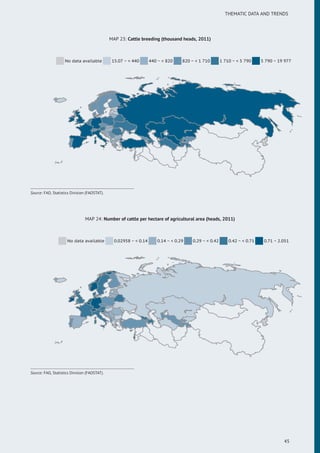
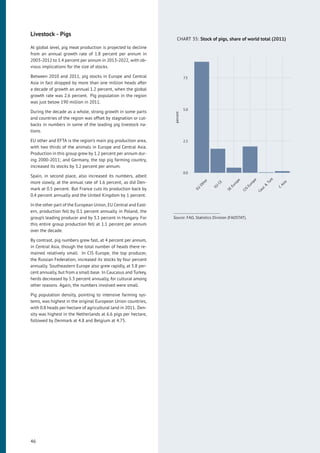
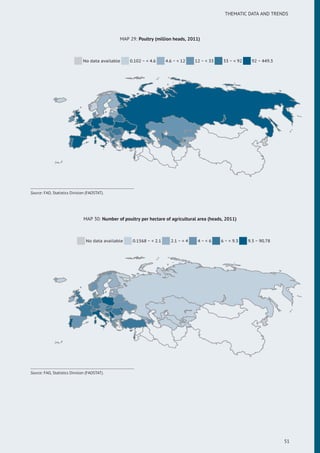
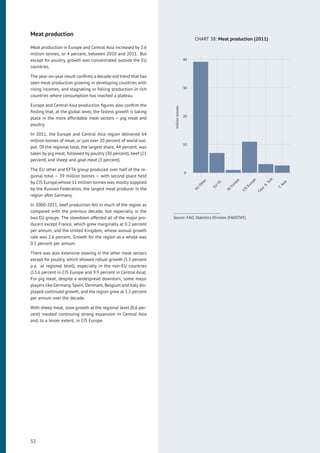
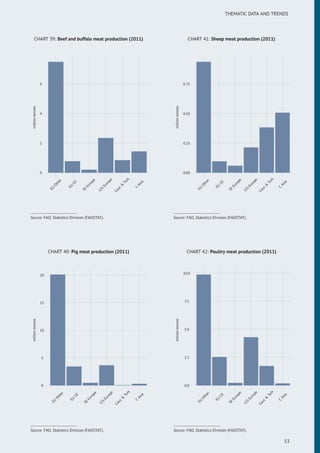
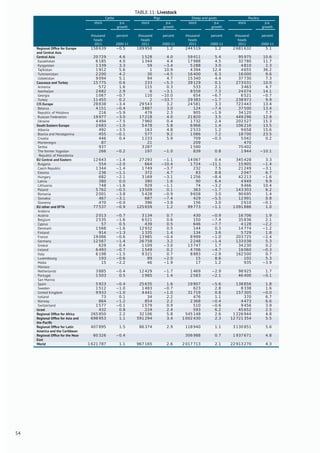
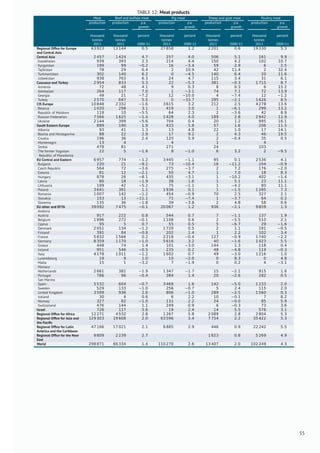
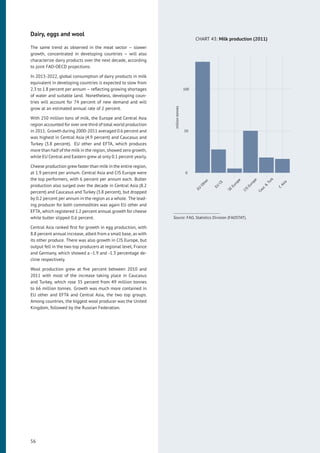
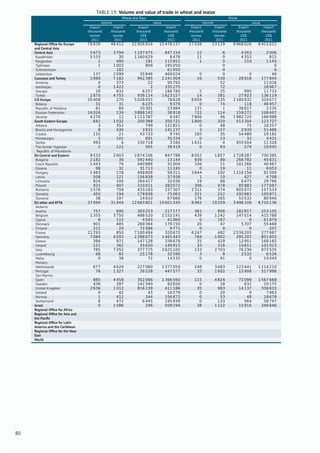
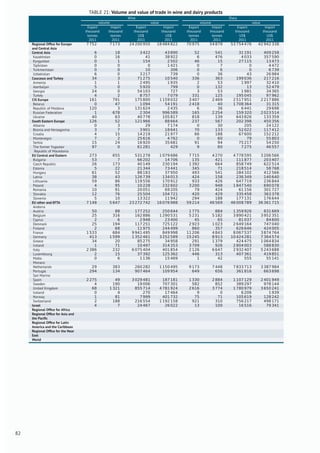
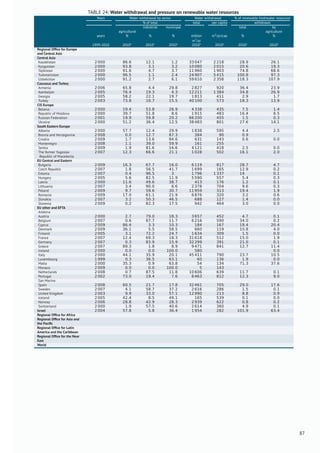
- Livestock is also important, with cattle, pigs, and poultry headcounts in the hundreds of millions. Meat and dairy production have