The document presents a comparison of optimization methods for cutting parameters in machining using Non-Dominated Sorting Genetic Algorithm (NSGA-II) and Micro Genetic Algorithm (MGA). It highlights the significance of selecting optimal cutting parameters—cutting speed, feed rate, depth of cut, and rake angle—to enhance surface finish and tool life criteria. The study finds that NSGA-II outperforms MGA in optimizing machining parameters, as evidenced by superior results in experiments conducted on ST-37 steel.
![Abolfazl Golshan, Mostafa Rezazadeh Shirdar & S.Izman
International Journal of Experimental Algorithms (IJEA), Volume (2) : Issue (2) : 2011 62
A Comparison of Optimization Methods in Cutting Parameters
Using Non-dominated Sorting Genetic Algorithm (NSGA-II) and
Micro Genetic Algorithm (MGA)
Abolfazl Golshan gabolfazl@gmail.com
Mechanical engineering/Mechanical engineering/Student
Isfahan University of Technology
Isfahan, 83111-84156, Iran
Mostafa Rezazadeh Shirdar mosico63@gmail.com
Advanced manufacturing/Mechanical engineering/Student
Universiti Teknologi Malaysia
Skudai, 81310, Malaysia
S.Izman izman@fkm.utm.my
Advanced manufacturing/Mechanical engineering/Assoc.prof
Universiti Teknologi Malaysia
Skudai, 81310, Malaysia
Abstract
Since cutting conditions have an influence on reducing the production cost and time and deciding the
quality of a final product the determination of optimal cutting parameters such as cutting speed, feed
rate, depth of cut and tool geometry is one of vital modules in process planning of metal parts. With
use of experimental results and subsequently, with exploitation of main effects plot, importance of
each parameter is studied. In this investigation these parameters was considered as input in order to
optimized the surface finish and tool life criteria, two conflicting objectives, as the process
performance simultaneously. In this study, micro genetic algorithm (MGA) and Non-dominated Sorting
Genetic Algorithm (NSGA-II) were compared with each other proving the superiority of Non-
dominated Sorting Genetic Algorithm over micro genetic since Non-dominated Sorting Genetic
Algorithm results were more satisfactory than micro genetic algorithm in terms of optimizing
machining parameters.
Keywords: Cutting Parameters, Surface Roughness, Tool life Criteria, Optimizing, NSGA-II, MGA,
1. INTRODUCTION
Proper selection of machining parameters such as depth of cut, feed rate, cutting speed and rake
angle for the best process performance is still challenging matter. In workshop practice cutting
parameters are selected from database or specialized hand book which is not necessarily optimum
value [1]. Optimization of cutting parameters is usually a difficult job because it requires both
machining operation experience and knowledge of mathematical algorithms simultaneously. The
traditional methods for optimization problems include calculus-based searches, dynamic
programming, random searches, and gradient methods whereas modern heuristic methods include
artificial neural networks [2], Lagrangian relaxation approaches [3], and simulated annealing [3].
Some of these methods are successful in locating the optimal solution, but they are usually slow in
convergence and require much computing time. Other methods may risk being trapped at a local
optimum which fails to give the best solution. In multiple performance optimizations, there is more
than one objective function, each of which may have a different optimal solution. Most of the time
these objectives conflict with one to another. [4,5]. Rozenek and his associations used a piecework
made of composite material with metal matrix composite and investigated the variation in feed rate
and surface roughness led by changing the corresponding parameters [6]. Tosun and his associations
used a statistical model for determining optimal parameters in order to minimize the holes led on the
wire during the process [7]. Tosun and Cogun conducted a research regarding the effect of machining
parameters on the rate of wire corrosion considering lessened weight from wire while being machined
[8]. Wang and his associations optimized process parameters in order to achieve optimal
performance using genetic algorithm (GA) with artificial neutral network (ANN). ANN is an approach](https://image.slidesharecdn.com/ijea-20-160305100747/85/A-Comparison-of-Optimization-Methods-in-Cutting-Parameters-Using-Non-dominated-Sorting-Genetic-Algorithm-NSGA-II-and-Micro-Genetic-Algorithm-MGA-1-320.jpg)
![Abolfazl Golshan, Mostafa Rezazadeh Shirdar & S.Izman
International Journal of Experimental Algorithms (IJEA), Volume (2) : Issue (2) : 2011 62
A Comparison of Optimization Methods in Cutting Parameters
Using Non-dominated Sorting Genetic Algorithm (NSGA-II) and
Micro Genetic Algorithm (MGA)
Abolfazl Golshan gabolfazl@gmail.com
Mechanical engineering/Mechanical engineering/Student
Isfahan University of Technology
Isfahan, 83111-84156, Iran
Mostafa Rezazadeh Shirdar mosico63@gmail.com
Advanced manufacturing/Mechanical engineering/Student
Universiti Teknologi Malaysia
Skudai, 81310, Malaysia
S.Izman izman@fkm.utm.my
Advanced manufacturing/Mechanical engineering/Assoc.prof
Universiti Teknologi Malaysia
Skudai, 81310, Malaysia
Abstract
Since cutting conditions have an influence on reducing the production cost and time and deciding the
quality of a final product the determination of optimal cutting parameters such as cutting speed, feed
rate, depth of cut and tool geometry is one of vital modules in process planning of metal parts. With
use of experimental results and subsequently, with exploitation of main effects plot, importance of
each parameter is studied. In this investigation these parameters was considered as input in order to
optimized the surface finish and tool life criteria, two conflicting objectives, as the process
performance simultaneously. In this study, micro genetic algorithm (MGA) and Non-dominated Sorting
Genetic Algorithm (NSGA-II) were compared with each other proving the superiority of Non-
dominated Sorting Genetic Algorithm over micro genetic since Non-dominated Sorting Genetic
Algorithm results were more satisfactory than micro genetic algorithm in terms of optimizing
machining parameters.
Keywords: Cutting Parameters, Surface Roughness, Tool life Criteria, Optimizing, NSGA-II, MGA,
1. INTRODUCTION
Proper selection of machining parameters such as depth of cut, feed rate, cutting speed and rake
angle for the best process performance is still challenging matter. In workshop practice cutting
parameters are selected from database or specialized hand book which is not necessarily optimum
value [1]. Optimization of cutting parameters is usually a difficult job because it requires both
machining operation experience and knowledge of mathematical algorithms simultaneously. The
traditional methods for optimization problems include calculus-based searches, dynamic
programming, random searches, and gradient methods whereas modern heuristic methods include
artificial neural networks [2], Lagrangian relaxation approaches [3], and simulated annealing [3].
Some of these methods are successful in locating the optimal solution, but they are usually slow in
convergence and require much computing time. Other methods may risk being trapped at a local
optimum which fails to give the best solution. In multiple performance optimizations, there is more
than one objective function, each of which may have a different optimal solution. Most of the time
these objectives conflict with one to another. [4,5]. Rozenek and his associations used a piecework
made of composite material with metal matrix composite and investigated the variation in feed rate
and surface roughness led by changing the corresponding parameters [6]. Tosun and his associations
used a statistical model for determining optimal parameters in order to minimize the holes led on the
wire during the process [7]. Tosun and Cogun conducted a research regarding the effect of machining
parameters on the rate of wire corrosion considering lessened weight from wire while being machined
[8]. Wang and his associations optimized process parameters in order to achieve optimal
performance using genetic algorithm (GA) with artificial neutral network (ANN). ANN is an approach](https://image.slidesharecdn.com/ijea-20-160305100747/75/A-Comparison-of-Optimization-Methods-in-Cutting-Parameters-Using-Non-dominated-Sorting-Genetic-Algorithm-NSGA-II-and-Micro-Genetic-Algorithm-MGA-1-2048.jpg)
![Abolfazl Golshan, Mostafa Rezazadeh Shirdar & S.Izman
International Journal of Experimental Algorithms (IJEA), Volume (2) : Issue (2) : 2011 63
used for modeling the process, where weight are updated by GA. Gen-Hunter software is used in
order to find out solutions for multi-objective problems concerning optimization phase. MRR and
surface roughness which are 2 output parameters are aimed here to be optimized as a process
performance [9]. Su and his associations have optimized the EDM parameters, from stage of the
rough cutting to the finish cutting. The relationship between the process parameters and machining
performance was established using a trained neutral network. Subsequently, GA with properly defined
objective functions was changed to the neutral network to find out the optimal process parameters.
For transformation of MRR, surface roughness and machine tool wear into a single objective, a simple
weighted method was used [10]. The generic algorithm (GA) is an evolutionary algorithm based on
the mechanic of natural selection and it combines the characteristic of direct search and probabilistic
selection method. It is a powerful tool for obtaining global values for multi-model and combinatorial
problems [11]. The GA operates on a population of potential solutions applying the principle of
survival of the fittest to produce better and better approximations to a solution. In this study, after
designing and obtaining the experimental data with a use of statistical model and main effect plots,
the most important parameters effective on average surface roughness (Ra) and also tool life criteria
(A) will be specified. Following the models obtained the comparison between two methods of non-
dominated sorting genetic algorithm (NSGA-II) and micro genetic algorithm (MGA) both will be
investigated.
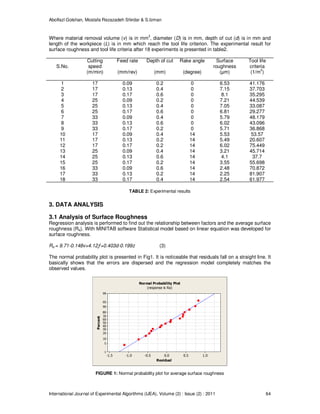
2. EXPERIMENTAL WORK
The work material used for the present investigation is ST-37 steel with the diameter of 45 mm and
length of 400 mm. For machining operation a Russian lath machine was used and the tool material
was HSS with clearance angle of 6°, back rake angle of 0°, side cutting edge angle of 90° and rake
angle which was variable during machining process.
For simultaneous investigation of variable affection such as cutting speed, feed rate, depth of cut and
rake angle the Taguchi method design of experiments with the use of MINITAB software was carried
out. The machining parameters used and their levels were presented in Table1. The values of the
levels were selected so that the standard values of parameters were included.
Cutting
parameters
unit symbol Levels
1 2 3
Cutting speed (m/min) v 17 25 33
Feed rate (mm/rev) ƒ 0.09 0.13 0.17
Depth of cut (mm) d 0.2 0.4 0.6
Rake angle (degree) z 0 14 -
TABLE 1: Machining parameters and their levels
Velocity of rotation for different diameters of workpiece and based on selected cutting speeds was
calculated from equation1.
N = (1)
Where diameter (D) is in mm, cutting speed (V) is in min/m and velocity of rotation (N) is in rev/min.
In this study tool life is defined by the volume of the material removed so that surface finish becomes
1.5 times higher than the initial surface roughness value at the beginning of machining operation.
1/v = (2)](https://image.slidesharecdn.com/ijea-20-160305100747/85/A-Comparison-of-Optimization-Methods-in-Cutting-Parameters-Using-Non-dominated-Sorting-Genetic-Algorithm-NSGA-II-and-Micro-Genetic-Algorithm-MGA-2-320.jpg)
![Abolfazl Golshan, Mostafa Rezazadeh Shirdar & S.Izman
International Journal of Experimental Algorithms (IJEA), Volume (2) : Issue (2) : 2011 67
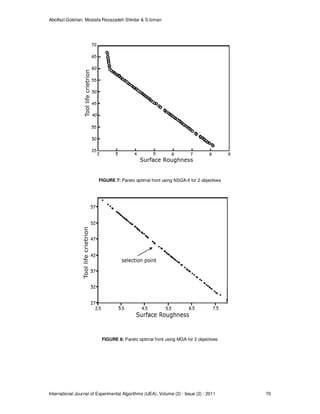
4. OPTIMIZATION
To optimize cutting parameters in the machining of St-38 steel two methods of optimization includes
Non-dominated Sorting Genetic Algorithm (NSGA-II) and micro genetic algorithm (MGA) was used.
The objectives set for both methods in the present study were as follows:
1. Minimization of tool life criteria (A)
2. Minimization of average surface roughness (Ra)
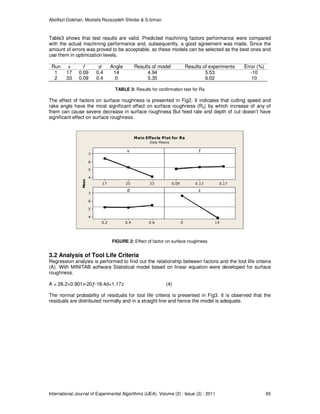
5. NSGA-II ALGORITHM
The non-dominate sorting Genetic Algorithm (NSGA-II) which was introduced by Deb [12]. It is a
powerful general purpose optimization tool to solve optimizing problems in mathematics and
engineering. NSGA-II deals with a possible solution regarding a population and therefore, it can have
some applications in problems of multi-objective optimizations. It leads to have a number of
simultaneous solutions. Despite, this algorithm is fast, but it has been as a controversial method and
has been opposed due to have some difficulty and complexity when it comes to computational
approach. The elitism is also disregarded in this method. The selection operator differs from simple
genetic algorithm (SGA). Crowded comparison is the operator in which selections can be achieved
considering ranking and crowding distance. The solution of initially parent population is checked with
other solutions and eventually, solution is put into consideration to make aware of its validation using
rules given below [7]:
][1.][1. jObjiObj f and ][2.][[2. jObjiObj ≥ , (5)
Or
][1.][1. jObjiObj ≥ and jijObjiObj ≠],[2.][2. f (6)
Where, chromosome numbers can be shown as i and j, respectively. Subsequently, it can be
noticeable that the selected solution is validated by rules introduce. It makes it be marked as
dominated. If the rule doesn’t satisfy, it will be marked as non-dominated. In order to the solutions, the
corresponding process must continues until all solution selected are ranked. Fitness which is as equal
as its non-dominated level assigns to each solution. There is no result to demonstrate none of the
solutions is better compared with other solutions. Solutions are considered as part of a special rank or
non-dominated level. The crowding distance is considered to be as an average distance between two
points on both sides of selected solution point along each objectives function. Each objective
function’s boundary solution with largest and smallest values is assigned an infinity value. The
algorithm flowchart is illustrated in Fig5. For solving optimization problem using GA, fitness value is
required. it connects the objective with decision variable. In the present investigation objective are
minimization of average surface roughness (Ra) and minimization of tool life criteria which are function
of decision variables namely, cutting speed, feed rate, depth of cut and rake angle.](https://image.slidesharecdn.com/ijea-20-160305100747/85/A-Comparison-of-Optimization-Methods-in-Cutting-Parameters-Using-Non-dominated-Sorting-Genetic-Algorithm-NSGA-II-and-Micro-Genetic-Algorithm-MGA-6-320.jpg)
![Abolfazl Golshan, Mostafa Rezazadeh Shirdar & S.Izman
International Journal of Experimental Algorithms (IJEA), Volume (2) : Issue (2) : 2011 68
FIGURE 5: Flow chart for the NSGA-II algorithm [7]
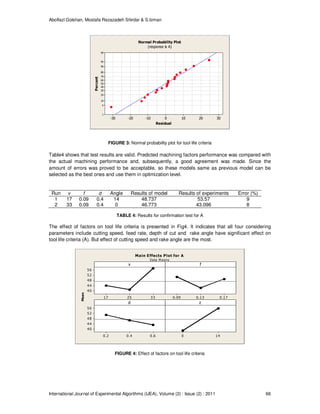
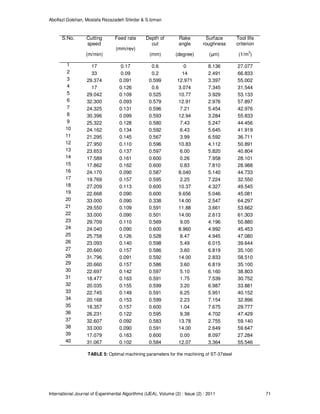
6. MICRO GENETIC ALGORITHM (MGA)
MGA operates on a population, of designs similar to the simple genetic algorithm (SGA). However,
unlike the SGA, the mechanics of the MGA allow for a very small population size, npop. The MGA can
be outlined in the following way:
1. A micro-population of five designs is generated randomly.
2. The fitness of each design is determined and the fittest individual is carried to the next generation
(elitist strategy).
3. The parents of the remaining four individuals are determined using a tournament selection strategy.
In this strategy, designs are paired randomly and adjacent pairs compete to become parents of the
remaining four individuals in the following generation [13]
4. Convergence of the µ-population is checked. If the population is converged, go to step 1, keeping
the best individual and generating the other four randomly. If the population has not converged, go to
step 2.
Note that mutations are not applied in the MGA since enough diversity is introduced after
convergence of a micro-population. In addition, [13] and [14] have shown that MGAs reach the
optimum in fewer function evaluations compared to an SGA for their test functions. The flow chart of
the above algorithm is shown in Fig6.
Initialize
population P of
Generation = 1
Calculate fitness value
Sorting based on crowded-
comparison Operator
Selection, Crossover and mutation to
create offspring population Q of size N
Combine population R=P+Q, of size 2N
Chose population P of size N
based on crowed-comparison
operator
If generation
>Max. Gen
Stop](https://image.slidesharecdn.com/ijea-20-160305100747/85/A-Comparison-of-Optimization-Methods-in-Cutting-Parameters-Using-Non-dominated-Sorting-Genetic-Algorithm-NSGA-II-and-Micro-Genetic-Algorithm-MGA-7-320.jpg)
![Abolfazl Golshan, Mostafa Rezazadeh Shirdar & S.Izman
International Journal of Experimental Algorithms (IJEA), Volume (2) : Issue (2) : 2011 72
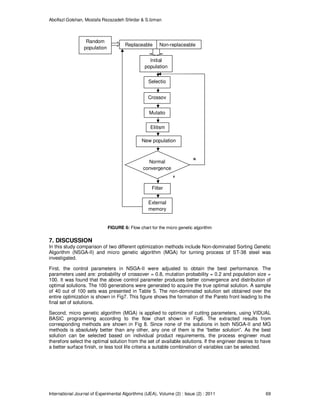
For comparison of the two optimization methods, the experimental results for 2 points are shown in
the table 6. Considering the experimental results shown in the Table 2, the parameters of trial number
10 resulted to surface roughness of 5.53 (µm) and tool life criteria of 53.57 (1/m3). After optimizing
machining parameters through NSGA-II and micro genetic algorithm, considering NSGAII the value of
surface roughness and tool life criteria decrease to 5.102 (µm) and 44.600 (1/m3 ) respectively.
However, regarding to micro genetic algorithm these mentioned values decrease to 5.102 (µm) and
44.723 (1/m3), respectively. Thus, considering the data given, as feed rate is kept constant, by
changing cutting speed, depth of cut and rake angle, it can be observed that lower surface roughness
and tool life criteria can be achieved which both are more desirable. It is noticed that results in two
mentioned algorithms better results were achieved with use of NSGA-II. The reason why use of
NSGA-II is better is that despite both algorithms lead in same values for surface roughness, but for
tool life criteria values of 44.60 and 44.723 (1/m3) were attributed to NSGA-II and micro genetic
algorithm, respectively, demonstrating superiority of NSGA-II over micro genetic algorithm.
Cutting
speed
(m/min)
Feed rate
(mm/rev)
Depth of
cut
(mm)
Rake angle
(degree)
Surface
roughness
(µm)
Tool life
criteria
1/m3
Experimental
result(Table 2,
trial no.10)
17 0.09 0.40 14 5.53 53.57
NSGA-II 17.40 0.09 0.60 13.30 5.102 44.600
MGA 17.62 0.09 0.60 13.12 5.102 44.723
TABLE 6: Example of optimized values derived from NSGA-II and MGA
8. CONCLUSION
The experiments were conducted on a lathe machine for the machining of ST-37 steel. The tool used
for the machining operation is a HSS tool. The responses studied average surface roughness and tool
life criteria. The first-order polynomial models were developed for tool life criteria and average surface
roughness, and were used for optimization. In this study two multi-objective evolutionary algorithms
based on efficient methodology, NSGA-II and MGA was utilized to optimize machining parameters in
the machining of ST-37steel. The emphasis must be put on providing a preferred solution for the
process engineer in the short period of the time. The choice of one solution over other ones is
dependent on the requirements of process engineer [15]. In conclusion, by comparison of micro
genetic algorithm and NSGA-II it was noticed that in spite of the fact, both algorithms have good
results in optimization issues, but it was shown that NSGA-II had slightly superiority over micro
genetic algorithm whereas NAGA-II results were more satisfactory than micro genetic algorithm in
terms of optimizing machining.
9. REFERENCE
[1] Dereli, D., Filiz, I.H., Bayakosoglu, A., Optimizing cutting parameters in process planning of
prismatic parts by using genetic algorithms. International Journal of Production Research 39
(15), 3303–3328, 2001
[2] Pandey PPC, Pal S. In: Proceedings of the Third International Conference in Computer
Integrated Machining Singapore, vol. 1, pp. 812–9, 1995
[3] Hsu VN, Daskin M, Jones PC, Lowe TJ. Tool selection for optimal part production: a Lagrangian
relaxation approach. IIE Trans; 27:417–26, 1995.
[4] N. Srinivas and D. Kalyanmoy, Jl. Evol. Comput. 2, 221, 1994.](https://image.slidesharecdn.com/ijea-20-160305100747/85/A-Comparison-of-Optimization-Methods-in-Cutting-Parameters-Using-Non-dominated-Sorting-Genetic-Algorithm-NSGA-II-and-Micro-Genetic-Algorithm-MGA-11-320.jpg)
![Abolfazl Golshan, Mostafa Rezazadeh Shirdar & S.Izman
International Journal of Experimental Algorithms (IJEA), Volume (2) : Issue (2) : 2011 73
[5] D. Kanagarajan, R. Karthikeyan, K. Palanikumar, J. P. Davim, Int. J. Adv. Manuf Tech. 36, 1124,
2008.
[6] M.Rozenek.M,J.Kozak,L.Dabrovwki,K.Lubkovwki, Electrical discharge machining characteristics
of metal matrix composites,J.Mater.Process.Technol.109, pp.367-370, 2001.
[7] N.Tosun, C.Cogun , H.Pihtili , "The effect of cutting parameters on wire crater sizes in WEDM",
int. J . Adv. Manuf. Techonl., Vol. 21, pp. 857-865, 2003.
[8] N.Tosun,C.Cogun, An investigation on wire wear in WEDM, j.Mater.Process.Technol.1349 (3) ,
pp. 273-278, 2003.
[9] Wang K., Gelgele H.L., Wang Y., Yuan Q., Fang M., "A hybrid intelligent method for modelling the
EDM process", Int. J. Machine Tools Manuf. Vol.43,pp.995–999,2003
[10] Su J.C. , Kao J.Y., Tarng Y.S. , "Optimization of the electrical discharge machining process
using a GA-based neural network", Int. J. Adv. Manuf. Technol. Vol.24,pp.81–90,2004
[11] M. Sivakumar and S. M. Kannan, Int. J. Adv. Manuf Tech. 32, 591, 2007.
[12] Debabrata Mandal., Modeling of electrical discharge machining process using back propagation
neural network and multi-objective optimization using non-dominating sorting genetic algorithm-
II, Journal of Materials Processing Technology 186, pp.154–162, 2007.
[13] Krishnakumar, K., “Micro-Genetic Algorithms for Stationary and Non-Stationary Function
Optimization,” SPIE 1196, Intelligent Control and Adaptive Systems, 1989.
[14] Senecal P. K., “Development of a Methodology for Internal Combustion Engine Design Using
Multi-Dimensional Modeling with Validation Through Experiments,” Ph.D. Dissertation,
University of Wisconsin-Madison, 2000.
[15] K. Palanikumar, B. Latha , V.S.Senthilkumar ,R.Karthikeyan, Multiple Performance Optimization
in Machining of GFRP Composites by a PCD Tool using Non-dominated Sorting Genetic
Algorithm (NSGA-II),Met. Mater. Int.,Vol.15, No. 2, pp. 249-258, 2009.](https://image.slidesharecdn.com/ijea-20-160305100747/85/A-Comparison-of-Optimization-Methods-in-Cutting-Parameters-Using-Non-dominated-Sorting-Genetic-Algorithm-NSGA-II-and-Micro-Genetic-Algorithm-MGA-12-320.jpg)