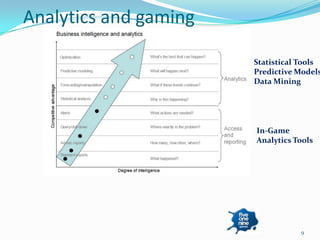
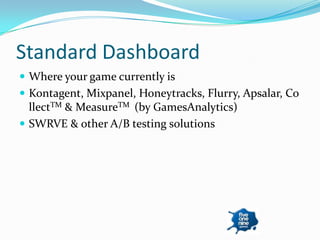
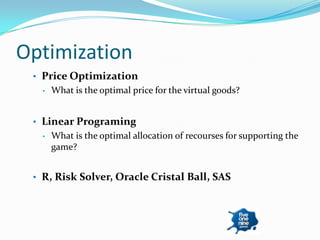
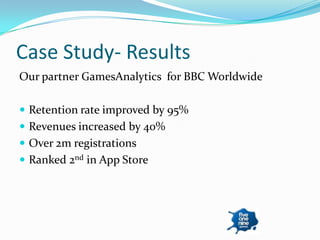
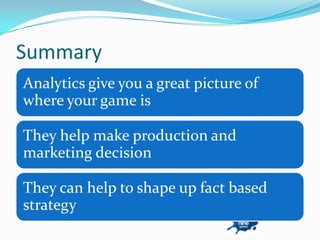
28 September 2012
Agenda
Background

Current state of analytics
Analytics 2.0

Summary
Lloyd Melnick
fiveonenine games
Publishing and Developing
 Launched publishing
 program in August

Campaign Story launched &
Several projects in the pipeline
More stars than the Miami Heat
 Ex-Studio Head of EA’s       Gardens of Time
    North Carolina office      Shutter Island
   Member founding            City of Wonder
    management team at         Mortimer Beckett
    Motricity and Appia
                               Big City Adventure
   Team lead at RIM’s NC
    studio                     Madden 3DS
   20 year veteran of         Nascar Kart Racing Wii
    IBM/Microsoft/Citrix       Woodland Heroes
   GM Europe and LATAM
    at Disney/Playdom
Analytics and gaming

                       Statistical Tools
                       Predictive Models
                       Data Mining


                       In-Game
                       Analytics Tools


                                  9
Standard Dashboard
 Where your game currently is
 Kontagent, Mixpanel, Honeytracks, Flurry, Apsalar, Co
  llectTM & MeasureTM (by GamesAnalytics)
 SWRVE & other A/B testing solutions
Ad hoc reports
 Addresses immediate concerns and issues
 Kontagent, Mixpanel, Honeytracks
Query/drill down
 Where exactly is the problem?
 Kontagent, Mixpanel, Honeytracks, CollectTM &
 MeasureTM (by GamesAnalytics)
Alerts
 What actions are needed
STATISTICAL Analysis
     Correlations & CHI SQ
    Are there statistically significant associations among factors
   T-tests & ANOVA
    Are there statistically significant differences among groups in
    usage or monetization
   Regression Analysis
    What are the factors (i.e.: gender, age) “significantly” impact
    revenue and by how much?
   Outlier Analysis
    Are there users playing or monetizing far differently than the
  most?
   Excel, R, SAS, SPSS, STATA, SWRVE, PredictTM

                                                                      15
Forecasting
 • Time Series Analysis
  •   How much revenue will we bring in next quarter?
  •   How many users will we have in the future (near term)?
  •   What will the load on the servers be?


 • Excel, R, SAS, SPSS, STATA


                                                               16
Predictive Modeling
  Logistic Regressions, Decision Trees, etc.
  •   Who is more likely to monetize?
  •   Who is more likely to react to in game messaging?
  Survival Analysis
  •   What will be the lifetime of a user?
  •   How long will it take for users to monetize? (time to first
      purchase)
  •   What factors impact the retention of the users
  R, SAS, SPSS, STATA, PredictTM


                                                                    17
Data mining
 • Clustering (Segmentation) Analysis
  •   Are there clear “segments” among our users that could be
      approached differently?


 • Association Analysis
  •   Are there items that sell “together”?


 • SAS Enterprise Miner, SPSS
  Modeler, Weka, Playnomics, HoneyLizer, PredictTM


                                                                 18
Simulation
 • Monte–Carlo Simulation
  •   How long does our game take on average?
  •   How many turns on average will the players need to finish?
  •   What happens if we tweak the rules of the game?


 • Excel, R, Risk Solver, SAS, SPSS, STATA
Optimization
 • Price Optimization
   •   What is the optimal price for the virtual goods?


 • Linear Programing
   •   What is the optimal allocation of recourses for supporting the
       game?


 • R, Risk Solver, Oracle Cristal Ball, SAS
Analytics design – most important
metric
           CUSTOMER
            LIFETIME
             VALUE


                                    21
Case Study- Results
Our partner GamesAnalytics for BBC Worldwide

 Retention rate improved by 95%
 Revenues increased by 40%
 Over 2m registrations
 Ranked 2nd in App Store
Summary
Analytics give you a great picture of
where your game is

They help make production and
marketing decision

They can help to shape up fact based
strategy
Thank you
Aren Arakelyan
Aren.Arakelyan@fiveoneninegames.com

Lloyd Melnick
Lloyd.melnick@fiveoneninegames.com

http://lloydmelnick.com/

A Case for Predictive Analytics - Aren Arakelyan - Fiveonenine games

  • 1.
  • 2.
    Agenda Background Current state ofanalytics Analytics 2.0 Summary
  • 4.
  • 5.
  • 6.
    Publishing and Developing Launched publishing program in August Campaign Story launched & Several projects in the pipeline
  • 7.
    More stars thanthe Miami Heat  Ex-Studio Head of EA’s  Gardens of Time North Carolina office  Shutter Island  Member founding  City of Wonder management team at  Mortimer Beckett Motricity and Appia  Big City Adventure  Team lead at RIM’s NC studio  Madden 3DS  20 year veteran of  Nascar Kart Racing Wii IBM/Microsoft/Citrix  Woodland Heroes  GM Europe and LATAM at Disney/Playdom
  • 9.
    Analytics and gaming Statistical Tools Predictive Models Data Mining In-Game Analytics Tools 9
  • 10.
    Standard Dashboard  Whereyour game currently is  Kontagent, Mixpanel, Honeytracks, Flurry, Apsalar, Co llectTM & MeasureTM (by GamesAnalytics)  SWRVE & other A/B testing solutions
  • 11.
    Ad hoc reports Addresses immediate concerns and issues  Kontagent, Mixpanel, Honeytracks
  • 12.
    Query/drill down  Whereexactly is the problem?  Kontagent, Mixpanel, Honeytracks, CollectTM & MeasureTM (by GamesAnalytics)
  • 13.
  • 15.
    STATISTICAL Analysis  Correlations & CHI SQ Are there statistically significant associations among factors  T-tests & ANOVA Are there statistically significant differences among groups in usage or monetization  Regression Analysis What are the factors (i.e.: gender, age) “significantly” impact revenue and by how much?  Outlier Analysis Are there users playing or monetizing far differently than the most?  Excel, R, SAS, SPSS, STATA, SWRVE, PredictTM 15
  • 16.
    Forecasting • TimeSeries Analysis • How much revenue will we bring in next quarter? • How many users will we have in the future (near term)? • What will the load on the servers be? • Excel, R, SAS, SPSS, STATA 16
  • 17.
    Predictive Modeling Logistic Regressions, Decision Trees, etc. • Who is more likely to monetize? • Who is more likely to react to in game messaging?  Survival Analysis • What will be the lifetime of a user? • How long will it take for users to monetize? (time to first purchase) • What factors impact the retention of the users  R, SAS, SPSS, STATA, PredictTM 17
  • 18.
    Data mining •Clustering (Segmentation) Analysis • Are there clear “segments” among our users that could be approached differently? • Association Analysis • Are there items that sell “together”? • SAS Enterprise Miner, SPSS Modeler, Weka, Playnomics, HoneyLizer, PredictTM 18
  • 19.
    Simulation • Monte–CarloSimulation • How long does our game take on average? • How many turns on average will the players need to finish? • What happens if we tweak the rules of the game? • Excel, R, Risk Solver, SAS, SPSS, STATA
  • 20.
    Optimization • PriceOptimization • What is the optimal price for the virtual goods? • Linear Programing • What is the optimal allocation of recourses for supporting the game? • R, Risk Solver, Oracle Cristal Ball, SAS
  • 21.
    Analytics design –most important metric CUSTOMER LIFETIME VALUE 21
  • 22.
    Case Study- Results Ourpartner GamesAnalytics for BBC Worldwide  Retention rate improved by 95%  Revenues increased by 40%  Over 2m registrations  Ranked 2nd in App Store
  • 24.
    Summary Analytics give youa great picture of where your game is They help make production and marketing decision They can help to shape up fact based strategy
  • 25.
    Thank you Aren Arakelyan Aren.Arakelyan@fiveoneninegames.com LloydMelnick Lloyd.melnick@fiveoneninegames.com http://lloydmelnick.com/

Editor's Notes