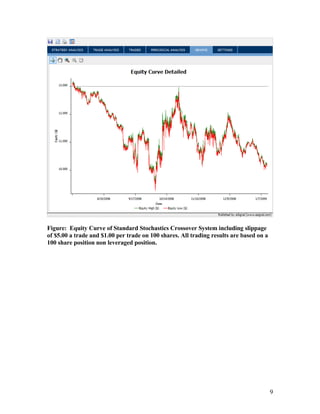
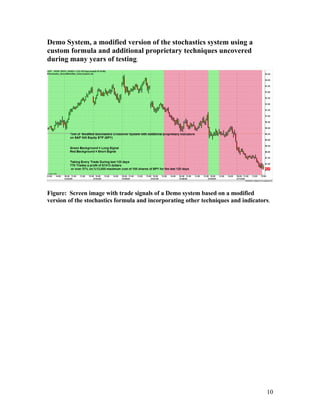
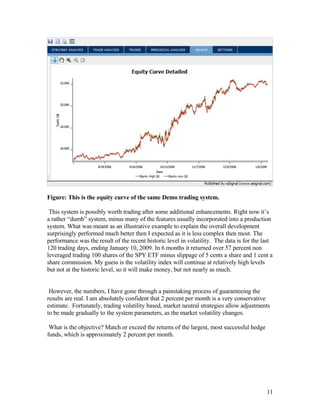
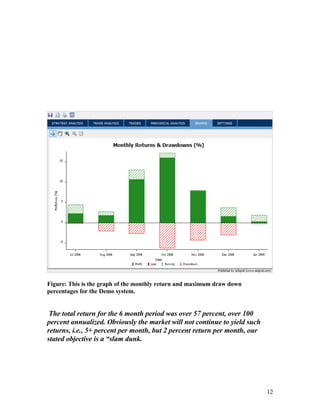
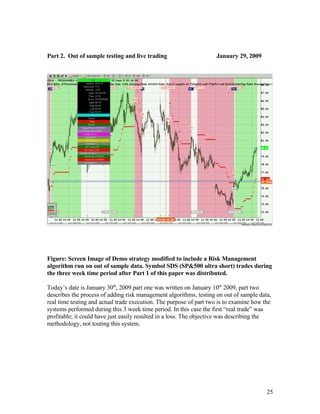
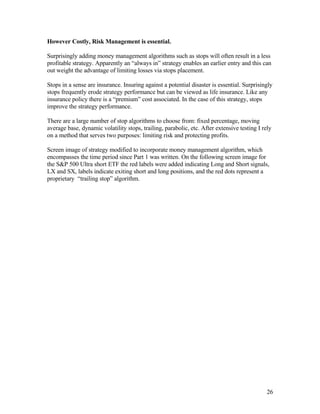
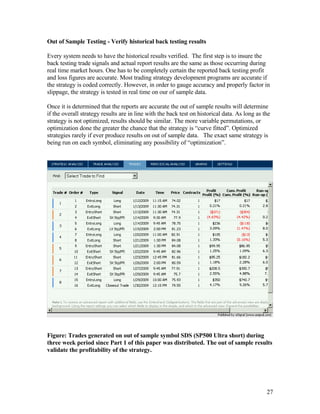
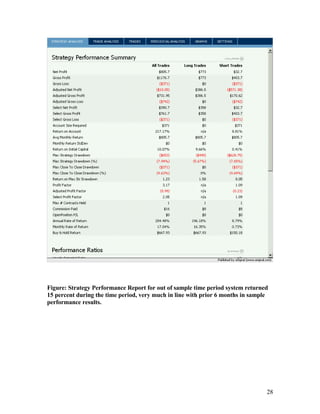
The document discusses technical analysis and quantitative trading strategies. It describes developing automated trading models using technical indicators like stochastic oscillators in unconventional ways to generate consistent monthly returns of 2-5% with minimal drawdowns. Standard stochastic crossover systems are shown to lose money, but modified versions incorporating other techniques have potential. The objective is capturing a portion of the market's daily volatility through indicator-based signals while minimizing losses in sideways markets.
This document provides an investor pitch for a trading tool called "Orbit the Tool" that claims to significantly reduce risk in trading markets using mathematical modeling. It seeks $250,000 in funding to build the tool. The tool uses chaos mathematics to isolate a "singularity" that predicts market movement, guiding traders to the optimal entry and exit points. It argues the tool could gain 100,000 subscribers in the first year at $250/month each, generating $300 million in revenue by automating trading for retail and institutional traders globally across all markets. Competition lacks their proprietary mathematical model and skills. Validation is provided through team experience and a video explaining the tool and underlying mathematics.
The document describes a fitness and cultural exchange program for overweight American and Chinese teens. It is an 8-week program held in Tianjin, China where 40 American and 10 Chinese teens will participate in daily physical activity, sports, weight loss care at a renowned hospital, and cultural activities like visiting the Great Wall and Forbidden City. The program aims to help teens develop healthy habits and lifestyle changes in a new environment to address the obesity epidemic and its health and psychological consequences. Sponsors can select participants and benefits include product placement and media coverage.
The document contains financial data for turnover, profit, return on equity, and equity/assets ratio for an unspecified company. Turnover and profit are measured in millions of Swedish krona, while return on equity and equity/assets ratio are percentages. The document provides key financial metrics but no additional context about the company.
The 10 step document outlines a process for planning an effective presentation: 1) Start with the end goal in mind, 2) Brainstorm ideas, 3) Keep things simple, 4) Organize content logically, 5) Find a pattern to structure the flow, 6) Prepare a storyline with a beginning, middle, and end, 7) Compose an attention-grabbing introduction, 8) Manage timing of sections, 9) Control detail levels, 10) End with a clear call to action.
This document discusses top technology trends in education over the next 1-5 years based on the 2010 Horizon Report. These include mobile computing, open content, electronic books, simple augmented reality, gesture-based computing, and visual data analysis within 1-2 years. It also discusses the growth of K-12 online education and eBooks. Emerging technologies like augmented reality use cameras and sensors for tracking. Gesture-based computing uses touch displays and surfaces. Resources mentioned include virtual worlds for teaching and open educational resources.
Looks at the nature and qualities of information literacy assessment.
Slides for a workshop delivered at LILAC (Librarians' Information Literacy Annual Conference) in Limerick March 29-31 2010. Workshop leaders were scheduled to be Chris Powis (University of Northampton, UK) and Jo Webb (De Montfort University, UK), but session was actually led by Amanda Poulton (Also de Montfort University).
Data logging refers to collecting data over time using sensors. Sensors measure a property and send an analog signal to be converted into digital data by an analog-to-digital converter (ADC) for computer processing. Data logging systems are used for scientific experiments, weather stations, and environmental monitoring to gather data regularly about factors like temperature, rainfall, pollution levels, and more. The sensors take measurements that are converted and sent to a data logger for storage and later transmission to a computer for analysis and presentation.
The document outlines a plan for a partnership between various organizations to host a free soccer clinic and community projects for children in Cleveland's Central Neighborhood, and to provide tickets to two professional soccer games. Tasks and responsibilities are assigned to stakeholders from Lighthouse Inc., the Lonnie Burton Rec Center, Cleveland City Stars, and Heaventrain to advertise, run, and monitor the clinic, cleanup projects, and games over the spring and summer. The goal is to introduce local youth to soccer and community service, while generating positive publicity for all involved organizations.
The document discusses limits and examples of evaluating limits. It covers rewriting functions when the limit is an indeterminate form of 0/0. Examples are provided of evaluating limits by sketching graphs or using left and right evaluations for values close to x. Methods like algebra, graphing, or left/right evaluations are presented for determining limits.
The document discusses various concepts related to pricing, including factors that influence price sensitivity, methods for estimating demand and costs, strategies for setting prices, and approaches for initiating or responding to price changes. It provides examples to illustrate concepts like price discrimination, product mix pricing, and how companies may respond to competitors' price adjustments.
This 6-page document appears to be a multi-page PDF with no title or visible text. As the document contains no readable words or identifiable content, it is not possible to provide a meaningful summary in 3 sentences or less.
This document is a client presentation by Global-i Consulting & Contracting Services that outlines their capabilities and proposed services. It includes an agenda covering introductions, Global-i's capabilities in various solution areas, identifying client needs, proposed services, why choose Global-i, implementation plans, and next steps. The presentation provides information on Global-i's full-lifecycle solutions, industry expertise, services across product development, go-to-market, program management, and more. It also discusses engaging Global-i to help meet the client's requirements in areas like product development, marketing, deployment, and systems integration.
The document is about a school in Parnu, Estonia called Parnu Toimetulekukool that provides education for children with special needs. It is the 5th anniversary of the school. The article was written by Signe Leht.
Research, Development, Test, and Evaluation: A Defensible Process for Federal...Duane Blackburn
Through this "ready reference", MITRE aims to remediate the strain on RDT&E PMs and make it more likely that work necessary to support your agency's mission can continue to be funded. MITRE developed this model after reflecting upon the successes and failures of RDT&E programs from a variety of federal sectors over the past fifteen years.
The Federal Reserve System is a system set up by the federal government to supervise and regulate member banks and help them serve the public efficiently. All national banks must join the FRS, and state banks may join. Banking systems are used to finance many aspects of life like homes, businesses, crops, education, goods, and infrastructure. Commercial banks offer a wide range of financial services like checking and savings accounts, loans, and other services. Electronic funds transfer refers to using computers and technology for banking activities like ATMs, direct deposit, and automatic bill payment.
Legacies Old Media New Media Nahf Conf March 09Graham Richards
The document discusses traditional legacy marketing strategies and how charities can incorporate new media approaches. It emphasizes that both traditional and new media can be used complementarily to appeal to wider audiences. Some new media opportunities discussed include creating legacy microsites, using videos and social media, providing online memorial pages, publishing obituaries online, and treating all supporters as potential donors. The key message is that charities should make their online presence accessible, interactive, and focused on sharing real stories in order to engage more supporters and get results with legacy marketing.
The document discusses the benefits of exercise for mental health. Regular physical activity can help reduce anxiety and depression and improve mood and cognitive functioning. Exercise causes chemical changes in the brain that may help protect against mental illness and improve symptoms.
The document discusses how the rise of internet-enabled devices and social media has empowered consumers to co-create value with organizations in new ways, shifting control towards consumers and requiring companies to embrace complexity, share control, and co-create value through networked communities. It argues that business leaders must develop "Gen-Net" leadership skills to guide their organizations through this dramatic change in how value is created and work is accomplished.
Este documento habla sobre la vocación cristiana y el llamado de Jesús a seguirlo. Señala que Jesús nos invita a dejar de lado nuestras preocupaciones mundanas para cultivar nuestra vida espiritual y participar en la Iglesia. También nos exhorta a detenernos a revisar nuestro camino y asegurarnos de estar siguiendo a Jesús. Finalmente, pide que confiemos en Jesús como lo hizo Pedro y que respondamos a su llamado para ser sus testigos.
How important are the rules used to create smart beta portfoliosRalph Goldsticker
Most Smart Beta presentations are about: “What and Why?”
This presentation addresses: “Do the rules used to construct a Smart Beta portfolio matter?”
Our approach was to use alternative portfolio construction rules to simulate multiple 25-year return histories for Low Volatility, Fundamental Indexing and Momentum strategies, and then compare their average returns, risks, drawdowns and factor exposures.
The document analyzes the beta and risk characteristics of a portfolio of stocks compared to the S&P 500 market index from 1989 to present. It loads historical price data for the stocks and market, calculates logarithmic monthly returns, and estimates basic statistics. The analysis finds the stocks and market had average monthly returns between 0.16-1.36% with varying levels of volatility as measured by minimum, maximum and interquartile ranges of returns.
The document provides risk disclosures and information about trading systems called Checkmate, Synergy, Fusion, and Interplay from Strategic Trading Systems, Inc. It discusses the high risks of commodity trading and that past performance results are hypothetical. It also summarizes the concepts and logic behind the Checkmate and Synergy trading systems, provides examples of trades from the systems, and evaluates their historical performance based on backtesting results.
an interactive help system to guide you through the software
•
Over 200 standard indicators including MACD, RSI, Stochastics, Bollinger Bands,
and more
•
Ability to create your own custom indicators using MetaStock’s Formula Language
•
Scan thousands of securities based on your criteria with the Explorer
•
Backtest strategies on multiple securities with the System Tester
•
Get insights from expert commentary with the Expert Advisor
•
Real-time data for stocks, ETFs, futures, forex and more
•
Data on Demand for historical data without local storage
•
Automated software
The document provides an analysis of various stocks traded in a portfolio for a stock market simulation game. It includes fundamental analysis of companies selected for the portfolio like Bharti Airtel, Hero MotoCorp, and Dr. Reddy's Labs. It examines ratios like P/E, P/B, and debt-to-equity. Technical analysis indicators discussed include RSI, MACD, momentum, Bollinger bands, and Parabolic SAR. The document also includes details of purchases and sales of stocks in the portfolio.
Building a systematic stock portfolio in only a few hours per yearStockopedia
Ed Page Croft reveals the simple but powerful systematic stock portfolio strategy that has helped him consistently achieve market-beating returns. To access the webinar in full please visit: http://why.stockopedia.com/creating-a-portfolio/
The document summarizes key points from a CFO Summit held on June 6th 2017. It includes an agenda with topics such as cost benchmarks, subscription business models, IT infrastructure costs, and regulatory updates. A presentation on benchmarks and market surveys unveiled subscription revenue multiples between 2005-2017, noting the average has rebounded to 5.5x for high-growth companies. Recent software IPOs were also examined based on metrics like revenue, growth characteristics, and time to positive free cash flow. The document aims to share data and insights to facilitate ongoing collaboration between CFOs.
The BCG matrix is a chart developed by the Boston Consulting Group in 1968 to analyze a company's business units and allocate resources. It categorizes products as cash cows, dogs, question marks or stars based on their relative market share and market growth rate. Cash cows are profitable but mature, dogs have low market share in a mature industry, question marks consume cash but could grow, and stars have high share in a fast-growing market. The matrix aims to help companies decide which units to fund or sell off. It has been criticized for oversimplifying and potentially misguiding resource allocation decisions.
Andrew Palashewsky developed the Advance IQ Capital model beginning in 2011 to create an algorithmic trading strategy based on his decades of experience. The model uses proprietary momentum measurements to determine buy and sell signals across different market conditions. Backtesting of the model on futures, currencies, and ETFs from 2008-2014 shows annual returns ranging from 9.4% to 30% compared to benchmarks. However, past performance is not indicative of future results.
Andrew Palashewsky developed the Advance IQ Capital Model beginning in 2011 to systematically trade futures, currencies, and ETFs using proprietary momentum indicators. Backtesting shows the model achieved strong risk-adjusted returns across various assets during bull and bear markets from 2008-2014, outperforming benchmarks. The model adapts rules based on defined market phases and suppresses signals in choppy conditions to limit losses.
- Most of the auto trading systems posted profits in December, with an average return of over 10%. For the full year, all systems were profitable with an average return of 65%.
- The largest monthly profit was $1,187.50 from the EuroRun EC system trading Euro futures.
- Auto Trading Systems now offers automated forex trading systems in addition to existing futures systems, including a system targeting the EUR/USD pair and a managed forex program.
How well do you know your system? Are your back test results the best estimate of out-of-sample performance you can have? This paper pinpoints a crucial aspect of system development: data mining bias. It demonstrates how a better estimate of out-of-sample performance can be derived with System Parameter Permutation (SSP). http://papers.ssrn.com/sol3/papers.cfm?abstract_id=2423187
The document discusses different approaches to investing, including passive vs active investing, fundamental vs technical analysis, and top-down vs bottom-up strategies. It provides beliefs, methods, advantages and disadvantages for each approach. The key points are that a top-down, technically-focused approach analyzing broad market and sector trends first may provide an edge over focusing solely on individual companies. The "Tortoise strategy" described uses ETFs in a weekly top-down analysis of global markets to identify relatively strong performing regions.
JPX Working Paper Vol.9 【Summary】
Impacts of Speedup of Market System on Price Formations using Artificial Market Simulations
http://www.jpx.co.jp/corporate/news-releases/0010/20150331-02.html
Stochastics, Volume Rate of Change, Relative Strength to Index, Bid/Ask Volume ratio, Floor Trader Pivots and Institutional buying/selling are 6 of our most useful indicators for running the ITRS algorithms to identify risk and growth factors related to index trend reversals. We use a total of 33 indicators that each generate a critical factor.
This document summarizes a panel discussion on liquid alternative investments, alpha-beta strategies, risk management, and due diligence from Peru's 2013 Capital Markets Day. The key points are:
1) Many sources of claimed hedge fund "alpha" have become commoditized and are better described as alternative beta that can be replicated inexpensively.
2) The panelist's firm, 1OAK, can strip liquid alternative investments into beta exposures and alpha sources, reducing fees for investors.
3) The returns of the hedge fund industry can be closely replicated with a simple four-factor model consisting of stocks, currencies, rates, and cash. This illustrates that "alternative beta" is easy to access at
StatPro Revolution brochure - Summer 2012StatPro Group
StatPro Revolution is a cloud-based portfolio analytics service that will transform the way you communicate with your clients. It will reduce your operating costs, enhance your productivity, and fuel a critical understanding of portfolio performance with accurate, up to date performance analytics.
The document is a summer training report on equity analysis of infrastructure firms. It includes an analysis of 5 infrastructure companies - GMR, DLF, Unitech, Reliance Industrial Infrastructure and Jaiprakash Associates. The analysis includes both fundamental analysis using techniques like discounted cash flow valuation and technical analysis using tools like MACD, RSI and moving averages. The report also includes projections of the cash flows and intrinsic valuation of DLF using a discounted cash flow model.
Learn key ideas for designing a profitable automated trading system for futures, stocks, or forex. Make money trading bonds, oil, gold, and the euro while away from the trading screen. Courses available as well as trading signals for lease.
Revolutionizing Surface Protection Xlcoatings Nano Based SolutionsExcel coatings
Excelcoating Transforming surface protection with their cutting-edge, eco-friendly nano-based coatings. This presentation delves into their innovative product lineup, including Excel CoolCoat for roof cooling, Excel NanoSeal for cement surfaces, Excel StayCool for UV-filtering glass, Excel StayClean for solar panels, Excel CoolTile for heat-reflective tiles, and Excel InsulX for film insulation.
SATTA MATKA DPBOSS KALYAN MATKA RESULTS KALYAN MATKA MATKA RESULT KALYAN MATKA TIPS SATTA MATKA MATKA COM MATKA PANA JODI TODAY BATTA SATKA MATKA PATTI JODI NUMBER MATKA RESULTS MATKA CHART MATKA JODI SATTA COM INDIA SATTA MATKA MATKA TIPS MATKA WAPKA ALL MATKA RESULT LIVE ONLINE MATKA RESULT KALYAN MATKA RESULT DPBOSS MATKA 143 MAIN MATKA KALYAN MATKA RESULTS KALYAN CHART KALYAN CHART
SATTA MATKA DPBOSS KALYAN MATKA RESULTS KALYAN CHART KALYAN MATKA MATKA RESULT KALYAN MATKA TIPS SATTA MATKA MATKA COM MATKA PANA JODI TODAY BATTA SATKA MATKA PATTI JODI NUMBER MATKA RESULTS MATKA CHART MATKA JODI SATTA COM INDIA SATTA MATKA MATKA TIPS MATKA WAPKA ALL MATKA RESULT LIVE ONLINE MATKA RESULT KALYAN MATKA RESULT DPBOSS MATKA 143 MAIN MATKA KALYAN MATKA RESULTS KALYAN CHART
The Enigmatic Gemini: Unveiling the Dual Personalitiesmy Pandit
Explore the fascinating world of the Gemini Zodiac Sign, where duality reigns supreme. Discover the personality traits, important dates, and horoscope insights that define the ever-curious and communicative Gemini.
Dpboss Satta Matta Matka Kalyan Chart Indian MatkaDpboss Matka
dpboss,Sattamatka,satta,matka,satta matka,kalyan weekly chart.kalyan chart. Kalyan jodi chart.kalyan penal chart.kalyan today.kalyan open.fix satta, fix fix fix Satta matka nambar,Sattamatka Win Provide The Best strategy to win a lot of money and Get Best Satta Matka Tips On Every Market & Fix Fix Fix Satta Namber, Satta Matka, Kalyan Matka, Matka Guessing, Satta Matka Result, and Matka Bazar. Satta Bazar, Matka Game, Kalyan Panel Chart, Sattaking143 Number Weekly Jodi, Matka Guessing Final Ank Open Close. Fix Fix FixSatta Nambar prabhat satta. Kalyan panel chart 2020–2010 Kalyan Night Chart, Indian Satta King Satta. Matka Result, Fix Matka, Satta Market, Matka Market, Matka, sattamatka, main ratan panel chart, mumbai panel chart. Milan panel chart, Matka one, simple matka guessing, param matka guessing trick 143 surya alex, satta, Dpboss, sattamatka, boss matka, matka boss,Satta Boss Tara Matka, Rajdhani Night Chart, and Golden Dubai Matka.Sattamatka Madhur Satta, Fastest Matka Satka Batta. Matka 420 Matka Boss, Kalyan Wapka Mobi Site 100 Tricks,Kalyan Night Panel Chart. Milan night panel chart, time bazar khiladi 420. Sona matka 111 420, boss 440, matka india net, weekly Indian Satta fix ank otg. Satta Matka Cool Tag- matka result, matka guessing, satta matta matka 143, dpboss, matka guessing fix Jodi, matka guessing 143, matka guessing dpboss, kalyan chart, Fix fix 3 ank today, Fix fix 3 ank 143, kalyan chart, kalyan final, kalyan open fix pana, fix fix 3 ank 4 ank, fix fix 3 ank time bazar, kalyan chart fix open to close Fix fix 3 ank kalyan, Fix fix 3 ank chart, fix fix fix open, 100 fix ank, , kalyan fix open 143, kalyan fix open guessing, kalyan open, kalyan 100 fix open today,
Cover Story - China's Investment Leader - Dr. Alyce SUmsthrill
In World Expo 2010 Shanghai – the most visited Expo in the World History
https://www.britannica.com/event/Expo-Shanghai-2010
China’s official organizer of the Expo, CCPIT (China Council for the Promotion of International Trade https://en.ccpit.org/) has chosen Dr. Alyce Su as the Cover Person with Cover Story, in the Expo’s official magazine distributed throughout the Expo, showcasing China’s New Generation of Leaders to the World.
SATTA MATKA DPBOSS KALYAN MATKA RESULTS KALYAN CHART KALYAN MATKA MATKA RESULT KALYAN MATKA TIPS SATTA MATKA MATKA COM MATKA PANA JODI TODAY BATTA SATKA MATKA PATTI JODI NUMBER MATKA RESULTS MATKA CHART MATKA JODI SATTA COM INDIA SATTA MATKA MATKA TIPS MATKA WAPKA ALL MATKA RESULT LIVE ONLINE MATKA RESULT KALYAN MATKA RESULT DPBOSS MATKA 143 MAIN MATKA KALYAN MATKA RESULTS KALYAN CHART
Enhancing Adoption of AI in Agri-food: IntroductionCor Verdouw
Introduction to the Panel on: Pathways and Challenges: AI-Driven Technology in Agri-Food, AI4Food, University of Guelph
“Enhancing Adoption of AI in Agri-food: a Path Forward”, 18 June 2024
SATTA MATKA DPBOSS KALYAN MATKA RESULTS KALYAN CHART KALYAN MATKA MATKA RESULT KALYAN MATKA TIPS SATTA MATKA MATKA COM MATKA PANA JODI TODAY BATTA SATKA MATKA PATTI JODI NUMBER MATKA RESULTS MATKA CHART MATKA JODI SATTA COM INDIA SATTA MATKA MATKA TIPS MATKA WAPKA ALL MATKA RESULT LIVE ONLINE MATKA RESULT KALYAN MATKA RESULT DPBOSS MATKA 143 MAIN MATKA KALYAN MATKA RESULTS KALYAN CHART INDIA MATKA KALYAN SATTA MATKA 420 INDIAN MATKA SATTA KING MATKA FIX JODI FIX FIX FIX SATTA NAMBAR MATKA INDIA SATTA BATTA
SATTA MATKA DPBOSS KALYAN MATKA RESULTS KALYAN CHART KALYAN MATKA MATKA RESULT KALYAN MATKA TIPS SATTA MATKA MATKA COM MATKA PANA JODI TODAY BATTA SATKA MATKA PATTI JODI NUMBER MATKA RESULTS MATKA CHART MATKA JODI SATTA COM INDIA SATTA MATKA MATKA TIPS MATKA WAPKA ALL MATKA RESULT LIVE ONLINE MATKA RESULT KALYAN MATKA RESULT DPBOSS MATKA 143 MAIN MATKA KALYAN MATKA RESULTS KALYAN CHART
NewBase 20 June 2024 Energy News issue - 1731 by Khaled Al Awadi_compressed.pdfKhaled Al Awadi
Greetings,
Hawk Energy is pleased to present you with the latest energy news
NewBase 20 June 2024 Energy News issue - 1731 by Khaled Al Awadi
Regards.
Founder & S.Editor - NewBase Energy
Khaled M Al Awadi, Energy Consultant
MS & BS Mechanical Engineering (HON), USAGreetings,
Hawk Energy is pleased to present you with the latest energy news
NewBase 20 June 2024 Energy News issue - 1731 by Khaled Al Awadi
Regards.
Founder & S.Editor - NewBase Energy
Khaled M Al Awadi, Energy Consultant
MS & BS Mechanical Engineering (HON), USAGreetings,
Hawk Energy is pleased to present you with the latest energy news
NewBase 20 June 2024 Energy News issue - 1731 by Khaled Al Awadi
Regards.
Founder & S.Editor - NewBase Energy
Khaled M Al Awadi, Energy Consultant
MS & BS Mechanical Engineering (HON), USAGreetings,
Hawk Energy is pleased to present you with the latest energy news
NewBase 20 June 2024 Energy News issue - 1731 by Khaled Al Awadi
Regards.
Founder & S.Editor - NewBase Energy
Khaled M Al Awadi, Energy Consultant
MS & BS Mechanical Engineering (HON), USAGreetings,
Hawk Energy is pleased to present you with the latest energy news
NewBase 20 June 2024 Energy News issue - 1731 by Khaled Al Awadi
Regards.
Founder & S.Editor - NewBase Energy
Khaled M Al Awadi, Energy Consultant
MS & BS Mechanical Engineering (HON), USAGreetings,
Hawk Energy is pleased to present you with the latest energy news
NewBase 20 June 2024 Energy News issue - 1731 by Khaled Al Awadi
Regards.
Founder & S.Editor - NewBase Energy
Khaled M Al Awadi, Energy Consultant
MS & BS Mechanical Engineering (HON), USA
Sustainable Logistics for Cost Reduction_ IPLTech Electric's Eco-Friendly Tra...
Strategy Part 1,2 & 3
1. Technical Analysis: “Price Based Quantitative Analysis”
Generating consistent returns of 2-5 percent per month with minimal
draw downs, utilizing quantitative, priced based, automated “black
box” trading models.
Glen M. Demarco - January 10, 2009
Technical vs. Fundamental: Does technical analysis “work” or is it a
“self fulfilling prophesy”?
System Trading Results.
This document is not an offer to sell, lease or otherwise market this Benchmark system or
any system.
* Note: All Sharpe Ratios are monthly figures, to convert to annual ratios multiple by 12.
Monthl Max Sortin Select
Symbol Description y Annual Draw Sharpe o Profit
Rtn % Rtn % Down % Ratio Ratio Factor
SDS ULTRASHORT S&P500 21 262 25 0.53 8.50 1.80
SKF ULTSH FINANCIALS 32 388 0 0.48 2.50 1.70
SRS ULTSH REAL ESTATE 41 499 26 0.66 11.90 1.80
POTASH CORP SASK
POT INC 23 281 55 0.49 7.50 1.40
DIREXION LG CP BEAR
BGZ 3X 45 541 41 0.71 94.70 1.70
GOOG GOOGLE INC 6 78 22 0.15 1.60 -0.90
FSLR FIRST SOLAR INC 11 133 16 0.62 6.90 1.70
SMN ULTSH BASIC MATRLS 6 74 16 0.16 0.70 1.00
CME CME GROUP INC 25 307 38 0.61 2.80 2.10
MZZ ULTRASHORT MDCP400 27 325 46 0.33 3.10 1.10
EEV ULT SHRT MSCI EMRG 94 1130 38 0.57 45.30 2.49
Figure: Monthly and annual return during last 120 trading days for Demo system,
obviously a once in a lifetime performance, or is it?
2. Objective of it all – Profits, but with minimal draw downs.
Primarily profits, as my focus is trading, fully automated trading of price based quantitative
models comprised of commonly used and other customized “technical analysis indicators”.
Superior returns with “Maximum Intraday Draw Down”. In the process answer the
question: Fundamental vs. Technical - Does technical analysis work?
However incomprehensive these results may look, they are 100 percent accurate and will
be demonstrated. More important then the absolute return the results are the minimal draw
downs. Most importantly results are achieved without any optimization at all,
zero curve fitting. Curve fitting is based on altering system variables to “fit” the data.
This system was not altered on any of the tested runs, as it’s impossible to curve fit a
system to ten different instruments without changing the system in the process.
2
3. Introduction – “Technical Analysis” or price based quantitative analysis.
Traditional Quantitative Analysis as applied to finance consists of two branches. The first,
Mathematical typically develops models for pricing complex derivative products. The
second, Statistical, or Statistical Arbitrage (StatArb), develops models to decide what
stocks are relatively cheap or expensive based on book value to Price, Price Earnings,
trailing earnings to price, or other individual equity or sector correlation analysis.
Essentially StatArb is a mean reversion - law of large numbers, based strategy.
Technical Analysis can be viewed as third distinct category of traditional quantitative
analysis, Price Based Quantitative Analysis, perhaps we should call ourselves,” Price
Analysts”. Price, in economic terms, along with supply and demand forms the basic
“fundamental” foundation of all economic theory.
Like any powerful tool, technical analysis is only as good as the person utilizing it. For
example, a rifle in the wrong hands can and has caused many tragedies. The record for a
sniper kill was recently made in Afghanistan by an American led sniper team. They killed a
terrorist from a distance of 2,430 meters, over 1 ½ miles away.
So like the combination of a skilled sniper and rifle, with the appropriate skill and
knowledge, price based quantitative technical indicators are enormously profitable, as
3
4. measured by monthly and annual returns, maximum drawdown and Sharpe and Sortino
Ratios.
The main objective of trading is profits. I am told there are many successful very short term
scalp/day traders who are consistently profitable. Because of the changing market
characteristics, this method presents significant challenges. Even if successful, one is
limited to the number of markets that can be traded on any given day and more importantly
limited in the amount of capital that can be traded, i.e., few institutional managers are
willing to commit capital to an individual traders “streak”, however hot.
Given the fee management and incentive fee structure and the amount of capital raised by
hedge funds, my objective is to duplicate the results of the most successful hedge funds.
Results vary, but given today’s interest rates and recent 33% equity market decline,
consistently returning on average 1-2 percent per month non-leveraged will match or
outperform the vast majority of successful funds and is the minimum level of success.
Is it possible? Any given day on average the S&P will be up or down 1%. There are 240 or
so trading days a year that is a potential profit of over 200 percent. Of course it’s
impossible to predict intra day tops and bottoms. To paraphrase something I heard George
Soros say once in an interview, I’m not looking to catch the high and low, just take a little
out of the middle. My goal is to capture at least 10 percent of that 240 percent middle. It
has taken me 20 years to figure out, but as far as I’m concerned it’s a done deal.
How? Well to use an oversimplified example, it could be as simple as: if the S&P during
the first hour of trading is positive the probability that it will continue higher and close out
the day up is greater then a reversal. My systems do not look to predict or project price at
any time in the future. Rather if X (a bullish indication), Y (another bullish indication) and
Z (a third bullish indication) occur, a long trade is taken. Hopefully looking to capture
perhaps .5 to 1 percent profit. This indicator based trade taken 5 times a week and being
correct 60 percent of the time yields the stated objective 2 plus percent a month.
This is overall objective and given the favorable volatility these days it is achievable.
We have all heard of the large number of hedge funds that have failed recently. Unless they
were long only funds, one really has to wonder and it is most unfortunate they stayed long
and watched stocks drop 40% and commodity related stocks, like Steel, Oil Services, etc
loose 70+ percent of their value. I realize fundamentals determine price, but technical
analysis also has value, simply consulting a daily chart would have provided warning
something had changed, dramatically, regardless of one’s opinion. Frankly I gave up
having any opinion regarding long and short bias, way to expensive for me. Frequently
people ask which is superior: technical or fundamental analysis. It’s been a long time but
my economics 101 professor at NYU taught that price in a free market is the direct result of
supply and demand forces and therefore the most “fundamental” of principles. Price charts
form the basis of any technical study, sounds fundamental to me. I also always wondered
where a fundamental trader exits a loosing trade, at zero, after accumulating stock on the
way down? I focus my effort on following what the market is doing rather then trying to
predict what it may do in the future.
4
5. Simply taking an unbiased look at a daily chart to determine what side of these markets to
be on would have not only have kept many in business, but they would have been able to
capitalize on a one way move down. Potash, US Steel, OIH – Oil Services ETF, in a 6
month period lost 75% of their value. Having a fundamental “opinion” on the market that
contradicts what the price is doing is simply ignoring facts.
Underlying Trading System Principles
Minimize Losses – All the systems are based on trend and volatility. They are designed to
be on the right side of any major move. The worse case scenario is an unusually range
bound or “sideways” market where small losses will occur. During periods of low market
activity trading in that particular instrument, parameters can be adjusted, or trade size can
be reduced until volatility returns to normal, or trading can be curtailed. There is no
requirement for every system to be “always in”. The lower the Maximum Drawdown
(amount of pain) the better, that is my primary selection criteria for “best system”. I prefer
a system that makes less net profit but has a lower drawdown, it’s more reliable.
Market neutrality – Given that nobody can predict future direction, having a market
opinion is dangerous. There is no bullish or bearish bias in any of the systems I have
developed.
Volatility Based – Unlike price, volatility changes slowly over weeks to months. The Dow
did not move from an average range of under 100 points in 2006 to 300 points today
overnight and will not move back to 100 in one or two days. More recently the Dow
volatility went from an average range of 155 points a day on May 30, 2008 and moved
steadily higher to peak at 570 points a day on October 16, 2008, almost 5 months.
Trading system parameters can be adjusted with changing market conditions. This does not
involve “optimization” of system variables, which is prone to “curve fitting” but rather a
minor adjustment of the time intervals used, i.e., the lower the volatility the longer the time
frame used. For example a 5 minute interval on the SP500 ETF is less likely yield the
same positive returns as a 5 minute interval on Google.
5
6. Trading System Background
For twenty years part time and ten years full time I have been searching not for the “holy
grail” of trading as this doesn’t exist but systems that simply make a consistent profit with
minimal draw downs. Typically my sample market data model will be a broad based index.
I first began using Computrac the first technical analysis software capable of “back
testing” trading strategies. I then started using Tradestation and for the past several years
eSignal. There are advantages and disadvantages to both. eSignal requires proficient
programming skills but can interface with many brokers for automated execution.
Trading system creation using various sources
Trading publication – Technical Analysis of Stocks and Commodities, Trader Magazine,
Futures Magazine, various books published, internet web sites. There are many thousands
of available indicators out there. Converting this vast array of indicators into actual buy sell
signals and back testing to determine the results was a multi-year undertaking and took
thousands of hours.
Trading System Development Methodology:
System Creation begins with the Process of Elimination –
THOUSANDS TO HUNDREDS TO A PRECIOUS FEW.
My current “arsenal” of trading programs consists of over 200 directories and over
5,000 separate indicators and system. Each directory contains from a few to several
hundred programs. Each directory represents an individual trading system project. I
have researched over 200 over the past ten years. Unfortunately or fortunately, the
final outcome of this extensive research was the vast majority of well known
indicators/systems, do not generate profitable trade signals on any instrument in any
time interval.
Of the few useful indicators that I incorporate in system development in and of
themselves are still not profitable. MACD, Stochastics, Moving Averages, Directional
Movement, Commodity Channel Index, Price Oscillators, Elliott Wave, Fibonacci,
Gann, Bollinger Bands, RSI, Donchian, and many more, even if used “properly” are
not profitable.
6
7. However as “tools” to facilitate trading I have found Directional Movement, Stochastics
and Fibonacci retrenchments useful and do incorporate them into several systems, although
in unconventional ways. using them as divergence indicators, or as final trade triggers
based other favorable custom and proprietary indicator trade setup.
For example, one of the most popular indicators is stochastics, created by George Lane.
Essentially stochastics is similar to other oscillators such as MACD and RSI, as it
oscillates usually on a scale between 0 and 100. Stochastics measures the current close in
relation to the high and low range for a given period, typically 10-20 days.
Like all technical indicators much is open to interoperation, however most will agree the
traditional signal is the crossing of the two stochastic lines; a buy occurs when fast K
crosses from below the slower smoothed slow D. My research of stochastics clearly
demonstrated that taking a trade signal for every cross over will insure massive losses,
especially when used intraday. However, taking the trade on a cross over using a modified
version of stochastics and incorporating other proprietary techniques yields a “system”
much better then the standard stochastics oscillator.
Here is a screen image of an automated trading strategy developed in eSignal’s JavaScript
programming language. eSignals’s JavaScript is used to back test trading systems on
historical data, build customized indicators, and interface with a brokerage firm for
automated trading strategies. In this example the strategy is implemented on symbol SPY,
the S&P 500 Equity ETF, hardly the most profitable instrument to trade but familiar to
most and the benchmark symbol I use for strategy development. This and any JavaScript
strategy can be extensively tested and customized. During development, and in this case for
illustration purposes, this strategy “paints” the screen background to easily indicate the buy
and sell signals. These signals can be just as easily modified to alert the trader to manually
enter a trade; or if a brokerage account is active, automatically send the trade for immediate
execution. The green back ground on the chart indicates a long signals and the red back
ground indicates a short signal.
7
8. Figure: Basic Stochastics Cross Over Trading System: Red (darker shaded
background) is Short, Green (lighter shaded background) is Long trade signal, and
sounds good on CNBC or in a text book, but never worked for me.
The system generated 771 trades and lost $2,228, or over 18% on the initial investment of
$13,000 non-leveraged cost for trading 100 shares of ETF (Symbol SPY) for the last 120
days approximately 5 1/2 months ending January 10, 2009.
Stochastics Formula
A momentum or price velocity indicator that was developed by George C. Lane. It represents a
fixed period-to-period moving calculation that is very susceptible to instability and false signals
since it is possible for the indicator to fluctuate wildly by simply removing data from the oldest
period.
K = Lane's Stochastics
C = the latest closing price of the stock or contract
L = n-period low price of the stock or contract
H = n-period high price of the stock or contract
n = any number (Lane recommends a range of 5 to 21)
SK or %K = three-period simple moving average of K
SD or %D = three-period simple moving average of SK
Source: The Encyclopedia of Technical Market Indicators, Colby and Meyers
8
9. Figure: Equity Curve of Standard Stochastics Crossover System including slippage
of $5.00 a trade and $1.00 per trade on 100 shares. All trading results are based on a
100 share position non leveraged position.
9
10. Demo System, a modified version of the stochastics system using a
custom formula and additional proprietary techniques uncovered
during many years of testing.
Figure: Screen image with trade signals of a Demo system based on a modified
version of the stochastics formula and incorporating other techniques and indicators.
10
11. Figure: This is the equity curve of the same Demo trading system.
This system is possibly worth trading after some additional enhancements. Right now it’s
a rather “dumb” system, minus many of the features usually incorporated into a production
system. What was meant as an illustrative example to explain the overall development
surprisingly performed much better then I expected as it is less complex then most. The
performance was the result of the recent historic level in volatility. The data is for the last
120 trading days, ending January 10, 2009. In 6 months it returned over 57 percent non
leveraged trading 100 shares of the SPY ETF minus slippage of 5 cents a share and 1 cent a
share commission. My guess is the volatility index will continue at relatively high levels
but not at the historic level, so it will make money, but not nearly as much.
However, the numbers, I have gone through a painstaking process of guaranteeing the
results are real. I am absolutely confident that 2 percent per month is a very conservative
estimate. Fortunately, trading volatility based, market neutral strategies allow adjustments
to be made gradually to the system parameters, as the market volatility changes.
What is the objective? Match or exceed the returns of the largest, most successful hedge
funds, which is approximately 2 percent per month.
11
12. Figure: This is the graph of the monthly return and maximum draw down
percentages for the Demo system.
The total return for the 6 month period was over 57 percent, over 100
percent annualized. Obviously the market will not continue to yield such
returns, i.e., 5+ percent per month, but 2 percent return per month, our
stated objective is a “slam dunk.
12
13. Again, this example system was not meant to be pitch for this particular system but rather
used for illustration purposes although I have verified that the results are 100 percent
accurate.
Based on extensive testing what is profitable and worth trading are customized indicators
incorporating separate risk and money management algorithms in combination with
proprietary indicators I have developed over the past 20 years of research.
Figure: Total Trade Analysis illustrating that the Demo system generate a total of 80
trades, 55 percent profitable and the average trade of +$88 on a 100 share SPY
position. Average winning trade of $291 and average loosing trade of ($160).
13
14. Figure: Strategy Performance Report, 6 month return of 57 % on $13,000 of capital,
the cost of purchasing 100 shares of the SPY ETF at the maximum price of $130.
14
15. Choosing the “best” system to trade.
What is the best system? The system that makes the most money? Being risk averse I
favor systems with the lowest maximum intraday drawdown rather then those that net the
largest profit. I addition, one has to be very careful to eliminate all “outlining” or
exceptional trades. If most of the profit was made on a relatively few number of trades then
it’s eliminated from consideration. There are many industry standard measures of “best”
system, using Sharpe or Sortino Ratios calculations and several more. I look at the Sharpe
and Sortino ratios but usually rely on up trending equity curve (with minimal draw downs)
for possible system selection.
This forms the basic foundation of a trading system or the “how” to trade. No system
makes money on all instruments in all time periods.
What other markets yield good results with this “system”? One measure of a system’s
value or robustness is how it performs when applied to other instruments. This system,
unchanged in any way run on the British Pound for the same period returned 35 percent
generating 43 trades with an average trade on a $100K position of $4000 or 400 pips on
average.
Same Demo System Applied to British Pound Sterling, performs well on
Cash FX, Equities, and Financial Commodity Futures.
Figure: Trade signals when applied to the British Pound using current data (we’re
short!).
15
18. Figure: Trade Analysis report for Proprietary Trading System applied to the British
Pound, average trade over 400 pips, 43 trades in the last 120 days.
If I applied the same system to symbols like SKF, the symbol for the US Dow Jones
Financial Index ETF or other volatile symbols the returns are significantly better. In
general if a system makes money on the S&P Futures or SPY ETF it invariably will make
much more on highly liquid, volatile names.
What to trade….scanning the symbol universe?
The next problem to solve once a possible viable trading system algorithm is identified is
what to trade, in what interval, and what time of day to trade it.
Equity instrument selection is done using scanners of the entire symbol universe to select
possible candidates. The scanner allows filtering based on hundreds of different selection
criteria. Ideally to minimize the risk of adverse “news” events the preferred instruments
are: FX, Stock Index Futures, Broad Based ETF Indices, and individual equity symbols.
Although at times small and mid cap names turn up in the final results of the scanner runs.
Generally when individual equity names are chosen, only the most liquid are selected, the
average daily volume for the prior ninety days should be at least 1-5 million shares a day,
18
19. and typically much higher. The objective is to eventually “size up” and not have our orders
impacting price movement to any significant degree. For example a stock that trades 5
million shares a day, a 5,000 share trade represents one tenth of one percent of the average
volume and will have no impact on the stock price and positions of 50,000-100,000
minimal impact during periods of high market activity.
Curve fitting, curve fitting and more curve fitting, hypothetical results are bogus.
Any teenager with a computer these days and Tradestation or eSignal using charting
software can eventually come up with some combination of variables and indicators that
were customized or curve fitted to the data and make a fortune on the past data.
Tradestation has an “optimizer” that will actually do the work for you, i.e., go through
millions of variables, i.e., all moving average crossovers, to find the winning combination
and produce a wonderful report of all the money you will make. Just don’t order the BMW
before the money hits your account as it will disappear fast when you start trading it real
time.
Will that teenager’s golden goose system make money unchanged, on even one symbol
other then the one where all the winning number combinations were tested upon? Highly
doubtful.
Will the system, unmodified make money on the 10-15 of most highly liquid broad based
stock index and sector ETFS’s with a few of the most active household NASDAQ names
thrown in for good measure, using the same intraday time interval for each?
If it does, offer him a job, better yet offer me one, because that’s exactly what this demo
system does. The list of symbols I use in this demo was not filtered from a large list of
varied symbols, selecting the most profitable for inclusion in this report.
I scan the symbol universe using eSignal for intraday scans or Stockfetcher for evening
preparation. The filters used took a year or so to come up with and proprietary but nothing
overly sophisticated. I’ve learned some of the price characteristics that yield the most
promising trading results and run this filter periodically. Here is a screen shot of the list
from today and the trading results using the exact same demo system, unmodified, on
exactly the same time interval for each of these symbols.
Anyone who thinks that is an easy task to pull off, so did I, ten years ago when I left
Goldman Sachs. As I was already “so close”, its taken ten years and a depleted saving’s
account to pull off. Better late then never I always say. It’s infinitely more difficult then I
ever imagined, or frankly I’d still be at Goldman. This system alone, unchanged will match
or beat the vast majority of hedge funds out there today, as is and only gets better with
further refining. Those results I will save for an in person demo.
19
20. Figure: Customized Stockfetcher execution report of all equity symbols, basically
scanning for the most liquid, highest volume and most importantly highest volatile
securities. The higher the volatility the better.
The “optimization” process, there is none!
Optimization, or searching for the best variables which is actually “or curve fitting” is
absolutely out of the question. The Demo system used in this report is identical
throughout. No variables have been changed for any of the historical tests.
Once the system and the candidate list of symbols are determined the “optimization”
process begins. In trading system development terminology optimization is synonymous
with curve fitting, i.e., checking all the combinations of system variables with the actual
price data until a profitable combination is found. Test enough combinations and
eventually a profitable combination will be found to have been profitable on past historical
data. Rarely if ever will this system show profits in the future. Some “optimization” makes
sense.
My optimization consists of choosing the best performing symbol/time period
combination. There is no guarantee we will be here tomorrow let alone how a given stock
will behave. But given the systems are market-neutral and volatility based, the probability
that a stock with an average daily range of 5 points will suddenly range 1 point is less then
continuing closed to the 90 day average of 5 points, and if that happens we make money.
Higher volatility is even better.
Because characteristics of markets change adjustments are made not to the underlying
principles of the system once determined, but rather the money management component.
For example, as volatility decreases, profit targets may be adjusted downward to close out a
trade earlier or volatility based trailing stops tightened, etc.
20
21. So how did it do on the symbols produced by the Stockfetcher scan?
Fortunately or unfortunately the results were stratospheric, off the charts, ridiculous. I
considered putting in $1.00 in slippage to bring the results in line with historical values for
the sake of credibility, but wanted to be accurate. Again my goal is 2-5% a month with
minimal draw downs and cannot over emphasize that there is very little chance recent
numbers will ever be reproduced. The markets volatility was “off the charts” literally,
historic levels.
Monthl Max Sortin Select
Symbol Description y Annual Draw Sharpe o Profit
Rtn % Rtn % Down % Ratio Ratio Factor
SDS ULTRASHORT S&P500 21 262 25 0.53 8.50 1.80
SKF ULTSH FINANCIALS 32 388 0 0.48 2.50 1.70
SRS ULTSH REAL ESTATE 41 499 26 0.66 11.90 1.80
POTASH CORP SASK
POT INC 23 281 55 0.49 7.50 1.40
DIREXION LG CP BEAR
BGZ 3X 45 541 41 0.71 94.70 1.70
GOOG GOOGLE INC 6 78 22 0.15 1.60 -0.90
FSLR FIRST SOLAR INC 11 133 16 0.62 6.90 1.70
SMN ULTSH BASIC MATRLS 6 74 16 0.16 0.70 1.00
CME CME GROUP INC 25 307 38 0.61 2.80 2.10
MZZ ULTRASHORT MDCP400 27 325 46 0.33 3.10 1.10
EEV ULT SHRT MSCI EMRG 94 1130 38 0.57 45.30 2.49
Figure: Monthly and annual return during last 120 trading days for Demo system,
obviously a once in a lifetime performance, or is it?
Of course the system made money, the market is in a massive bear market and your system
is trading the ultra shorts? The only reason I trade the ultra shorts is for the volatility.
Using the SDS for example, the ultra short S&P 500 ETF, in mid July the start of the 120
day trading period, it was trading at $75, yesterday is was also trading at $75, the range
during the time period was a low of $61 in September to a high of $133 in mid November.
Here are the last 10 trades for the SDS:
21
22. Symbol # of % Avg Avg Avg Net Long Short
Trades Profit Trade Win Loss Profit Profit Profit
SDS 79 51 $125 $503 $262 $9,915 6,068.00 $4,825
SKF 75 52 $344 $1,271 $661 $25,772 14,127.00 $12,558
SRS 77 53 $368 $1,130 $499 $28,370 12,996.00 $15,768
POT 76 49 $120 $765 $491 $9,169 (1,497.00) $11,586
BGZ 29 55 $247 $754 $373 $7,188 3,736.00 $3,777
GOOG 95 40 $115 $1,320 $687 $10,991 (3,977.00) $14,090
FSLR 78 46 $238 $1,169 $559 $18,592 3,423.00 $15,942
SMN 77 45 $136 $763 $386 $10,522 6,062.00 $5,205
CME 78 42 $326 $1,949 $863 $25,468 2,397.00 $21,368
MZZ 83 43 $120 $669 $299 $10,024 5,551.00 $4,883
EEV 71 50 $452 $1,298 $417 $32,125 15,168.00 $17,437
Figure: Trade breakdown for all symbols
Potash (POT) and Google (GOOG) shows a negative -$1497 and -$3997 trading from the
long side during the time period what happened? The market happened, POT was cut 75
percent went from a high of $215 to a low of $47, and GOOG was cut in half from $500 to
a low of $250, tough to make money on the long side so loosing $1497 on 37 long trades or
40 cents a trade in POT and 84 cents on 47 trades in GOOG is understandable.
Most of the other symbols are fairly balanced with profit from the long and short side
except for FSLR, which went from $300 to $85 and CME a high of $440 to a low of $155.
22
23. Figure: Last 10 trades for the SDS, during last 120 days SDS and most of the others
symbols made about the same profit on both the long and short side. Except for POT
and GOOG, given POT was down 75% and GOOG 50% loosing from the long side is
t be expected.
When to trade?
Once we have the How (the system), the What (the symbol/time period combination) the
next problem is the When?
One valuable lesson that was derived by sitting in front of the screen for years trying to
make money was the importance of time of day.
For day trading, 2-3 trades a day, the most profitable time of day is the trade signal that
occurs between 10:00 and 11:00am. If I only took one trade a day it would be at this time.
The next most profitable time is 3:00-4:00pm. Trading between 12:00 and 1:30 is a lower
probability trade and usually only yields positive results when the morning trading session
was unusually narrow which does occur perhaps 20 percent of the time.
23
24. For longer term swing systems, one trade every few days, the time of day is less important
although usually trades are generated during the high activity time periods describes above.
After years of testing I have found the most profitable systems trade between 1-3 times per
week. This seems to reflect the fact that markets have a tendency to trade in one direction
for 2-3 days at a time before retracing a portion of the prior move, typically 25 to 68
percent of the prior move before continuing.
Run Prototype and production tuning
The final stop in the development process is to run the systems real time during market
hours firing the automated trades to the simulated broker account. The purpose is to most
importantly validate the profit results from the back test which is run after market hours on
historical data. Frequently back testing results which yield excellent profit results are found
to be far less profitable when run real time. This discrepancy can be caused by software
flaws in the charting package, programmer error, underestimating slippage costs etc.
Validating the back testing results is essential and can only be done in real time.
In addition, watching a system trade real time often uncovers observations that were missed
using historical data, resulting in some stop or profit management replacement.
“Market Time Data”, tick charts, constant volume charts, range charts.
I also research combining various time intervals, using several correlated symbols to
increase the winning trade percentage and using customized time intervals, tick, range,
volume etc. All of which can and frequently improve the systems performance and will be
covered in another section.
24
25. Part 2. Out of sample testing and live trading January 29, 2009
Figure: Screen Image of Demo strategy modified to include a Risk Management
algorithm run on out of sample data. Symbol SDS (SP&500 ultra short) trades during
the three week time period after Part 1 of this paper was distributed.
Today’s date is January 30th, 2009 part one was written on January 10th 2009, part two
describes the process of adding risk management algorithms, testing on out of sample data,
real time testing and actual trade execution. The purpose of part two is to examine how the
systems performed during this 3 week time period. In this case the first “real trade” was
profitable; it could have just easily resulted in a loss. The objective was describing the
methodology, not touting this system.
25
26. However Costly, Risk Management is essential.
Surprisingly adding money management algorithms such as stops will often result in a less
profitable strategy. Apparently an “always in” strategy enables an earlier entry and this can
out weight the advantage of limiting losses via stops placement.
Stops in a sense are insurance. Insuring against a potential disaster is essential. Surprisingly
stops frequently erode strategy performance but can be viewed as life insurance. Like any
insurance policy there is a “premium” cost associated. In the case of this strategy, stops
improve the strategy performance.
There are a large number of stop algorithms to choose from: fixed percentage, moving
average base, dynamic volatility stops, trailing, parabolic, etc. After extensive testing I rely
on a method that serves two purposes: limiting risk and protecting profits.
Screen image of strategy modified to incorporate money management algorithm, which
encompasses the time period since Part 1 was written. On the following screen image for
the S&P 500 Ultra short ETF the red labels were added indicating Long and Short signals,
LX and SX, labels indicate exiting short and long positions, and the red dots represent a
proprietary “trailing stop” algorithm.
26
27. Out of Sample Testing - Verify historical back testing results
Every system needs to have the historical results verified. The first step is to insure the
back testing trade signals and actual report results are the same as those occurring during
real time market hours. One has to be completely certain the reported back testing profit
and loss figures are accurate. Most trading strategy development programs are accurate if
the strategy is coded correctly. However, in order to gauge accuracy and properly factor in
slippage, the strategy is tested in real time on our of sample data.
Once it is determined that the reports are accurate the out of sample results will determine
if the overall strategy results are in line with the back test on historical data. As long as the
strategy is not optimized, results should be similar. The more variable permutations, or
optimization done the greater the chance that the strategy is “curve fitted”. Optimized
strategies rarely if ever produce results on out of sample data. The exact same strategy is
being run on each symbol, eliminating any possibility of “optimization”.
Figure: Trades generated on out of sample symbol SDS (SP500 Ultra short) during
three week period since Part 1 of this paper was distributed. The out of sample results
validate the profitability of the strategy.
27
28. Figure: Strategy Performance Report for out of sample time period system returned
15 percent during the time period, very much in line with prior 6 months in sample
performance results.
28
29. Figure: Total trade analysis report for out of sample time period validates in sample
historical testing period.
29
31. Live Trading Begins
Initially minimally sized trades will be executed while continuing to further validate
trading results prior to increasing position size. The symbols being traded should scale well
as the objective is to maximize strategy profitability. The symbols being trades are highly
liquid, broad based index and sector ETFs.
Compare actual trade execution and eSignal reported execution.
Figure: This was the eSignal trade report signaling a long trade at approximately
10:00am at a price of 75.93 am on 1/29/09 and closed at 1/30/09 for a profit of $350 or
approximately 5 percent. The execution report produced by my firms front end
execution program, HydraTrade, reports the trade, order # 402578 on the INET.
INET is the ECN I routed the order to for symbol SDS and the other symbols
mentioned in this report. The .02 difference is accounted for by slippage which I
specify as .05 for each trade.
31
32. 1/29/2009
EEV Ultra Short MSCI Emerging Mrkts ProShares ETF
Order Gross Ecn Net
Time Id Exchg Liq B/S Qty Price Realized Comm Fee SEC TAF Realized
-0.0
10:01:42 402527 INET A B 10 56.54 -565.4 1 2 0 0 -566.38
Overnight Adjustment 565.4 0 565.4
-0.0
Fills: 1 10 0 1 2 0 0 -0.98
MZZ Ultra Short MidCap400 ProShares ETF
Order Gross Ecn Net
Time Id Exchg Liq B/S Qty Price Realized Comm Fee SEC TAF Realized
-0.1
10:01:58 402536 INET A B 10 59.61 -5961 1 9 0 0 -5961.8
Overnight Adjustment 596.1 0 596.1
-0.3
Fills: 2 190 -2.7 2 6 0.08 0.01 -4.43
SDS Ultra Short S&P500 ProShares ETF
Order Gross Ecn Net
Time Id Exchg Liq B/S Qty Price Realized Comm Fee SEC TAF Realized
-0.0
10:04:18 402578 INET A B 10 75.91 -759.1 1 2 0 0 -760.08
Overnight Adjustment 759.1 0 759.1
-0.0
Fills: 1 10 0 1 2 0 0 -0.98
SRS Ultra Short Real Estate ProShares ETF
Order Gross Ecn Net
Time Id Exchg Liq B/S Qty Price Realized Comm Fee SEC TAF Realized
-0.0
10:06:09 402635 INET A B 10 51.88 -518.8 1 2 0 0 -519.78
Overnight Adjustment 518.8 0 518.8
-0.0
Fills: 1 10 0 1 2 0 0 -0.98
TZA Direxion Small Cap Bear 3X Shares ETF
Order Gross Ecn Net
Time Id Exchg Liq B/S Qty Price Realized Comm Fee SEC TAF Realized
-0.0
10:05:16 402600 INET A B 10 53.04 -530.4 1 2 0 0 -531.38
Overnight Adjustment 530.4 0 530.4
-0.0
Fills: 1 10 0 1 2 0 0 -0.98
Figure: Clearing broker execution report listing the prior days opening trades.
32
33. Figure: Because these trades were executed today, the clearing broker reports will not
be available until tomorrow (actually Monday). This is the trade report produced by
the HydaTrade front end trade execution. Initially only 10 shares are traded as the
system is being validated, even 100 shares in these symbols could result in losses of
thousands of dollars. The instruments traded are highly liquid and position sizes of
many thousands of shares can be held.
Net Net
Symbol Open Close Points Pct
EEV 56.54 58.24 1.7 3.01%
MZZ 59.61 62.48 2.87 4.81%
SDS 75.91 79.57 3.66 4.82%
SRS 51.88 56.66 4.78 9.21%
TZA 53.04 57.66 4.62 8.71%
Figure: Actual Profit and Loss calculation taking data from the earlier execution
report copied into an excel spreadsheet as reported by execution broker report.
Combining Multiple Trading Models – Trend and Counter Trend
33
34. Markets typically go through cycles of trending and non-trending periods. Ideally at least
two separate models traded simultaneously will smooth out the Equity Curve by limiting
draw downs.
During time periods of consolidation or “side ways” market movements, characterized by
less directionality and volatility. A counter trend system will typically profit during the
time period where the trend following system does not. Conversely the counter trending
strategy will under perform the trend following system during higher directional and
volatility time periods. In addition the counter trending model’s performance can be further
enhanced by knowing when to “turn off” or ignore the counter trending time periods. There
are a variety of very effective filters for markets that are strongly trending.
One technique is through regression analysis using linear regression or least square analysis
by calculating the Pearson product-moment correlation coefficient, or Pearson’s R. There
are other more reliable techniques available that are incorporated within the quantitative
trading models.
Figure: Pearson’s R “Trend Strength” Calculation. Determining when a market is
trending and when a market is consolidating. This determines the selection of
available trading models.
34
38. Figure: Side by side comparison of Trend (left) and Counter Trend (right) daily P&L
for last two week periods.
38
39. Notice the largest loosing days on the left trend following column dated 1/22/09 a loss of $
-1386 was offset by a gain of $ +2243 in the trend following system.
Conversely the largest loosing day for the counter trend strategy was today, 2/04/09 for a
loss of $ - 673 which was offset by a gain of $1181 in the trend following system.
The over all effect is that the loosing day percentage goes from approximately 50 percent
to under 25 percent.
39
40. Figure: February 4, 2009 live trading results combining trend and counter trend
following systems.
40
41. Strategy Parallel Testing Phase Prior to Automating Trading.
There is only one way to insure with absolute certainty that a trading model’s results are
accurate. Equally important is insuring that there are not and error in sending orders to an
automated brokerage account. Sending automated trades for immediate execution to any
exchange can entail massive financial liability in the event of programming errors.
The system must be traded in real time during market hours in an actual brokerage account.
It is critical as an interim step to manually execute the trades before turning on automatic
execution.
Due to the time lag between recognizing a trade signal and manually entering the order, the
execution prices reported in the back test reports will not completely synchronized. Once
automated execution is implemented execution price should be 100% synchronized minus
slippage and commission costs. The foundation of a trading systems implementation is the
simulated back tested and forward tested results. These results must be meticulously
verified.
The main objective of this process is to manually insure when a trade signal occurs that the
prices reported in the back tester are aligned, to insure no erroneous trade orders are
generated and to insure that the rules designed into the model are being followed.
Programming in any language requires absolute precision and care in the design and
programming. Programming errors can occur this phase will eliminate the possibility that
any errors are present.
The actual results of today’s trading a profit of $527 matches the $515 reported by the back
testing report ($1188 profit in the trend following system minus a loss of $673 in the
counter trend trading system). Part of the trading model that is not yet implemented is a
scaling in and out of a position, e.g. when a significant profit occurs in a position a portion
of the position is closed. The back testing module is using a fixed share size of 100 shares,
the actual trading size for this phase of testing is between 25 and 200 shares, with 100
being the average to synchronize actual with back testing results.
41
42. Glen M. Demarco – Professional Background
I have worked for over 20 years in the industry starting with Merrill Lynch in the mid
eighties, then Nikko Securities, Deutsche Bank, and finally Goldman Sachs where I left as
a Vice President to pursue full time my interest in money management.
While at Merrill Lynch IT’s department I became extremely interested in technical analysis
and trading. There I began an extensive education process taking many courses at the NYIF
and NYU relating to trading, technical analysis, options, futures, currencies, etc. During
that time I received the Certified Market Technicians (CMT) designation by the Market
Technicians Association. This required quite a few classes, passing a series of exams,
being active in the MTA, and finally writing a thesis on an original technical analysis
concept. Fred Schutzman and Ralph Acompora were my mentors in the program and Phil
Roth reviewed and approved the final thesis requirement.
Since leaving Goldman Sachs I have dedicated myself exclusively to researching,
developing and trading systems. For several years full time I worked as a trader, and traded
options, futures and FX with mixed results. Very short term trading was never my
objective; rather I felt it important to immerse myself in trading as a way of enhancing my
theoretical knowledge base. It was well worth the effort as there are things one learns glued
to the screen for years watching markets that can never be learned any other way.
Please feel free to contact me anytime as I am always available to discuss system trading or
to discuss any mutual beneficial business arrangement. Thanks for listening.
Glen Demarco
20 River Terrace #20A
New York, NY 10282
demarcog@aol.com
home phone 212 786-0909
cell phone 212 433-0872
.
.
42