Downloaded 192 times
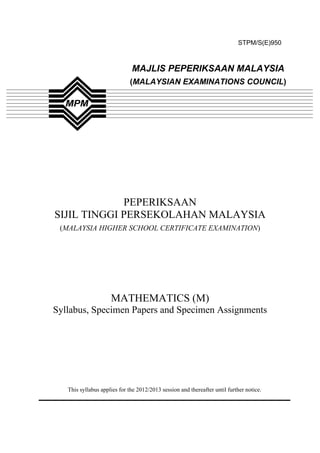
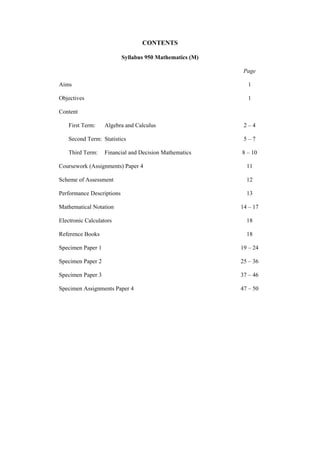
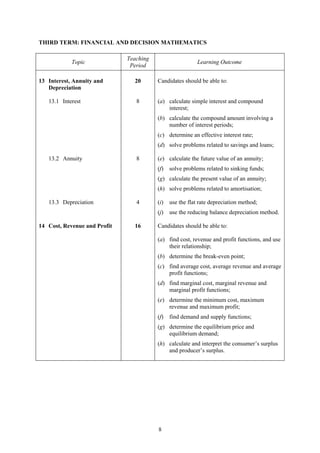
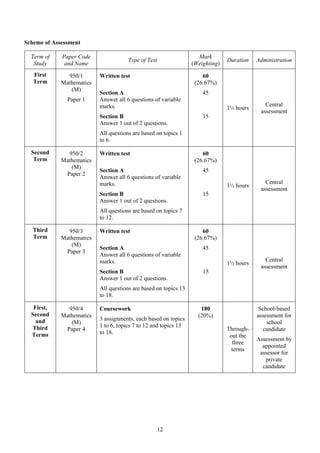
![[ a, b ] closed interval {x | x ∈ , a < x < b}
( a, b ) open interval {x | x ∈ , a < x < b}
[ a, b ) interval {x | x ∈ , a < x < b}
( a, b ] interval {x | x ∈ , a < x < b}
∪ union
∩ intersection
Functions
f a function f
f(x) value of a function f at x
f :A→ B f is a function under which each element of set A has an image in set B
f :x y f is a function which maps the element x to the element y
f −1 inverse function of f
f g composite function of f and g which is defined by f g(x ) = f [g(x)]
e x
exponential function of x
loga x logarithm to base a of x
ln x natural logarithm of x, loge x
Matrices
A a matrix A
0 null matrix
I identity matrix
T
A transpose of a matrix A
−1
A inverse of a non-singular square matrix A
det A determinant of a square matrix A
Derivatives and integrals
lim f ( x) limit of f(x) as x tends to a
x →a
dy
first derivative of y with respect to x
dx
f '( x) first derivative of f(x) with respect to x
d2 y
second derivative of y with respect to x
dx 2
f ''( x ) second derivative of f(x) with respect to x
dn y
nth derivative of y with respect to x
dx n
f (n ) ( x) nth derivative of f(x) with respect to x
∫ y dx indefinite integral of y with respect to x
b
∫ a
y dx definite integral of y with respect to x for values of x between a and b
15](https://image.slidesharecdn.com/950spmathm-120225093235-phpapp02/85/950-Sukatan-Pelajaran-Matematik-M-STPM-Baharu-19-320.jpg)
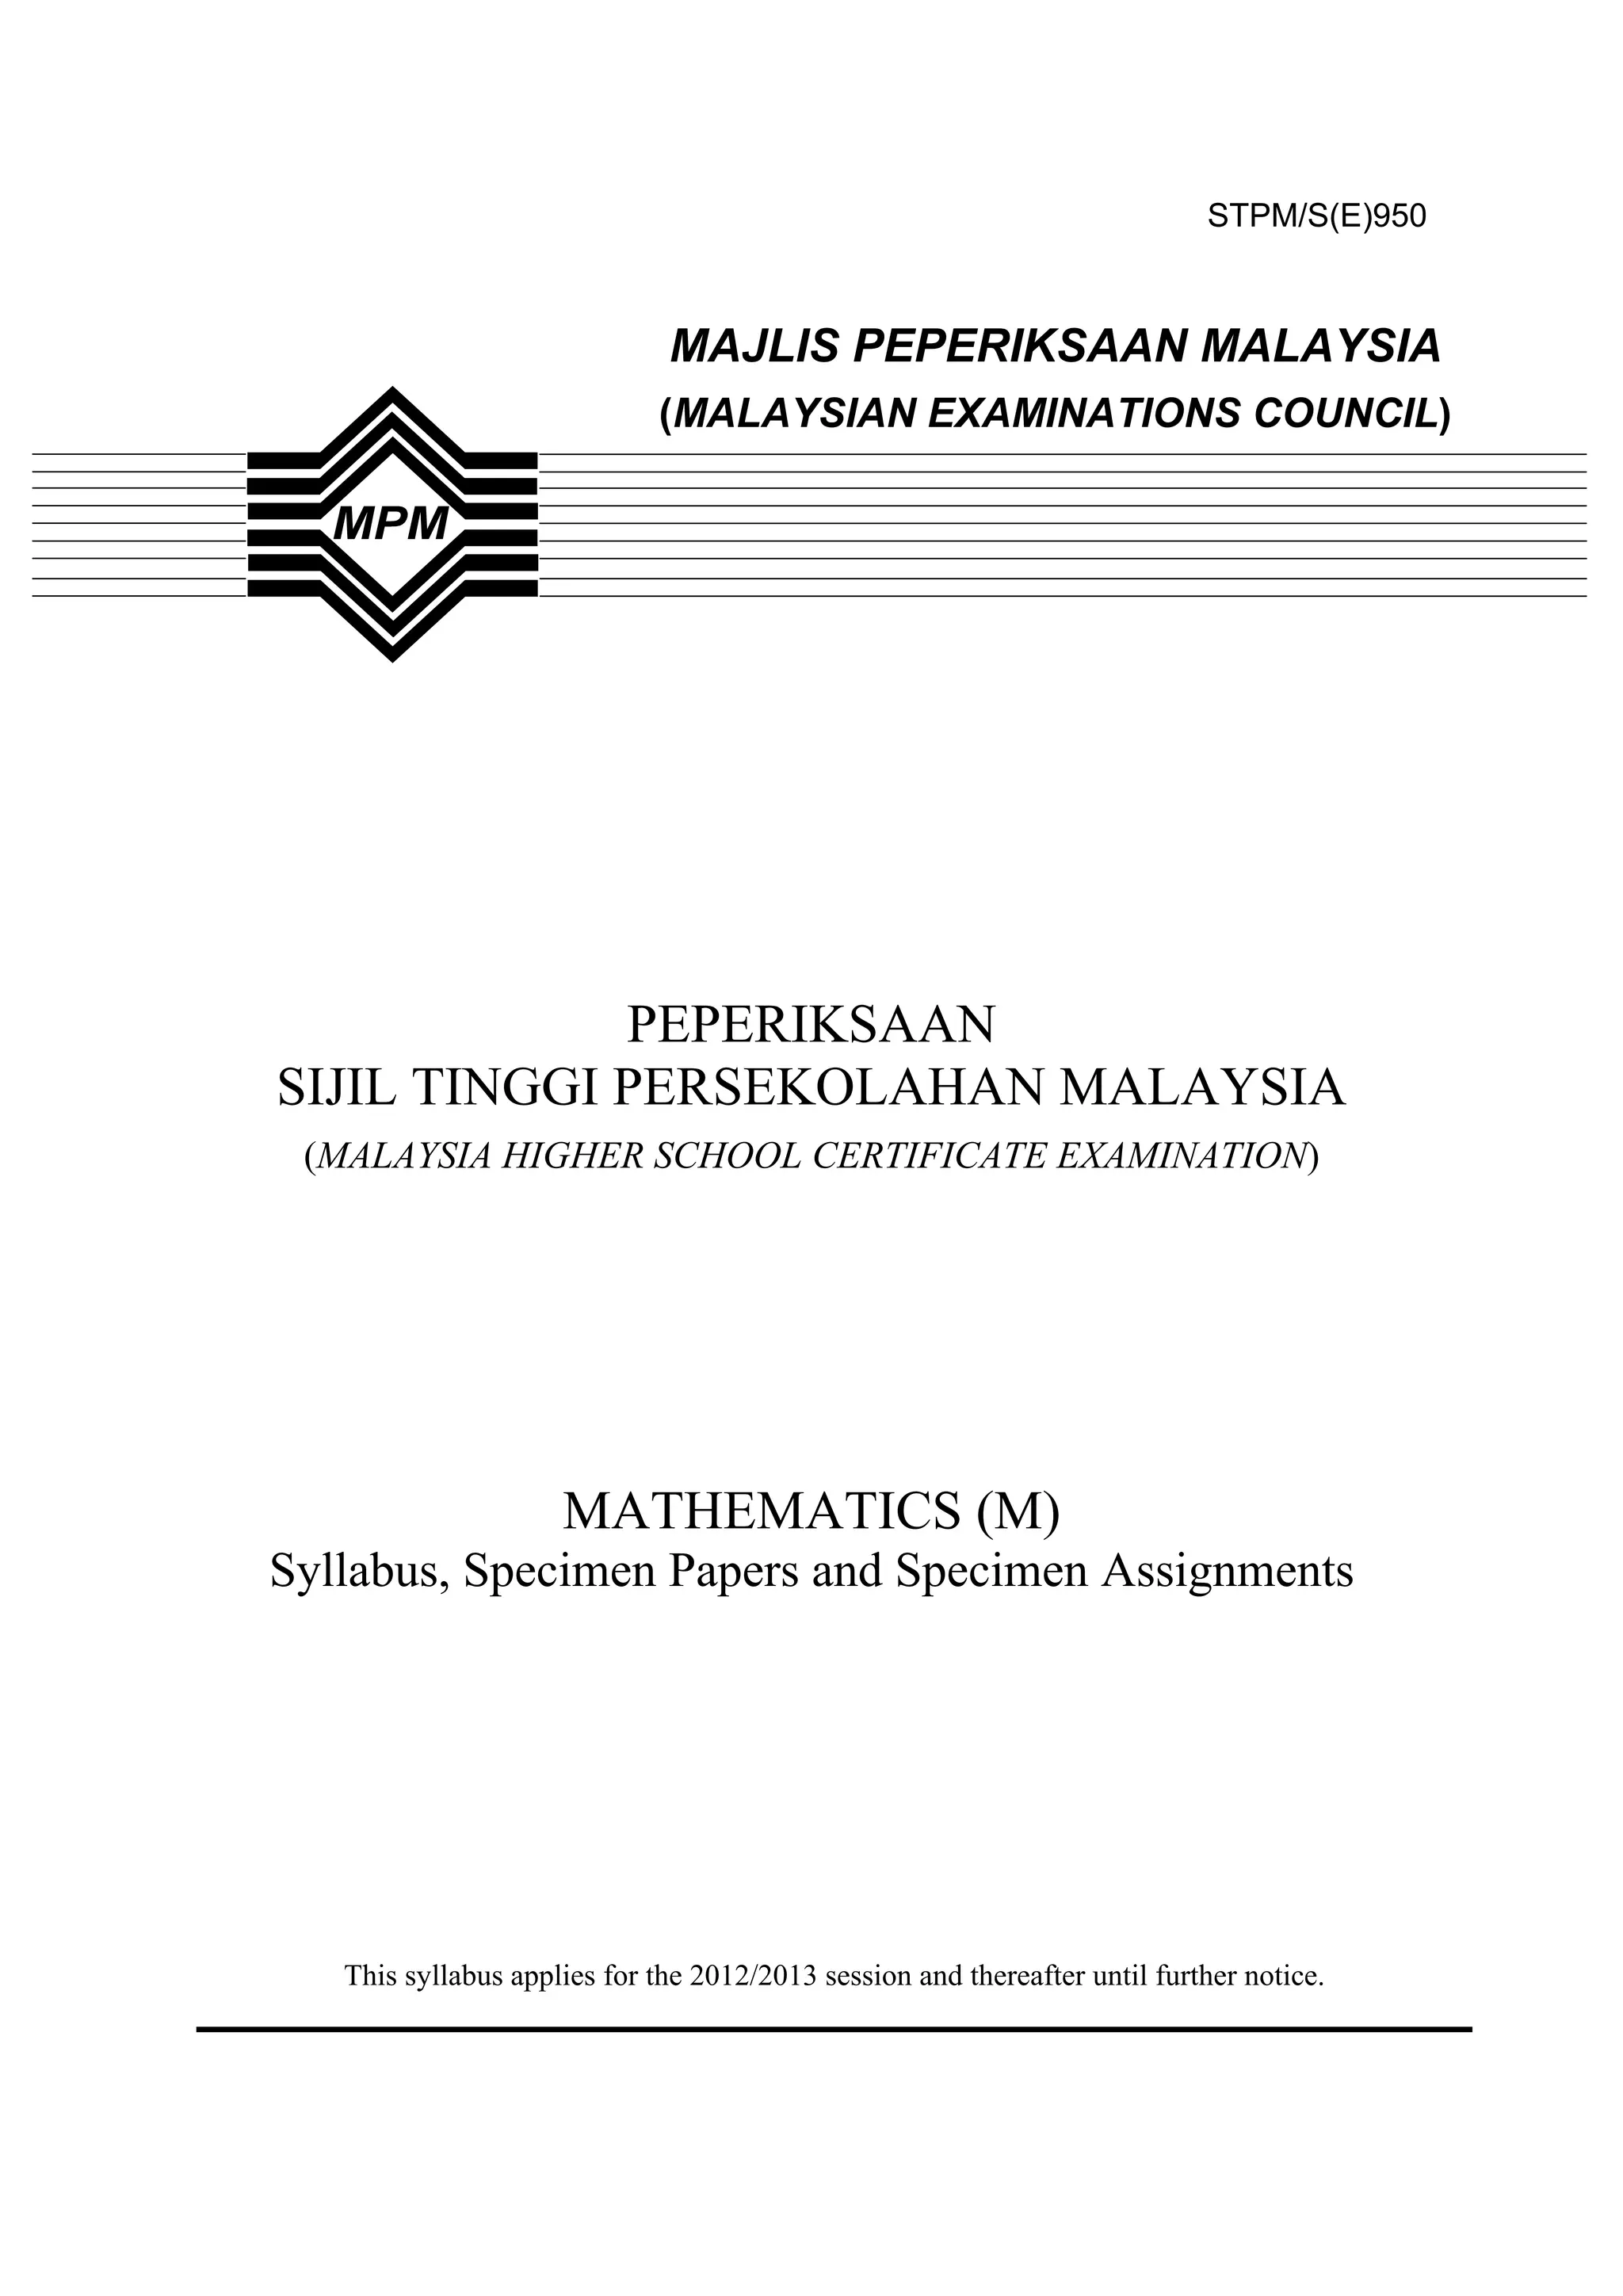
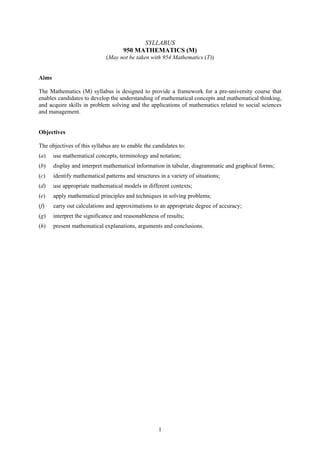
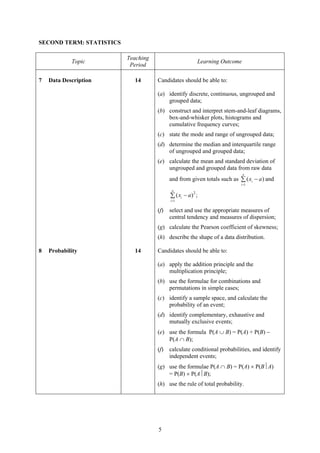
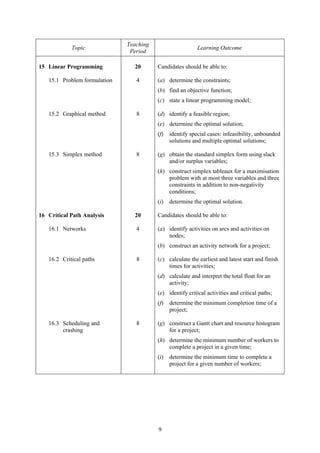
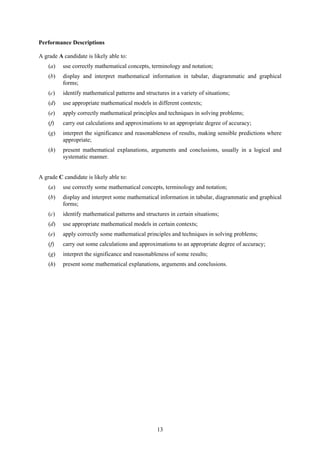
![Section A [45 marks]
Answer all questions in this section.
1 The function f is defined by f(x) = ln (1 – 2x), x < 0.
(a) Find f −1, and state its domain. [3 marks]
−1
(b) Sketch, on the same axes, the graphs of f and f . [4 marks]
(c) Determine whether there is any value of x for which f(x) = f −1(x). [3 marks]
2 The sequence u1, u2, u3, . . . is defined by un+1 = 3un, u1 = 2.
(a) Write down the first five terms of the sequence. [2 marks]
(b) Suggest an explicit formula for ur. [2 marks]
3 Using an augmented matrix and elementary row operations, find the solution of the system of
equations
3x – 2y – 5z = –5
x + 3y – 2z = –6
5x – 4y + z = 11 [9 marks]
4 Find the gradients of the curve y 3 + y = x3 + x 2 at the points where the curve meets the coordinate
axes. [6 marks]
5 Show that
e
∫1 x ln x dx = 1 (e
2
4
+ 1). [4 marks]
e
∫1 x(ln x)
2
Hence, find the value of dx . [3 marks]
6 The variables x and y, where x, y > 0, are related by the differential equation
dy 2y
+ y2 = − .
dx x
u
Using the substitution y = , show that the differential equation may be reduced to
x2
du u2
=− 2. [3 marks]
dx x
Solve this differential equation, and hence, find y, in terms of x, with the condition that y = 1
when x = 1. [6 marks]
950/1
20](https://image.slidesharecdn.com/950spmathm-120225093235-phpapp02/85/950-Sukatan-Pelajaran-Matematik-M-STPM-Baharu-24-320.jpg)
![Bahagian A [45 markah]
Jawab semua soalan dalam bahagian ini.
1 Fungsi f ditakrifkan oleh f(x) = ln (1 – 2x), x < 0.
(a) Cari f −1, dan nyatakan domainnya. [3 markah]
−1
(b) Lakar, pada paksi yang sama, graf f dan f . [4 markah]
(c) Tentukan sama ada terdapat sebarang nilai x untuk f(x) = f −1(x). [3 markah]
2 Jujukan u1, u2, u3, . . . ditakrifkan oleh un+1 = 3un, u1 = 2.
(a) Tulis lima sebutan yang pertama jujukan itu. [2 markah]
(b) Cadangkan satu rumus tak tersirat bagi ur. [2 markah]
3 Dengan menggunakan satu matriks imbuhan dan operasi baris permulaan, cari selesaian sistem
persamaan
3x – 2y – 5z = –5
x + 3y – 2z = –6
5x – 4y + z = 11 [9 markah]
4 Cari kecerunan lengkung y 3 + y = x3 + x 2 di titik di mana lengkung itu bertemu dengan paksi
koordinat. [6 markah]
5 Tunjukkan bahawa
e
∫1 x ln x dx = 1 (e
2
4
+ 1). [4 markah]
e
∫1 x(ln x)
2
Dengan yang demikian, cari nilai dx . [3 markah]
6 Pembolahubah x dan y, dengan x, y > 0, dihubungkan oleh persamaan pembezaan
dy 2y
+ y2 = − .
dx x
u
Dengan menggunakan gantian y = , tunjukkan bahawa persamaan pembezaan itu boleh
x2
diturunkan kepada
du u2
=− 2. [3 markah]
dx x
Selesaikan persamaan pembezaan ini, dan dengan yang demikian, cari y, dalam sebutan x, dengan
syarat y = 1 apabila x = 1. [6 markah]
950/1
21](https://image.slidesharecdn.com/950spmathm-120225093235-phpapp02/85/950-Sukatan-Pelajaran-Matematik-M-STPM-Baharu-25-320.jpg)
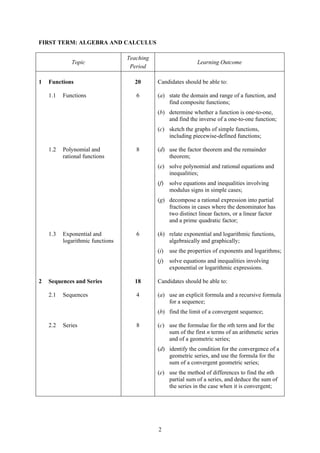
![Section B [15 marks]
Answer any one question in this section.
2 1 + ax
7 Expand (1 + x ) 3 and , where | b | < 1, in ascending powers of x up to the term in x3.
1 + bx
Determine the set of values of x for which both the expansions are valid. [7 marks]
If the two expansions are identical up to the term in x2,
(a) determine the values of a and b, [3 marks]
(b) use x = 1 to obtain the approximation
8
3
81 ≈ 212
49
, [3 marks]
(c) find, correct to five decimal places, the difference between the terms in x3 for the two
expansions with x = 1 .
8 [2 marks]
8 Sketch, on the same axes, the curve y 2 = x and the straight line y = 2 − x, showing the
coordinates of the points of intersection. [4 marks]
(a) State whether the curve y 2 = x has a turning point. Justify your answer. [2 marks]
(b) Calculate the area of the region bounded by the curve y 2 = x and the straight line y = 2 − x.
[4 marks]
(c) Calculate the volume of the solid formed by revolving the region bounded by the
curve y 2 = x and the straight line y = 2 − x completely about the y-axis. [5 marks]
950/1
22](https://image.slidesharecdn.com/950spmathm-120225093235-phpapp02/85/950-Sukatan-Pelajaran-Matematik-M-STPM-Baharu-26-320.jpg)
![Bahagian B [15 markah]
Jawab mana-mana satu soalan dalam bahagian ini.
2 1 + ax
7 Kembangkan (1 + x ) 3 dan , dengan | b | < 1, dalam kuasa x menaik hingga sebutan dalam x3.
1 + bx
Tentukan set nilai x supaya kedua-dua kembangan itu sah. [7 markah]
Jika dua kembangan itu secaman hingga sebutan dalam x2,
(a) tentukan nilai a dan b, [3 markah]
(b) gunakan x = 1 untuk memperoleh penghampiran
8
3
81 ≈ 212
49
, [3 markah]
(c) cari, betul hingga lima tempat perpuluhan, beza antara sebutan dalam x3 bagi dua kembangan
itu dengan x = 1 .
8 [2 markah]
8 Lakar, pada paksi yang sama, lengkung y 2 = x dan garis lurus y = 2 − x, dengan menunjukkan
koordinat titik persilangan. [4 markah]
(a) Nyatakan sama ada lengkung y 2 = x mempunyai titik pusingan. Justifikasikan jawapan anda.
[2 markah]
(b) Hitung luas rantau yang dibatasi oleh lengkung y 2 = x dan garis lurus y = 2 − x. [4 markah]
(c) Hitung isipadu pepejal yang terbentuk dengan mengisar rantau yang dibatasi oleh
lengkung y 2 = x dan garis lurus y = 2 − x selengkapnya di sekitar paksi-y. [5 markah]
950/1
23](https://image.slidesharecdn.com/950spmathm-120225093235-phpapp02/85/950-Sukatan-Pelajaran-Matematik-M-STPM-Baharu-27-320.jpg)
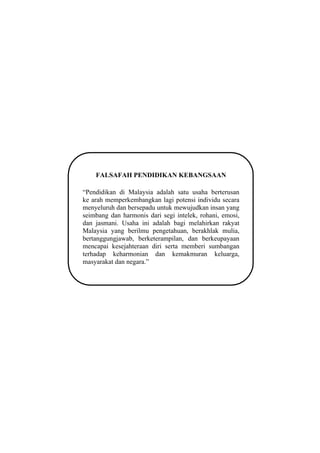
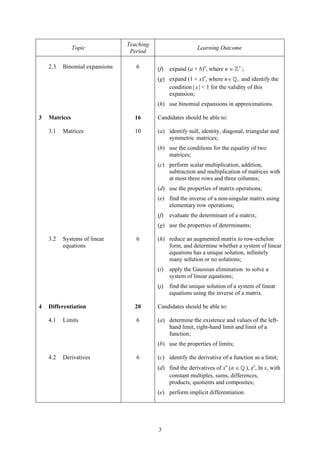
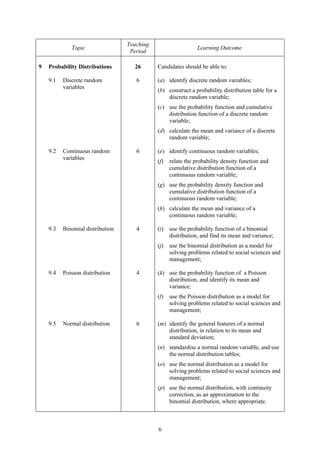
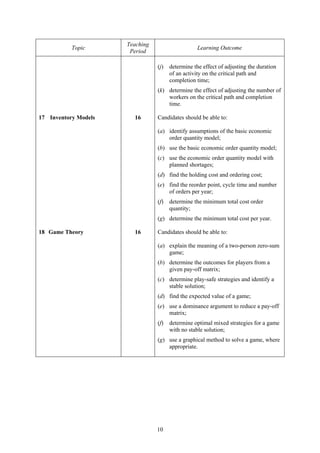
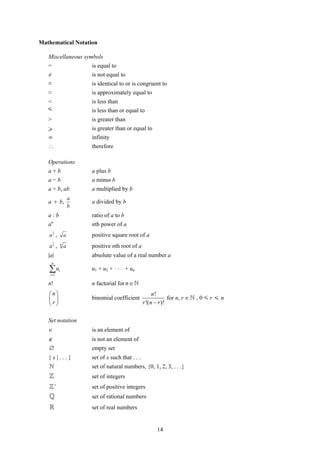
![Section A [45 marks]
Answer all questions in this section.
1 The lengths (in seconds) of 60 songs recorded by a certain group of singers are summarised in the
table below.
Song length (x) Number of songs
0 < x < 120 1
120 < x < 180 9
180 < x < 240 15
240 < x < 300 17
300 < x < 360 13
360 < x < 600 5
(a) Display the data on a histogram. [3 marks]
(b) Calculate the mean song length to the nearest half second. [2 marks]
(c) Calculate the standard deviation of the song lengths to the nearest half second. [3 marks]
2 Two companies X and Y operate call-taxi services in a town. The percentages of residents in the
town using the taxi services from companies X and Y are 40% and 60% respectively. The
probabilities of taxis from companies X and Y being late are 0.02 and 0.01 respectively. A taxi is
booked at random. Find the probability that
(a) the taxi is late and its from company X. [2 marks]
(b) the taxi is late. [3 marks]
3 The probability density function of a continuous random variable X is given by
⎧ ax(b − x), 0 < x < b,
f ( x) = ⎨
⎩0, otherwise,
where a and b are positive constants. It has a value of 1 at the mean value of X.
2
(a) Determine the values of a and b. [7 marks]
(b) Sketch the graph of the probability density function. [2 marks]
950/2
26](https://image.slidesharecdn.com/950spmathm-120225093235-phpapp02/85/950-Sukatan-Pelajaran-Matematik-M-STPM-Baharu-30-320.jpg)
![Bahagian A [45 markah]
Jawab semua soalan dalam bahagian ini.
1 Panjang (dalam saat) 60 lagu yang dirakamkan oleh sekumpulan penyanyi diiktisarkan dalam
jadual di bawah.
Panjang lagu (x) Bilangan lagu
0 < x < 120 1
120 < x < 180 9
180 < x < 240 15
240 < x < 300 17
300 < x < 360 13
360 < x < 600 5
(a) Paparkan data itu pada satu histogram. [3 markah]
(b) Hitung min panjang lagu hingga setengah saat terdekat. [2 markah]
(c) Hitung sisihan piawai panjang lagu itu hingga setengah saat terdekat. [3 markah]
2 Dua syarikat X dan Y mengusahakan perkhidmatan teksi panggilan di sebuah bandar. Peratusan
penduduk di bandar itu yang menggunakan perkhidmatan teksi dari syarikat X dan Y masing-masing
ialah 40% dan 60%. Kebarangkalian teksi dari syarikat X dan Y lewat masing-masing ialah 0.02 dan
0.01. Satu teksi ditempah secara rawak. Cari kebarangkalian bahawa
(a) teksi itu lewat dan teksi itu adalah dari syarikat X. [2 markah]
(b) teksi itu lewat. [3 markah]
3 Fungsi ketumpatan kebarangkalian pembolehubah rawak selanjar X diberikan oleh
⎧ ax(b − x), 0 < x < b,
f ( x) = ⎨
⎩0, jika tidak,
dengan a dan b pemalar positif. Fungsi itu mempunyai nilai 1 pada min nilai X.
2
(a) Tentukan nilai a dan b. [7 markah]
(b) Lakar graf fungsi ketumpatan kebarangkalian itu. [2 markah]
950/2
27](https://image.slidesharecdn.com/950spmathm-120225093235-phpapp02/85/950-Sukatan-Pelajaran-Matematik-M-STPM-Baharu-31-320.jpg)
![4 A study is conducted to assess the impact of the size of a stall, x (in m2) on daily sales, y (in RM).
A random sample of six stalls is taken from several shopping centres. The data obtained are
summarised as follows:
∑ x = 24 400, ∑ y = 28 368, ∑ ( x − x )( y − y ) = 6780,
∑ (x − x ) 2
= 186 333,∑ ( y − y ) 2 = 130 110.
Calculate the coefficient of determination, and comment on your answer. [4 marks]
The study also assesses the impact of the size of a shopping centre on daily sales and finds that
the coefficient of determination is 0.674. State whether the size of a stall or the size of a shopping
centre is more suitable to be used to predict daily sales. Give a reason for your answer. [2 marks]
5 The average prices (in thousand ringgit) and the daily quantities for three models of cars produced
by a car manufacturer for years 2004 to 2006 are given as follows:
Model A Model B Model C
Year
Price Quantity Price Quantity Price Quantity
2004 62 120 46 160 38 100
2005 67 200 47 180 33 90
2006 59 140 48 200 29 70
(a) Taking year 2004 as the base year, calculate the producer price indices for years 2005 and
2006. [4 marks]
(b) Comment on the producer price indices obtained. [1 mark]
6 The table below shows the quarterly water consumption (in thousand cubic metres) of a factory
from the year 2004 to 2007.
Water consumption
Year
Quarter 1 Quarter 2 Quarter 3 Quarter 4
2004 72 56 50 69
2005 73 56 49 70
2006 76 57 50 71
2007 77 58 52 72
(a) Plot a time series, and comment on the appropriateness of a linear trend. [4 marks]
(b) Calculate the centred four-quarter moving averages for this time series. [4 marks]
(c) Calculate the seasonal indices using an additive model. [4 marks]
950/2
28](https://image.slidesharecdn.com/950spmathm-120225093235-phpapp02/85/950-Sukatan-Pelajaran-Matematik-M-STPM-Baharu-32-320.jpg)
![4 Satu kajian dijalankan untuk menaksir impak saiz gerai, x (dalam m2) terhadap jualan harian, y
(dalam RM). Satu sampel rawak enam gerai diambil daripada beberapa pusat beli-belah. Data yang
diperoleh adalah diikhtisarkan seperti yang berikut:
∑ x = 24 400, ∑ y = 28 368, ∑ ( x − x )( y − y ) = 6780,
∑ (x − x ) 2
= 186 333,∑ ( y − y ) 2 = 130 110.
Hitung pekali penentuan, dan berikan ulasan tentang jawapan anda. [4 markah]
Kajian itu juga menaksir impak saiz pusat beli-belah terhadap jualan harian dan mendapati
bahawa pekali penentuan ialah 0.674. Nyatakan sama ada saiz gerai atau saiz pusat beli-belah lebih
sesuai digunakan untuk meramalkan jualan harian. Berikan satu sebab bagi jawapan anda. [2 markah]
5 Harga purata (dalam ribu ringgit) dan kuantiti harian bagi tiga model kereta yang dihasilkan oleh
sebuah pengilang kereta bagi tahun 2004 hingga 2006 diberikan seperti yang berikut:
Model A Model B Model C
Tahun
Harga Kuantiti Harga Kuantiti Harga Kuantiti
2004 62 120 46 160 38 100
2005 67 200 47 180 33 90
2006 59 140 48 200 29 70
(a) Dengan mengambil tahun 2004 sebagai tahun asas, hitung indeks harga pengeluar bagi tahun
2005 dan 2006. [4 markah]
(b) Berikan ulasan tentang indeks harga pengeluar yang diperoleh. [1 markah]
6 Jadual dibawah menunjukkan penggunaan air (dalam ribu meter padu) suku tahunan sebuah
kilang dari tahun 2004 hingga 2007.
Penggunaan air
Tahun
Sukuan 1 Sukuan 2 Sukuan 3 Sukuan 4
2004 72 56 50 69
2005 73 56 49 70
2006 76 57 50 71
2007 77 58 52 72
(a) Plot satu siri masa, dan berikan ulasan tentang kesesuaian trend linear. [4 markah]
(b) Hitung purata bergerak empat-sukuan berpusat bagi siri masa ini. [4 markah]
(c) Hitung indeks bermusim dengan menggunakan satu model berdaya tambah. [4 markah]
950/2
29](https://image.slidesharecdn.com/950spmathm-120225093235-phpapp02/85/950-Sukatan-Pelajaran-Matematik-M-STPM-Baharu-33-320.jpg)
![Section B [15 marks]
Answer any one question in this section.
7 An insurance company finds that 8% of the people who are insured with the company against a
certain risk make claims within a year.
(a) Calculate the probability that at least one out of two randomly selected people who are
insured against the risk makes a claim within a year. [3 marks]
(b) Calculate the probability that at least 3 out of 60 randomly selected people who are insured
against the risk make claims within a year. Comment on the validity of the probability model you use.
[6 marks]
(c) Using an approximate probability distribution, estimate the probability that at least 12 out of
100 randomly selected people who are insured against the risk make claims within a year. Justify your
use of this approximation. [6 marks]
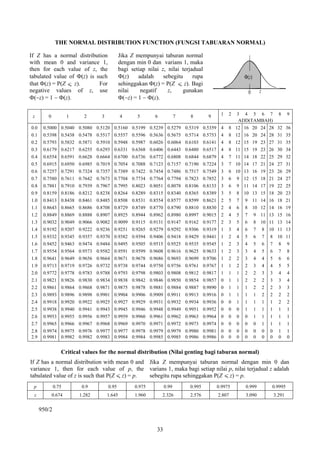
8 The table below shows the values of the variable y corresponding to eight accurately specified
values of the variable x.
x 5 7 9 11 13 15 17 19
y 8.5 15.0 27.5 35.0 28.0 37.0 46.0 37.0
(a) Plot a scatter diagram for the data. [2 marks]
(b) Calculate the Pearson correlation coefficient r between x and y. [5 marks]
(c) Comment on your value of r with respect to the scatter diagram in (a). [1 mark]
(d) Find the equation of the least squares regression line in the form y = a + bx, where a and b are
constants. [4 marks]
(e) Estimate the values of y for x = 0, 10, 20, 30, where appropriate. Give a reason why it is
inappropriate to estimate the values of y for the other given values of x. [3 marks]
950/2
30](https://image.slidesharecdn.com/950spmathm-120225093235-phpapp02/85/950-Sukatan-Pelajaran-Matematik-M-STPM-Baharu-34-320.jpg)
![Bahagian B [15 markah]
Jawab mana-mana satu soalan dalam bahagian ini.
7 Satu syarikat insurans mendapati bahawa 8% orang yang membeli insurans dengan syarikat ini
terhadap risiko tertentu membuat tuntutan dalam jangka masa satu tahun.
(a) Hitung kebarangkalian bahawa sekurang-kurangnya seorang daripada dua orang yang dipilih
secara rawak yang diinsurankan terhadap risiko itu membuat tuntutan dalam jangka masa satu tahun.
[3 markah]
(b) Hitung kebarangkalian bahawa sekurang-kurangnya tiga orang daripada 60 orang yang dipilih
secara rawak yang diinsurankan terhadap risiko itu membuat tuntutan dalam jangka masa satu
tahun. Berikan ulasan tentang kesahan model kebarangkalian yang anda gunakan. [6 markah]
(c) Dengan menggunakan taburan kebarangkalian hampiran, anggar kebarangkalian bahawa
sekurang-kurangnya 12 orang daripada 100 orang yang dipilih secara rawak yang diinsurankan
terhadap risiko itu membuat tuntutan dalam jangka masa satu tahun. Justifikasikan penghampiran
yang anda gunakan ini. [6 markah]
8 Jadual di bawah menunjukkan nilai pembolehubah y yang sepadan dengan lapan nilai
pembolehubah x yang ditentukan secara jitu.
x 5 7 9 11 13 15 17 19
y 8.5 15.0 27.5 35.0 28.0 37.0 46.0 37.0
(a) Plot satu gambar rajah serakan bagi data itu. [2 markah]
(b) Hitung pekali korelasi Pearson r antara x dengan y. [5 markah]
(c) Berikan ulasan tentang nilai r terhadap gambar rajah serakan dalam (a). [1 markah]
(d) Cari persamaan garis regresi kuasa dua terkecil dalam bentuk y = a + bx, dengan a dan b
pemalar. [4 markah]
(e) Anggar nilai y bagi x = 0, 10, 20, 30, di mana sesuai. Berikan satu sebab mengapa tidak sesuai
untuk menganggar nilai y bagi nilai x lain yang diberikan. [3 markah]
950/2
31](https://image.slidesharecdn.com/950spmathm-120225093235-phpapp02/85/950-Sukatan-Pelajaran-Matematik-M-STPM-Baharu-35-320.jpg)
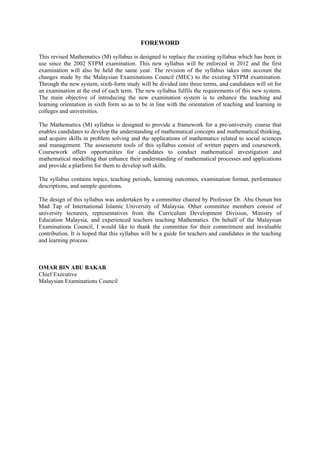
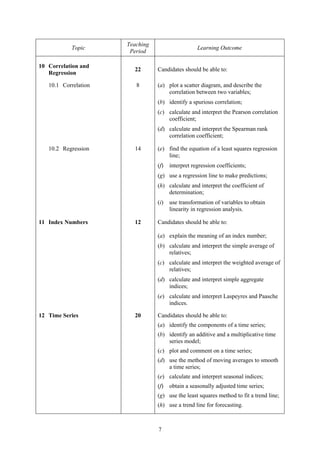
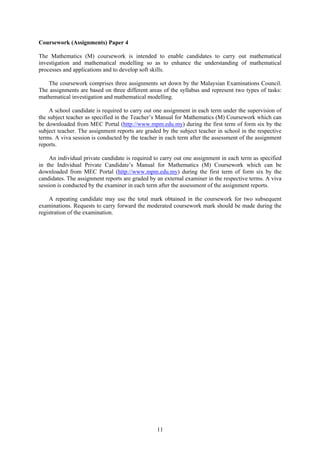
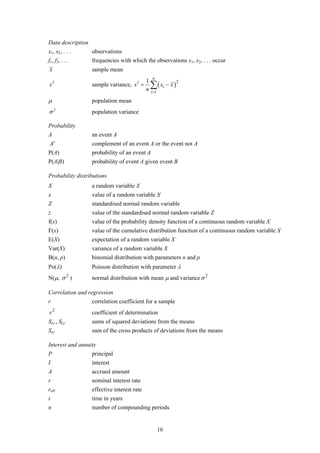
![Section A [45 marks]
Answer all questions in this section.
1 A car which costs RM80000 is bought with a down payment of RM8000 and a loan of
RM72 000. The loan is amortised with 60 monthly payments at an annual interest rate of 3.6%,
compounded monthly. The car depreciates at the rate of 10% per year.
(a) Calculate the monthly payment needed to amortise the loan. [3 marks]
(b) Calculate the total amount of interest paid over 5 years. [2 marks]
(c) Using the reducing balance depreciation method, find the book value of the car when the loan
is paid off. [3 marks]
2 The demand for a campus newspaper is 2300 copies each week if the newspaper is free of charge;
it drops to 1300 copies each week if the newspaper cost RM0.25 per copy. The university is prepared
to supply 500 copies each week free of charge or alternatively 2000 copies each week at RM0.30 per
copy.
(a) Find the linear demand and supply functions. [4 marks]
(b) Determine the price at which the newspaper is to be sold so that there is neither a shortage nor
a surplus. [2 marks]
3 A company produces two types of lamps, A and B, which are made of three types of material: iron
frame, electrical component and plastic component. Each lamp A requires 1 unit of iron frame,
2 units of electrical component and 3 units of plastic component, whereas each lamp B requires 3
units of iron frame, 2 units of electrical component and 1 unit of plastic component. The company has
300 000 units of iron frame, 300 000 units of electrical component and 400 000 units of plastic
component in stock. The profits made from each lamp A and lamp B are RM15.00 and RM20.00
respectively.
(a) Formulate a linear programming problem to maximise profit subject to the constraints.
[4 marks]
(b) Using the graphical method, determine the number of lamp A and the number of lamp B
which give the maximum profit, and find this maximum profit. [8 marks]
4 A project on setting a student registration system of a college involves seven activities. The
activities, their preceding activities and duration (in days) are listed as follows:
Activity Preceding activities Duration
A − 4
B − 2
C − 3
D A 8
E B 6
F C 3
G D,E 4
Determine the earliest start time and the latest finish time for each activity, and hence, find the
minimum duration for the project to be completed. [6 marks]
950/3
38](https://image.slidesharecdn.com/950spmathm-120225093235-phpapp02/85/950-Sukatan-Pelajaran-Matematik-M-STPM-Baharu-42-320.jpg)
![Bahagian A [45 markah]
Jawab semua soalan dalam bahagian ini.
1 Sebuah kereta berharga RM80000 dibeli dengan bayaran pendahuluan RM8000 dan pinjaman
RM72000. Pinjaman itu dilunaskan dengan bayaran bulanan 60 bulan pada kadar faedah tahunan
3.6%, dikompaun secara bulanan. Nilai kereta itu susut pada kadar 10% per tahun.
(a) Hitung bayaran balik bulanan yang diperlukan untuk melunaskan pinjaman itu. [3 markah]
(b) Hitung jumlah amaun faedah yang dibayar selama 5 tahun. [2 markah]
(c) Dengan menggunakan kaedah susut nilai baki berkurangan, cari nilai buku kereta itu apabila
pinjaman habis diselesaikan. [3 markah]
2 Permintaan akhbar kampus ialah 2300 naskhah setiap minggu jika akhbar itu percuma;
permintaan itu menurun kepada 1300 naskhah setiap minggu jika harga akhbar itu ialah RM0.25 per
naskhah. Universiti itu bersedia untuk menawarkan 500 naskhah percuma setiap minggu atau sebagai
alternatif 2000 naskhah setiap minggu dengan harga RM0.30 per naskhah.
(a) Cari fungsi permintaan dan fungsi penawaran linear. [4 markah]
(b) Tentukan harga surat khabar yang perlu dijual supaya tidak berlaku kurangan atau lebihan.
[2 markah]
3 Satu syarikat menghasilkan dua jenis lampu, A dan B, yang diperbuat daripada tiga jenis bahan:
bingkai besi, komponen elektrik dan komponen plastik. Setiap lampu A memerlukan 1 unit bingkai
besi, 2 unit komponen elektrik dan 3 unit komponen plastik, manakala setiap lampu B memerlukan
3 unit bingkai besi, 2 unit komponen elektrik dan 1 unit komponen plastik. Syarikat itu mempunyai
300 000 unit bingkai besi, 300 000 unit komponen elektrik dan 400 000 unit komponen plastik dalam
stok. Keuntungan yang diperoleh daripada setiap lampu A dan lampu B masing-masing ialah
RM15.00 dan RM20.00.
(a) Rumuskan satu masalah pengaturcaraan linear untuk memaksimumkan keuntungan tertakluk
kepada kekangan itu. [4 markah]
(b) Dengan menggunakan kaedah bergraf, tentukan bilangan lampu A dan bilangan lampu B yang
memberikan keuntungan maksimum, dan cari keuntungan maksimum ini. [8 markah]
4 Satu projek tentang pembangunan sistem pendaftaran pelajar di sebuah kolej melibatkan tujuh
kegiatan. Kegiatan, kegiatan sebelumnya dan tempoh (dalam hari) disenaraikan seperti yang berikut:
Kegiatan Kegiatan sebelumnya Tempoh
A − 4
B − 2
C − 3
D A 8
E B 6
F C 3
G D,E 4
Tentukan masa mula terawal dan masa tamat terlewat bagi setiap kegiatan, dan dengan yang
demikian, cari tempoh minimum bagi menyempurnakan projek itu. [6 markah]
950/3
39](https://image.slidesharecdn.com/950spmathm-120225093235-phpapp02/85/950-Sukatan-Pelajaran-Matematik-M-STPM-Baharu-43-320.jpg)
![5 A retailer expects to sell 500 units of an electronic component per year. The cost per unit is RM30
and the ordering cost is RM50 per order. The holding cost per unit of this product is RM3 per year.
The replacement is instantaneous and no shortages are allowed.
(a) Find the optimum economic lot size. [2 marks]
(b) Determine the number of orders per year. [3 marks]
(c) Calculate the total cost per year. [4 marks]
6 A two-person zero-sum game for players A and B is represented by the pay-off matrix
B
I II III
I 2 1 3
A II 3 −5 4
III 0 1 5
(a) Show that the game has a stable solution. [3 marks]
(b) State the value of the game. [1 mark]
950/3
40](https://image.slidesharecdn.com/950spmathm-120225093235-phpapp02/85/950-Sukatan-Pelajaran-Matematik-M-STPM-Baharu-44-320.jpg)
![5 Seorang peruncit menjangka untuk menjual 500 unit sejenis komponen elektronik per tahun. Kos
per unit ialah RM30 dan kos pesanan ialah RM50 per pesanan. Kos pegangan per unit produk ini ialah
RM3 per tahun. Penggantian adalah serta merta dan tiada kurangan yang dibenarkan.
(a) Cari saiz lot ekonomi optimum. [2 markah]
(b) Tentukan bilangan pesanan per tahun. [3 markah]
(c) Hitung jumlah kos per tahun. [4 markah]
6 Satu permainan two-person zero-sum bagi pemain A dan B diwakilkan oleh matriks timbal-balik
B
I II III
I 2 1 3
A II 3 −5 4
III 0 1 5
(a) Tunjukkan bahawa permainan itu mempunyai satu penyelesaian stabil. [3 markah]
(b) Nyatakan nilai permainan itu. [1 markah]
950/3
41](https://image.slidesharecdn.com/950spmathm-120225093235-phpapp02/85/950-Sukatan-Pelajaran-Matematik-M-STPM-Baharu-45-320.jpg)
![Section B [15 marks]
Answer any one question in this section.
7 The number of units, x, demanded for a certain product depends on the unit price, p (in RM), and
is given by
x = 120 000 − 2 p ,
where 0 < p < 60 000. The cost C (in RM) of producing x units is given by
C = 35 000 x − 0.1x 3 ,
where 0 < x < 300.
(a) Find the revenue in terms of x. [3 marks]
(b) Determine the demand and the unit price for which the revenue is maximum and find the
maximum revenue. [6 marks]
(c) Calculate the average cost per unit at the production level in (b). [2 marks]
(d) Determine the production levels at which the profit is increasing. [4 marks]
8 Two computer companies X and Y are the only sale and service providers in a region. Both
companies advertise their sales and services through radio (I), television (II) and newspaper (III).
Depending on the effectiveness of each advertising campaign, a company can capture a portion of the
customers from the other. The following pay-off matrix summarises the percentages of the customers
captured or lost by company X.
Y
I II III
I 5 –15 5
X II –5 10 –20
III 15 5 –10
(a) State a reason why company Y should not use the radio as a medium of advertising. [1 mark]
(b) Use a graphical method to determine the optimal strategy of company Y, and hence, find the
percentage gain of the company. [10 marks]
(c) Determine the optimal strategy of company X. [4 marks]
950/3
42](https://image.slidesharecdn.com/950spmathm-120225093235-phpapp02/85/950-Sukatan-Pelajaran-Matematik-M-STPM-Baharu-46-320.jpg)
![Bahagian B [15 markah]
Jawab mana-mana satu soalan dalam bahagian ini.
7 Bilangan unit, x, yang diminta bagi satu produk tertentu bergantung pada harga unit, p
(dalam RM), dan diberikan oleh
x = 120 000 − 2 p ,
dengan 0 < p < 60 000. Kos C (dalam RM) untuk menghasilkan x unit diberikan oleh
C = 35 000 x − 0.1x 3 ,
dengan 0 < x < 300.
(a) Cari hasil dalam sebutan x. [3 markah]
(b) Tentukan permintaan dan harga unit supaya hasil adalah maksimum dan cari hasil maksimum
itu. [6 markah]
(c) Hitung kos purata per unit pada aras pengeluaran dalam (b). [2 markah]
(d) Tentukan aras pengeluaran supaya keuntungan menokok. [4 markah]
8 Dua syarikat komputer X dan Y sahaja yang menawarkan jualan dan perkhidmatan di satu rantau.
Kedua-dua syarikat mengiklankan jualan dan perkhidmatan mereka melalui radio (I), televisyen (II),
dan surat khabar (III). Bergantung kepada keberkesanan setiap kempen pengiklanan, satu syarikat
boleh menarik sebahagian daripada pelanggan daripada syarikat pesaing. Matriks timbal-balik yang
berikut mengikhtisarkan peratusan pelanggan yang ditarik atau hilang oleh syarikat X.
Y
I II III
I 5 –15 5
X II –5 10 –20
III 15 5 –10
(a) Nyatakan satu sebab mengapa syarikat Y tidak patut menggunakan radio sebagai perantara
pengiklanan. [1 markah]
(b) Gunakan kaedah bergraf untuk menentukan strategi optimum syarikat Y, dan dengan yang
demikian, cari peratusan keuntungan syarikat itu. [10 markah]
(c) Tentukan strategi optimum syarikat X. [4 markah]
950/3
43](https://image.slidesharecdn.com/950spmathm-120225093235-phpapp02/85/950-Sukatan-Pelajaran-Matematik-M-STPM-Baharu-47-320.jpg)
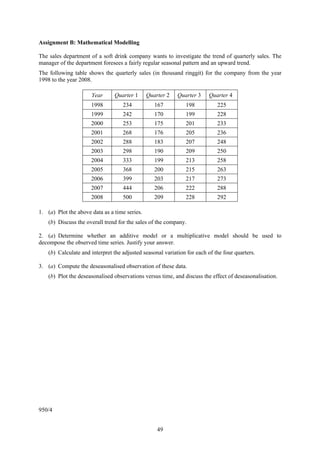
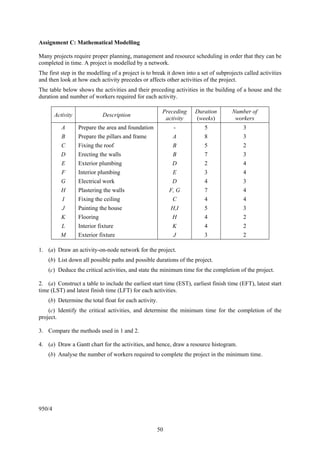

The document is a syllabus for the Mathematics (M) course in the STPM examination in Malaysia. It outlines the course content, which is divided into three terms covering various topics in algebra, calculus, statistics, and financial mathematics. The aims are to develop students' understanding of mathematical concepts and thinking skills, as well as their problem-solving and application abilities related to social sciences and management. Assessment includes written papers and coursework assignments. The syllabus provides learning outcomes, teaching periods, sample questions, and other guidance for teaching and learning the course.


