205 – Materials& Logistics
Management
4. Material Requirement
Planning
2.
Material Planning
Material planningis a scientific way of determining the requirements
of….
• Raw Material
• Bought Out Parts
• other parts
ensuring their availability in the right quantities at the right time with
minimum capital lock up.
3.
Traditional method ofMaterial Planning
Material Planning department was calculating the requirement as per the
Back Orders + Confirm Orders + Forecast + Stocking Pattern. They were
calculating the Gross Requirement.
This Gross requirement was handed over to stores department for checking
the stock available in the stores.
Production department used to give their WIP stocks to Material Planning.
Material Planning department calculates the Net Requirement = Gross
requirement – ( Store Stock + WIP Stock ).
Net Requirement handed over to Purchase Department.
Purchase Department will deduct the On Order Quantities and calculate the
EXACT quantity to order.
4.
Current approach toMaterial Planning - MRP
MRP is a system that controls …..
• Inventory Levels
• Plans the Production
• helps to supply management with important information
• helps with manufacturing control system with respect to the production of
assembled parts.
5.
1. Ensure exactQuantity with exact specification is available at point of
consumption at Right Time.
2. Elimination of Non-Moving generation.
3. Proactive approach instead of reactive approach towards material.
4. Generate exact requirement.
5. To validate Bill of Quantities.
6. Optimization of Inventories.
7. To Maintain Buffer or No Inventory.
MRP must answer the following Basic Questions…
1. What are we going to make ?
2. What does it take to make it ?
3. What do we have ?
4. What do we need and When ?
Objectives of - MRP
6.
1. Reduce InventoryLevels
2. Reduce Component Shortages
3. Improve Shipping Performance
4. Improve Customer Service
5. Improve Productivity
6. Simplified and Accurate Scheduling
7. Reduce Purchasing Cost
8. Improve Production Schedules
9. Reduce Manufacturing Cost
10.Reduce Lead Times
11.Less Scrap and Rework
12.Higher Production Quality
13.Improve Communication
14.Improve Plant Efficiency
15.Reduce Freight Cost
16.Reduction in Excess Inventory
Advantages of - MRP
7.
17. Reduce Overtime
18.Improve Supply Schedules
19. Improve Calculation of Material Requirements
20. Improve Competitive Position
8.
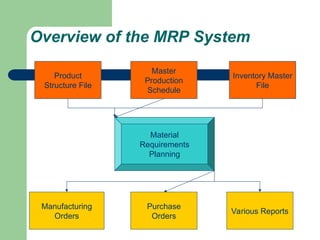
Overview of theMRP System
Product
Structure File
Master
Production
Schedule
Inventory Master
File
Material
Requirements
Planning
Manufacturing
Orders
Purchase
Orders
Various Reports
9.
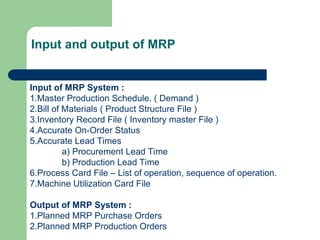
Input of MRPSystem :
1.Master Production Schedule. ( Demand )
2.Bill of Materials ( Product Structure File )
3.Inventory Record File ( Inventory master File )
4.Accurate On-Order Status
5.Accurate Lead Times
a) Procurement Lead Time
b) Production Lead Time
6.Process Card File – List of operation, sequence of operation.
7.Machine Utilization Card File
Output of MRP System :
1.Planned MRP Purchase Orders
2.Planned MRP Production Orders
Input and output of MRP
10.
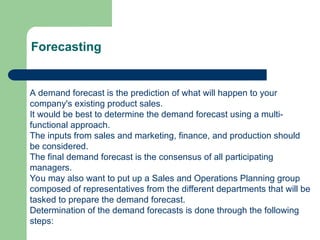
A demand forecastis the prediction of what will happen to your
company's existing product sales.
It would be best to determine the demand forecast using a multi-
functional approach.
The inputs from sales and marketing, finance, and production should
be considered.
The final demand forecast is the consensus of all participating
managers.
You may also want to put up a Sales and Operations Planning group
composed of representatives from the different departments that will be
tasked to prepare the demand forecast.
Determination of the demand forecasts is done through the following
steps:
Forecasting
11.
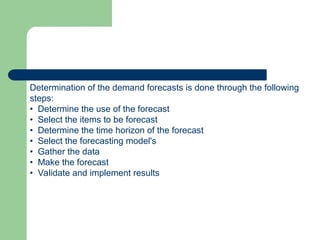
Determination of thedemand forecasts is done through the following
steps:
• Determine the use of the forecast
• Select the items to be forecast
• Determine the time horizon of the forecast
• Select the forecasting model's
• Gather the data
• Make the forecast
• Validate and implement results
12.
Quantitative and QualitativeMethods of
Forecasting
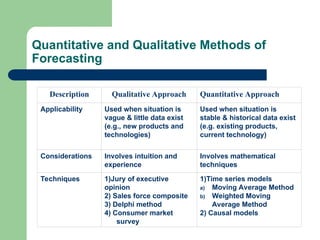
Description Qualitative Approach Quantitative Approach
Applicability Used when situation is
vague & little data exist
(e.g., new products and
technologies)
Used when situation is
stable & historical data exist
(e.g. existing products,
current technology)
Considerations Involves intuition and
experience
Involves mathematical
techniques
Techniques 1)Jury of executive
opinion
2) Sales force composite
3) Delphi method
4) Consumer market
survey
1)Time series models
a) Moving Average Method
b) Weighted Moving
Average Method
2) Causal models
13.
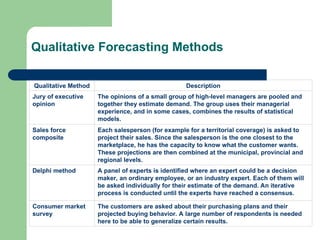
Qualitative Forecasting Methods
QualitativeMethod Description
Jury of executive
opinion
The opinions of a small group of high-level managers are pooled and
together they estimate demand. The group uses their managerial
experience, and in some cases, combines the results of statistical
models.
Sales force
composite
Each salesperson (for example for a territorial coverage) is asked to
project their sales. Since the salesperson is the one closest to the
marketplace, he has the capacity to know what the customer wants.
These projections are then combined at the municipal, provincial and
regional levels.
Delphi method A panel of experts is identified where an expert could be a decision
maker, an ordinary employee, or an industry expert. Each of them will
be asked individually for their estimate of the demand. An iterative
process is conducted until the experts have reached a consensus.
Consumer market
survey
The customers are asked about their purchasing plans and their
projected buying behavior. A large number of respondents is needed
here to be able to generalize certain results.
14.
Moving Average Method
MAis a series of arithmetic means and is used if little or no trend is
present in the data; provides an overall impression of data over time
A simple moving average uses average demand for a fixed sequence
of periods and is good for stable demand with no pronounced
behavioral patterns.
Equation:
F 4 = [D 1 + D2 + D3] / 3
F – forecast, D – Demand, No. – Period
Quantitative Forecasting Methods
15.
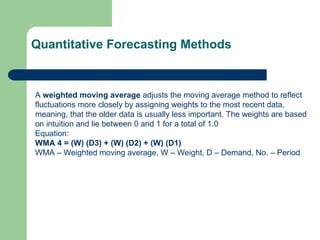
A weighted movingaverage adjusts the moving average method to reflect
fluctuations more closely by assigning weights to the most recent data,
meaning, that the older data is usually less important. The weights are based
on intuition and lie between 0 and 1 for a total of 1.0
Equation:
WMA 4 = (W) (D3) + (W) (D2) + (W) (D1)
WMA – Weighted moving average, W – Weight, D – Demand, No. – Period
Quantitative Forecasting Methods
16.
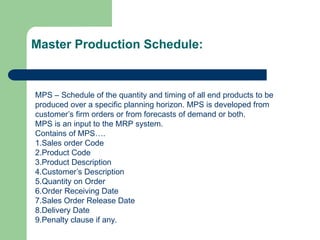
MPS – Scheduleof the quantity and timing of all end products to be
produced over a specific planning horizon. MPS is developed from
customer’s firm orders or from forecasts of demand or both.
MPS is an input to the MRP system.
Contains of MPS….
1.Sales order Code
2.Product Code
3.Product Description
4.Customer’s Description
5.Quantity on Order
6.Order Receiving Date
7.Sales Order Release Date
8.Delivery Date
9.Penalty clause if any.
Master Production Schedule:
17.
Master Production Schedule:
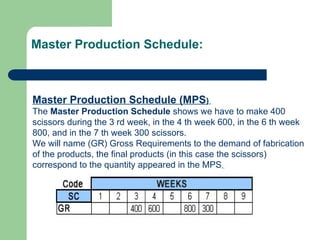
MasterProduction Schedule (MPS)
The Master Production Schedule shows we have to make 400
scissors during the 3 rd week, in the 4 th week 600, in the 6 th week
800, and in the 7 th week 300 scissors.
We will name (GR) Gross Requirements to the demand of fabrication
of the products, the final products (in this case the scissors)
correspond to the quantity appeared in the MPS.
18.
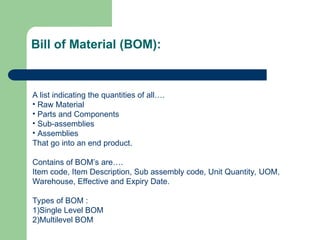
A list indicatingthe quantities of all….
• Raw Material
• Parts and Components
• Sub-assemblies
• Assemblies
That go into an end product.
Contains of BOM’s are….
Item code, Item Description, Sub assembly code, Unit Quantity, UOM,
Warehouse, Effective and Expiry Date.
Types of BOM :
1)Single Level BOM
2)Multilevel BOM
Bill of Material (BOM):
19.
Manufacturing Resource Planning(MRP II):
MRP II is a natural outgrowth of MRP I whereas MRP I focuses upon
priorities of material and CRP is concerned with time.
Both material and time are integrated within the MRP system (MRP I).
Beyond this, MRP II has been coined to “close the loop” by integrating
Financial, Accounting, Personnel, Engineering and Marketing information
along with the production planning and control activities of basic MRP
system.
MRP II is the heart of corporate management information system for many
manufacturing firms.
MRP II is a management process for taking the business plan and breaking it
down into specific, detailed tasks that people evaluate, agree upon and are
help accountable for.
20.
Manufacturing Resource Planning(MRP II):
It involves all department…
• Materials and Engineering - that must maintain BOM.
• Sales and Marketing – that must keep sales plan up to date.
• Purchasing and Manufacturing – that must meet due dates for bought out
items and in-house items respectively.
21.
Enterprise Resource Planning( ERP ):
ERP is today’s buzzword in the corporate world.
Companies world-wide use ERP to integrate business process and thereby
reduce costs and increase productivity.
Traditionally companies developed isolated computer application to suit and
satisfy each of their functional segments such as Sales, Purchase,
Production, Inventory, Personnel and Accounts.
MRP-I and MRP-II were developed basically to address the requirements of
the manufacturing set-up.
But the information available in various functional areas was so scattered that
it almost impossible to consolidate the information and provide the same to
TOP management to enable them to take vital business decisions.
Hence the companies whether in the Manufacturing or the service sector
have been searching for the TOTAL SOLUTION on an integrated system
which could provide for the information needs of the entire enterprise.
22.
Scope of ERP:
1. Financials – Financial Accounting, Treasury Management, Asset
Management.
2. Logistics – Production Planning, Materials Management, Plant
Maintenance, Quality Management, Project Management, Sales and
Distribution Management.
3. Human Resources – Personnel Management, Training & Skills
development.
4. Work Flow – Integrates the entire organization with flexible assignment of
task and responsibilities to locations, positions, jobs, groups or
individuals.
23.
Benefits of ERP:
ERP brings together, people who work on shared tasks within the same
enterprise or in their dealings with suppliers and customers and ensures the
smooth flow of information at all levels and accessibility to up to date
Information.
Tangible benefits are…
• Reduction of lead time by 60%.
• 99% on time shipment.
• Doubled business.
• Increase of inventory turn over to over 30%.
• Reduction of cycle time to 80%.
• Reduction of WIP inventory to 70%.
Intangible benefits are …
• Better customer satisfaction.
• Improved Vendor performance.
• Improved Resources utilization.
• Improved Information Accuracy and decision making capability.

![Moving Average Method
MA is a series of arithmetic means and is used if little or no trend is
present in the data; provides an overall impression of data over time
A simple moving average uses average demand for a fixed sequence
of periods and is good for stable demand with no pronounced
behavioral patterns.
Equation:
F 4 = [D 1 + D2 + D3] / 3
F – forecast, D – Demand, No. – Period
Quantitative Forecasting Methods](https://image.slidesharecdn.com/93760232-material-requirement-planning-250623171506-09307304/85/93760232-Material-Requirement-Planning-ppt-14-320.jpg)