Download to read offline
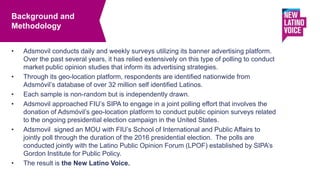
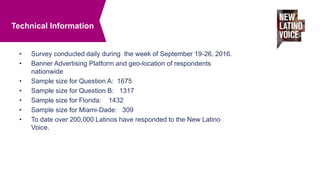
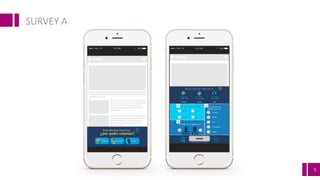
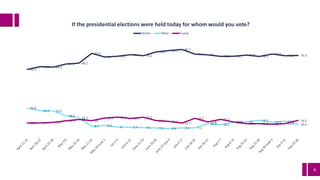

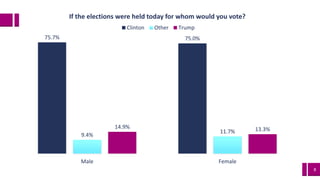


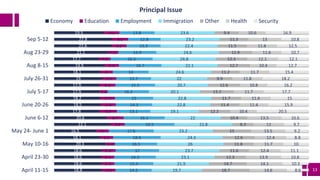
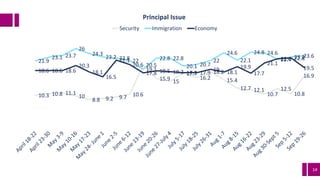
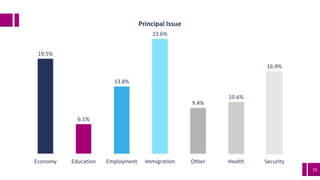
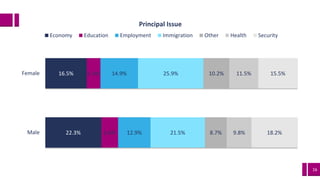
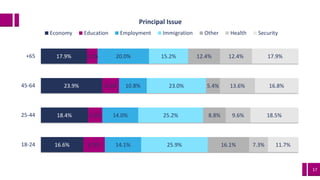
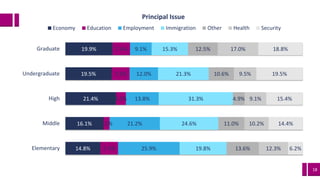

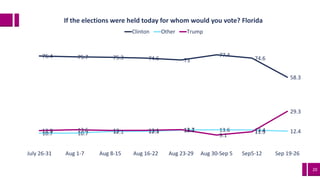
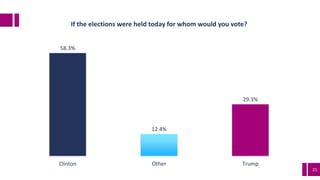
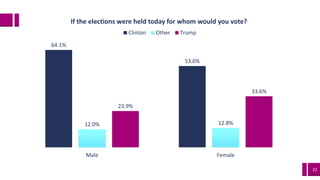
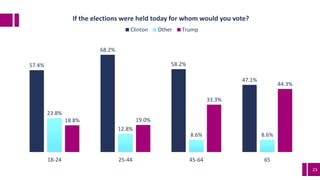

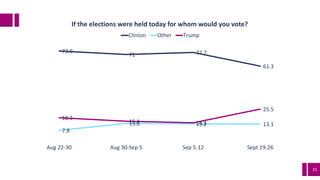
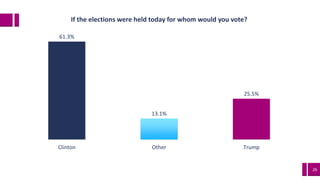
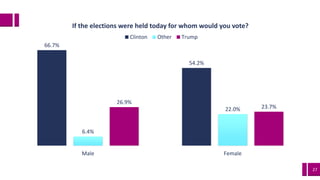
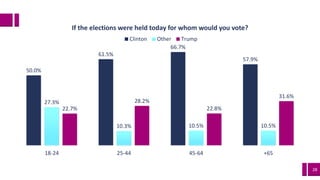


Adsmovil conducted a polling survey from September 19-26, 2016, targeting Latino respondents nationwide as part of a joint effort with FIU's School of International and Public Affairs. The survey aimed to gauge public opinion on the 2016 presidential election, revealing significant support for Clinton among respondents. Over 200,000 Latinos participated in the initiative, known as 'The New Latino Voice,' further analyzing critical issues like economy, education, and immigration.


