Download as PDF, PPTX

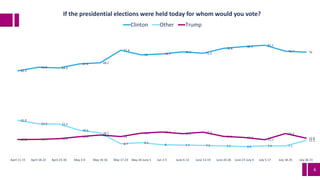
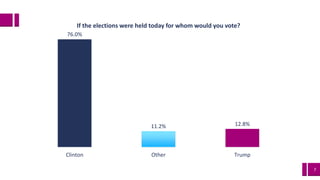
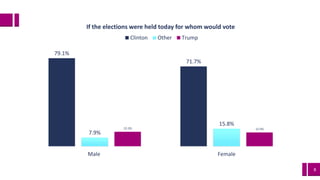
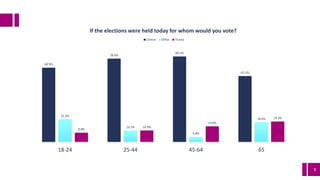

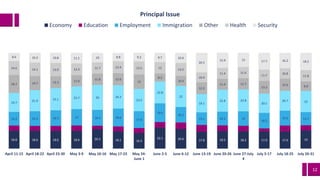
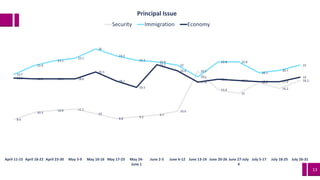
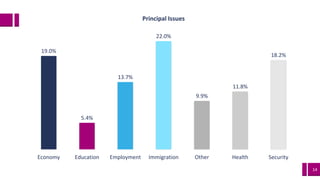
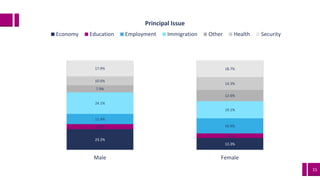
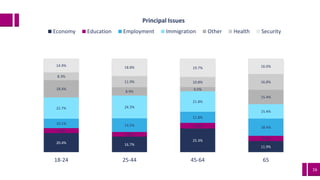
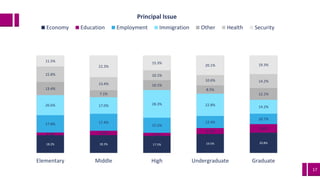

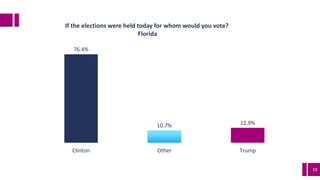
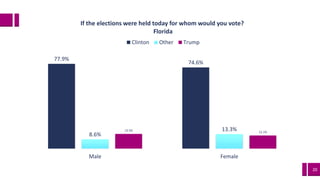
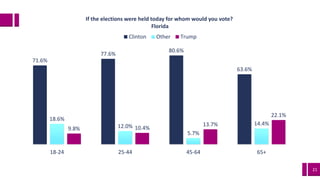
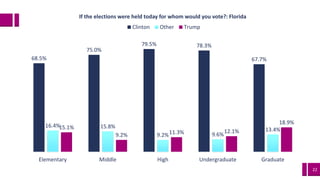


The document reports on a mobile tracking poll conducted by Adsmóvil targeting Latino voters from July 26 to July 31, 2016, in partnership with FIU’s School of International and Public Affairs. The survey indicates strong support for Hillary Clinton among Latino voters, with 76.4% backing her compared to 12.9% for Donald Trump within Florida. Additionally, it discusses the methodology and principal issues affecting voters, highlighting concerns on economy, immigration, and education.


![Campaigning to the New American Electorate [PDF]](https://cdn.slidesharecdn.com/ss_thumbnails/894e877c-ef74-4c67-88dc-12cbbede3d51-160803023203-thumbnail.jpg?width=640&height=640&fit=bounds)


