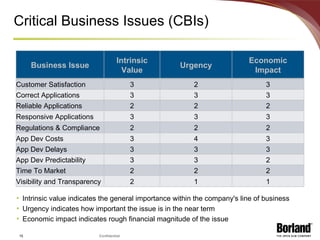
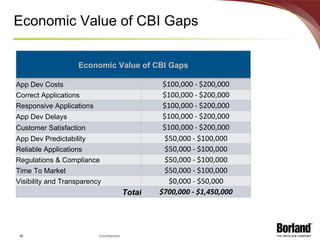
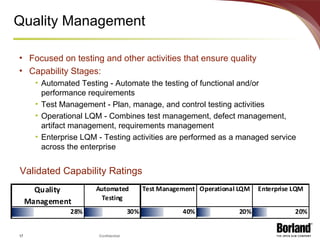
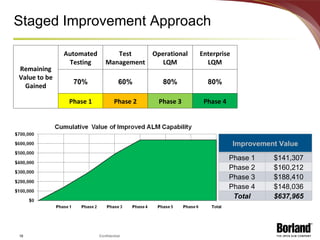
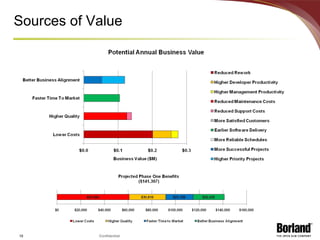
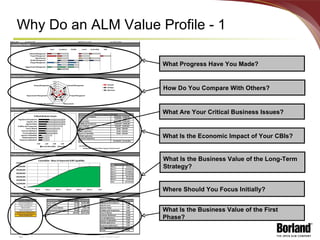
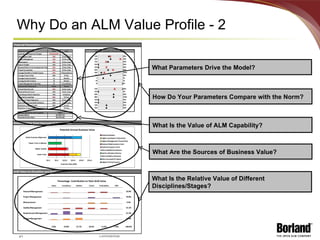
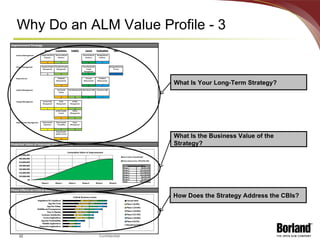
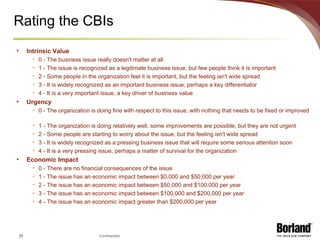
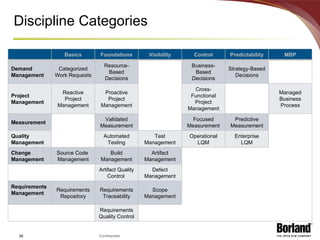
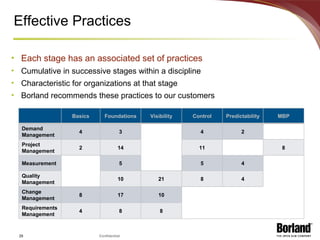
Profiling the Economic Value of Lifecycle Quality Management David Reo
Agenda The ALM Value Path Sources of ALM Value Profiling the Potential Value of Improving LQM in a Financial Organization ALM – Application Lifecycle Management LQM – Lifecycle Quality Management
The Borland Focus © 2008 Borland Software Corporation Open ALM Vision  To transform software delivery into a managed business process leveraging  your  methods and  your  tools
Borland Framework for ALM Transformation Already Achieved Value Received What it’s Worth How to Get There Software Delivery Managed Business Process ALM Value Path ALM Value Lower Costs Higher Quality Faster Time to Market Better Alignment ALM Capability Transparent Effective Analytical Quality-Drive n Where You Want To Be
ALM Capability Roadmap Transforming Software Delivery into a Managed Business Process Transparent, Effective, Analytical, Quality-Driven Six Disciplines Demand Management, Project Management Measurement Quality Management, Change Management, Requirements Management  Six Stages Coordinated improvement in capabilities Dependencies and integration points Effective Practices Associated with each discipline and each stage Identified as Traditional, Agile, or Both
ALM Capability Roadmap Managed Business Process Management Decisions Practitioner Activities Information Demand Management Project Management Measurement Quality Management Change Management Requirements Management
Capability Stages Managed Business Process Foundation Visibility Control Predictability Basics Demand Management Project Management Measurement Quality Management Change Management Requirements Management
ALM Value Lower Costs Reduced development costs Increased developer productivity Increased management productivity Higher Quality Reduced maintenance costs Reduced support costs More satisfied customers Faster Time to Market Earlier delivery Better Business Alignment More reliable schedules More successful projects Higher priority projects
Software Cost and Value Model Development Costs Maintenance Costs Application Lifecycle Time Line Maintenance Costs Value of Application Lost Value Value of Application Development Costs Failed Projects Release Start of Project Actual Release Planned Release End of Use
Lower Costs Development Costs Maintenance Costs Application Lifecycle Time Line Maintenance Costs Value of Application Lost Value Value of Application Development Costs Failed Projects Release Start of Project Actual Release Planned Release End of Use Reduced Rework Higher Developer Productivity  Higher Management Productivity
Higher Quality Development Costs Maintenance Costs Application Lifecycle Time Line Maintenance Costs Value of Application Lost Value Value of Application Development Costs Failed Projects Release Start of Project Actual Release Planned Release End of Use Reduced Maintenance Costs Reduced Support Costs More Satisfied Customers
Faster Time to Market Development Costs Maintenance Costs Application Lifecycle Time Line Maintenance Costs Value of Application Lost Value Value of Application Development Costs Failed Projects Release Start of Project Actual Release Planned Release End of Use Earlier Delivery
Better Business Alignment Development Costs Maintenance Costs Application Lifecycle Time Line Maintenance Costs Value of Application Lost Value Value of Application Development Costs Failed Projects Release Start of Project Actual Release Planned Release End of Use Higher Priority Projects More Reliable Schedules More Successful Projects
LQM Profile - Example Company Demographics IT Department – Financial sector Staff of 78 dedicated to software development Annual IT budget of $5.85M Participants IT Director SW Development Manager Quality Manager Profile Scope Organization: Projects that represent 80% of overall development effort Disciplines: Quality Management
Critical Business Issues (CBIs) Intrinsic value indicates the general importance within the company's line of business  Urgency indicates how important the issue is in the near term  Economic impact indicates rough financial magnitude of the issue Business Issue Intrinsic Value Urgency Economic Impact Customer Satisfaction 3 2 3 Correct Applications 3 3 3 Reliable Applications 2 2 2 Responsive Applications 3 3 3 Regulations & Compliance 2 2 2 App Dev Costs 3 4 3 App Dev Delays 3 3 3 App Dev Predictability 3 3 2 Time To Market 2 2 2 Visibility and Transparency 2 1 1
Economic Value of CBI Gaps Economic Value of CBI Gaps App Dev Costs $100,000 - $200,000 Correct Applications $100,000 - $200,000 Responsive Applications $100,000 - $200,000 App Dev Delays $100,000 - $200,000 Customer Satisfaction $100,000 - $200,000 App Dev Predictability $50,000 - $100,000 Reliable Applications $50,000 - $100,000 Regulations & Compliance $50,000 - $100,000 Time To Market $50,000 - $100,000 Visibility and Transparency $0,000 - $50,000 Total $700,000 - $1,450,000
Quality Management Focused on testing and other activities that ensure quality Capability Stages: Automated Testing - Automate the testing of functional and/or performance requirements Test Management - Plan, manage, and control testing activities Operational LQM - Combines test management, defect management, artifact management, requirements management Enterprise LQM - Testing activities are performed as a managed service across the enterprise Validated Capability Ratings
Staged Improvement Approach Improvement Value Phase 1 $141,307 Phase 2 $160,212 Phase 3 $188,410 Phase 4 $148,036 Total $637,965 Remaining Value to be Gained Automated Testing Test Management Operational LQM Enterprise LQM 70% 60% 80% 80% Phase 1 Phase 2 Phase 3 Phase 4
Sources of Value
Why Do an ALM Value Profile - 1 What Progress Have You Made? How Do You Compare With Others? What Is the Business Value of the Long-Term Strategy? Where Should You Focus Initially? What Are Your Critical Business Issues? What Is the Economic Impact of Your CBIs? What Is the Business Value of the First Phase?
Why Do an ALM Value Profile - 2 What Parameters Drive the Model? How Do Your Parameters Compare with the Norm? What Are the Sources of Business Value? What Is the Relative Value of Different Disciplines/Stages? What Is the Value of ALM Capability?
Why Do an ALM Value Profile - 3 What Is Your Long-Term Strategy? What Is the Business Value of the Strategy? How Does the Strategy Address the CBIs?
Why Do an ALM Value Profile - 4 Albert Einstein (1879 - 1955) “ Insanity: doing the same thing over and over again and expecting different results.  ” What’s the cost of maintaining the status quo, the cost of doing nothing?
Questions Copyright © 2007 Borland Software Corporation.
Thank You David A. Reo Consulting Services Manager Spain, Portugal & Italy C/ Ribera del Loira, 46 28042 – MADRID (Spain) t   +34 915 030 632 m  +34 659 756 165 f   +34 946 773 729 [email_address]
Back up Slides Copyright © 2007 Borland Software Corporation.
Rating the CBIs Intrinsic Value  0 - The business issue really doesn't matter at all   1 - The issue is recognized as a legitimate business issue, but few people think it is important   2 - Some people in the organization feel it is important, but the feeling isn't wide spread   3 - It is widely recognized as an important business issue, perhaps a key differentiator   4 - It is a very important issue, a key driver of business value   Urgency  0 - The organization is doing fine with respect to this issue, with nothing that needs to be fixed or improved   1 - The organization is doing relatively well, some improvements are possible, but they are not urgent   2 - Some people are starting to worry about the issue, but the feeling isn't wide spread   3 - It is widely recognized as a pressing business issue that will require some serious attention soon   4 - It is a very pressing issue, perhaps a matter of survival for the organization   Economic Impact  0 - There are no financial consequences of the issue   1 - The issue has an economic impact between $0,000 and $50,000 per year   2 - The issue has an economic impact between $50,000 and $100,000 per year   3 - The issue has an economic impact between $100,000 and $200,000 per year   4 - The issue has an economic impact greater than $200,000 per year
Discipline Categories Basics Foundations Visibility Control Predictability MBP Demand Management Categorized Work Requests Resource-Based Decisions Business-Based Decisions Strategy-Based Decisions Project Management Reactive Project Management Proactive Project Management Cross-Functional Project Management Managed Business Process Measurement Validated Measurement Focused Measurement Predictive Measurement Quality Management Automated Testing Test Management Operational LQM Enterprise LQM Change Management Source Code  Management Build Management Artifact Management Artifact Quality Control  Defect Management Requirements Management Requirements Repository Requirements Traceability Scope Management Requirements Quality Control
Effective Practices Each stage has an associated set of practices Cumulative in successive stages within a discipline Characteristic for organizations at that stage Borland recommends these practices to our customers Basics Foundations Visibility Control Predictability MBP Demand Management 4 3 4 2 Project Management 2 14 11 8 Measurement 5 5 4 Quality Management 10 21 8 4 Change Management 8 17 10 Requirements Management 4 8 8
Customer Inputs The only value we need from the customer is the annual development budget Customer Inputs Normative Value Range Guidelines Annual development budget X Annual budget for developers 60% of dev budget 40%-75% Annual budget for project managers 15% of dev budget 10%-20% Annual maintenance budget 25% of dev budget 15%-30%% Annual support budget 10% of dev budget 10%-40% Expected return from development projects 10% per benefit year 10%-40% Could use gross profit margin Project success rate 70% 40%-90% Average shortfall for failed projects 30% 20%-100% Average project delay 20% 0%-40% Planned project duration 12 months 6 mo – 36 mo Benefit duration 3 years 2 yr – 5 yr PM effort on reporting/communication 20 hrs/week 10 hr – 20 hr We have normative values for all of the other customer inputs Calculations are all done relative to “annual spend,” which includes new product and new feature development, but not maintenance Customer budgets are often given including maintenance.  The calculator takes this difference into account.
Improvement Parameters Customer Inputs Normative Value Range Source Current rework level 40% 10%-40%% CMMI Study Potential rework level 10% 0%-10% CMMI Study Post-Release Defect reduction 75% 50%-90% CMMI Study Potential Success Rate 90% 80%-100% Gain from Project Alignment 10% 10%-30% Forrester PMM Study Gain from better staff utilization 10% 10%-30% Forrester PMM Study Reduction in actual support costs 20% 10%-40% Forrester PMM Study Reduction in reporting/communication effort 30% 20%-50% Borland Case Study We have normative values for all of the improvement parameters
Normative Calculation This is the “Total ALM Value” – assuming the customer goes from nothing to full ALM in one step ALM Value Factor Normative Calculation Lower Costs Reduced Rework 30.0% Higher Developer Productivity 8.0% Higher Management Productivity 3.0% Subtotal 41.0% Higher Quality Reduced Maintenance Costs 18.8% Reduced Support Costs 2.0% More Satisfied Customers - Subtotal 20.8% Faster Time to Market Earlier Software Delivery 15.6% Subtotal 15.6% Greater Alignment More Reliable Schedules - More Successful Projects 7.8% Higher Priority Projects 10.0% Subtotal 17.8% Total (% of Annual Development Budget) 95%
How Does This Relate to the CMMI? The ALM Capability Roadmap is completely consistent with the CMMI None of the practices contradict those of the CMMI The sequencing is similar The ALM Capability Roadmap focuses on business value The most successful CMMI initiatives have focused on business value The ALM Capability Roadmap is flexible and adaptable ALM Value Path is unique for each customer The ALM Capability Roadmap is practical Stages typically require six to twelve months We have one customer for whom we have done both a CMMI appraisal and an ALM Value Profile, and the results were comparable

9 Borland Solo Pruebas 2009

  • 1.
    Profiling the EconomicValue of Lifecycle Quality Management David Reo
  • 2.
    Agenda The ALMValue Path Sources of ALM Value Profiling the Potential Value of Improving LQM in a Financial Organization ALM – Application Lifecycle Management LQM – Lifecycle Quality Management
  • 3.
    The Borland Focus© 2008 Borland Software Corporation Open ALM Vision To transform software delivery into a managed business process leveraging your methods and your tools
  • 4.
    Borland Framework forALM Transformation Already Achieved Value Received What it’s Worth How to Get There Software Delivery Managed Business Process ALM Value Path ALM Value Lower Costs Higher Quality Faster Time to Market Better Alignment ALM Capability Transparent Effective Analytical Quality-Drive n Where You Want To Be
  • 5.
    ALM Capability RoadmapTransforming Software Delivery into a Managed Business Process Transparent, Effective, Analytical, Quality-Driven Six Disciplines Demand Management, Project Management Measurement Quality Management, Change Management, Requirements Management Six Stages Coordinated improvement in capabilities Dependencies and integration points Effective Practices Associated with each discipline and each stage Identified as Traditional, Agile, or Both
  • 6.
    ALM Capability RoadmapManaged Business Process Management Decisions Practitioner Activities Information Demand Management Project Management Measurement Quality Management Change Management Requirements Management
  • 7.
    Capability Stages ManagedBusiness Process Foundation Visibility Control Predictability Basics Demand Management Project Management Measurement Quality Management Change Management Requirements Management
  • 8.
    ALM Value LowerCosts Reduced development costs Increased developer productivity Increased management productivity Higher Quality Reduced maintenance costs Reduced support costs More satisfied customers Faster Time to Market Earlier delivery Better Business Alignment More reliable schedules More successful projects Higher priority projects
  • 9.
    Software Cost andValue Model Development Costs Maintenance Costs Application Lifecycle Time Line Maintenance Costs Value of Application Lost Value Value of Application Development Costs Failed Projects Release Start of Project Actual Release Planned Release End of Use
  • 10.
    Lower Costs DevelopmentCosts Maintenance Costs Application Lifecycle Time Line Maintenance Costs Value of Application Lost Value Value of Application Development Costs Failed Projects Release Start of Project Actual Release Planned Release End of Use Reduced Rework Higher Developer Productivity Higher Management Productivity
  • 11.
    Higher Quality DevelopmentCosts Maintenance Costs Application Lifecycle Time Line Maintenance Costs Value of Application Lost Value Value of Application Development Costs Failed Projects Release Start of Project Actual Release Planned Release End of Use Reduced Maintenance Costs Reduced Support Costs More Satisfied Customers
  • 12.
    Faster Time toMarket Development Costs Maintenance Costs Application Lifecycle Time Line Maintenance Costs Value of Application Lost Value Value of Application Development Costs Failed Projects Release Start of Project Actual Release Planned Release End of Use Earlier Delivery
  • 13.
    Better Business AlignmentDevelopment Costs Maintenance Costs Application Lifecycle Time Line Maintenance Costs Value of Application Lost Value Value of Application Development Costs Failed Projects Release Start of Project Actual Release Planned Release End of Use Higher Priority Projects More Reliable Schedules More Successful Projects
  • 14.
    LQM Profile -Example Company Demographics IT Department – Financial sector Staff of 78 dedicated to software development Annual IT budget of $5.85M Participants IT Director SW Development Manager Quality Manager Profile Scope Organization: Projects that represent 80% of overall development effort Disciplines: Quality Management
  • 15.
    Critical Business Issues(CBIs) Intrinsic value indicates the general importance within the company's line of business Urgency indicates how important the issue is in the near term Economic impact indicates rough financial magnitude of the issue Business Issue Intrinsic Value Urgency Economic Impact Customer Satisfaction 3 2 3 Correct Applications 3 3 3 Reliable Applications 2 2 2 Responsive Applications 3 3 3 Regulations & Compliance 2 2 2 App Dev Costs 3 4 3 App Dev Delays 3 3 3 App Dev Predictability 3 3 2 Time To Market 2 2 2 Visibility and Transparency 2 1 1
  • 16.
    Economic Value ofCBI Gaps Economic Value of CBI Gaps App Dev Costs $100,000 - $200,000 Correct Applications $100,000 - $200,000 Responsive Applications $100,000 - $200,000 App Dev Delays $100,000 - $200,000 Customer Satisfaction $100,000 - $200,000 App Dev Predictability $50,000 - $100,000 Reliable Applications $50,000 - $100,000 Regulations & Compliance $50,000 - $100,000 Time To Market $50,000 - $100,000 Visibility and Transparency $0,000 - $50,000 Total $700,000 - $1,450,000
  • 17.
    Quality Management Focusedon testing and other activities that ensure quality Capability Stages: Automated Testing - Automate the testing of functional and/or performance requirements Test Management - Plan, manage, and control testing activities Operational LQM - Combines test management, defect management, artifact management, requirements management Enterprise LQM - Testing activities are performed as a managed service across the enterprise Validated Capability Ratings
  • 18.
    Staged Improvement ApproachImprovement Value Phase 1 $141,307 Phase 2 $160,212 Phase 3 $188,410 Phase 4 $148,036 Total $637,965 Remaining Value to be Gained Automated Testing Test Management Operational LQM Enterprise LQM 70% 60% 80% 80% Phase 1 Phase 2 Phase 3 Phase 4
  • 19.
  • 20.
    Why Do anALM Value Profile - 1 What Progress Have You Made? How Do You Compare With Others? What Is the Business Value of the Long-Term Strategy? Where Should You Focus Initially? What Are Your Critical Business Issues? What Is the Economic Impact of Your CBIs? What Is the Business Value of the First Phase?
  • 21.
    Why Do anALM Value Profile - 2 What Parameters Drive the Model? How Do Your Parameters Compare with the Norm? What Are the Sources of Business Value? What Is the Relative Value of Different Disciplines/Stages? What Is the Value of ALM Capability?
  • 22.
    Why Do anALM Value Profile - 3 What Is Your Long-Term Strategy? What Is the Business Value of the Strategy? How Does the Strategy Address the CBIs?
  • 23.
    Why Do anALM Value Profile - 4 Albert Einstein (1879 - 1955) “ Insanity: doing the same thing over and over again and expecting different results. ” What’s the cost of maintaining the status quo, the cost of doing nothing?
  • 24.
    Questions Copyright ©2007 Borland Software Corporation.
  • 25.
    Thank You DavidA. Reo Consulting Services Manager Spain, Portugal & Italy C/ Ribera del Loira, 46 28042 – MADRID (Spain) t +34 915 030 632 m +34 659 756 165 f +34 946 773 729 [email_address]
  • 26.
    Back up SlidesCopyright © 2007 Borland Software Corporation.
  • 27.
    Rating the CBIsIntrinsic Value 0 - The business issue really doesn't matter at all 1 - The issue is recognized as a legitimate business issue, but few people think it is important 2 - Some people in the organization feel it is important, but the feeling isn't wide spread 3 - It is widely recognized as an important business issue, perhaps a key differentiator 4 - It is a very important issue, a key driver of business value Urgency 0 - The organization is doing fine with respect to this issue, with nothing that needs to be fixed or improved 1 - The organization is doing relatively well, some improvements are possible, but they are not urgent 2 - Some people are starting to worry about the issue, but the feeling isn't wide spread 3 - It is widely recognized as a pressing business issue that will require some serious attention soon 4 - It is a very pressing issue, perhaps a matter of survival for the organization Economic Impact 0 - There are no financial consequences of the issue 1 - The issue has an economic impact between $0,000 and $50,000 per year 2 - The issue has an economic impact between $50,000 and $100,000 per year 3 - The issue has an economic impact between $100,000 and $200,000 per year 4 - The issue has an economic impact greater than $200,000 per year
  • 28.
    Discipline Categories BasicsFoundations Visibility Control Predictability MBP Demand Management Categorized Work Requests Resource-Based Decisions Business-Based Decisions Strategy-Based Decisions Project Management Reactive Project Management Proactive Project Management Cross-Functional Project Management Managed Business Process Measurement Validated Measurement Focused Measurement Predictive Measurement Quality Management Automated Testing Test Management Operational LQM Enterprise LQM Change Management Source Code Management Build Management Artifact Management Artifact Quality Control Defect Management Requirements Management Requirements Repository Requirements Traceability Scope Management Requirements Quality Control
  • 29.
    Effective Practices Eachstage has an associated set of practices Cumulative in successive stages within a discipline Characteristic for organizations at that stage Borland recommends these practices to our customers Basics Foundations Visibility Control Predictability MBP Demand Management 4 3 4 2 Project Management 2 14 11 8 Measurement 5 5 4 Quality Management 10 21 8 4 Change Management 8 17 10 Requirements Management 4 8 8
  • 30.
    Customer Inputs Theonly value we need from the customer is the annual development budget Customer Inputs Normative Value Range Guidelines Annual development budget X Annual budget for developers 60% of dev budget 40%-75% Annual budget for project managers 15% of dev budget 10%-20% Annual maintenance budget 25% of dev budget 15%-30%% Annual support budget 10% of dev budget 10%-40% Expected return from development projects 10% per benefit year 10%-40% Could use gross profit margin Project success rate 70% 40%-90% Average shortfall for failed projects 30% 20%-100% Average project delay 20% 0%-40% Planned project duration 12 months 6 mo – 36 mo Benefit duration 3 years 2 yr – 5 yr PM effort on reporting/communication 20 hrs/week 10 hr – 20 hr We have normative values for all of the other customer inputs Calculations are all done relative to “annual spend,” which includes new product and new feature development, but not maintenance Customer budgets are often given including maintenance. The calculator takes this difference into account.
  • 31.
    Improvement Parameters CustomerInputs Normative Value Range Source Current rework level 40% 10%-40%% CMMI Study Potential rework level 10% 0%-10% CMMI Study Post-Release Defect reduction 75% 50%-90% CMMI Study Potential Success Rate 90% 80%-100% Gain from Project Alignment 10% 10%-30% Forrester PMM Study Gain from better staff utilization 10% 10%-30% Forrester PMM Study Reduction in actual support costs 20% 10%-40% Forrester PMM Study Reduction in reporting/communication effort 30% 20%-50% Borland Case Study We have normative values for all of the improvement parameters
  • 32.
    Normative Calculation Thisis the “Total ALM Value” – assuming the customer goes from nothing to full ALM in one step ALM Value Factor Normative Calculation Lower Costs Reduced Rework 30.0% Higher Developer Productivity 8.0% Higher Management Productivity 3.0% Subtotal 41.0% Higher Quality Reduced Maintenance Costs 18.8% Reduced Support Costs 2.0% More Satisfied Customers - Subtotal 20.8% Faster Time to Market Earlier Software Delivery 15.6% Subtotal 15.6% Greater Alignment More Reliable Schedules - More Successful Projects 7.8% Higher Priority Projects 10.0% Subtotal 17.8% Total (% of Annual Development Budget) 95%
  • 33.
    How Does ThisRelate to the CMMI? The ALM Capability Roadmap is completely consistent with the CMMI None of the practices contradict those of the CMMI The sequencing is similar The ALM Capability Roadmap focuses on business value The most successful CMMI initiatives have focused on business value The ALM Capability Roadmap is flexible and adaptable ALM Value Path is unique for each customer The ALM Capability Roadmap is practical Stages typically require six to twelve months We have one customer for whom we have done both a CMMI appraisal and an ALM Value Profile, and the results were comparable