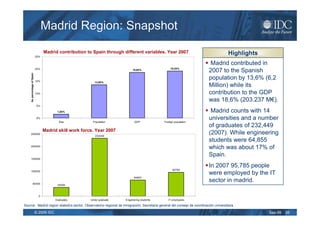
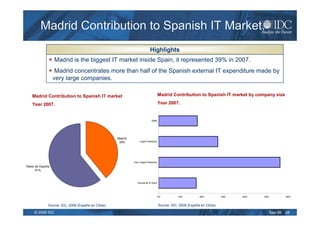
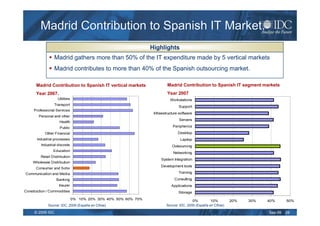
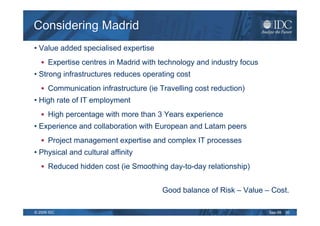
“Madrid as your IT sourcing
location”

Fernando Maldonado
Program Manager
IDC Spain
                                                                                  This Presentation is based on IDC WP:
                                                                                   Closer To Home: Could Spain be Your
                                                                                       Preferred Sourcing Destination

                                                                                                    Source: IDC 2008
                                                                                        Sponsored by: AEC (Spanish Association of Consulting Firms)

Copyright 2009 IDC. Reproduction is forbidden unless authorized. All rights reserved.
Agenda

1. A few words about IDC
2. The Spanish IT Services Market Overview
3. Why Nearshore?
4. Spain emerges as a credible Nearshore destination
5. Madrid unique value proposition


© 2009 IDC                                             Sep-09   2
IDC Overview
 IDC is the premier independent global market
 intelligence, events, and advisory firm for information
 technology, telecommunications, and consumer
 technology markets (ICT)

 More than 1,000 IDC analysts provide global, regional,
 and local expertise on technology and industry
 opportunities and trends in over 110 countries

 We have been delivering IT intelligence, industry
 analysis, market data, and strategic guidance since
 1964

 Our multilingual, multicultural workforce surveys over
 250,000 technology users and decision makers
 annually, delivering unrivaled coverage

 IDC is a subsidiary of IDG, the world's leading
 technology media, research, and event company
© 2009 IDC                                                 Sep-09   3
IDC’s Global Network of Country Offices


             • 1000+ analysts providing a global information network
             • Coverage of 110 countries around the world
             • More than 44 years experience analyzing IT and
               Communications markets

© 2009 IDC                                                    Sep-09   4
IDC’s Research Assets are
Distributed Around the World

         IDC’s 1000+ analysts are located in all regions
         around the world

                            Latin America
                                 10%
                                                   North America
             Asia/Pacific                              39%
                 26%


                                        25%
                                       EMEA


© 2009 IDC                                                   Sep-09   5
Agenda

1. A few words about IDC
2. The Spanish IT Services Market Overview
3. Why Nearshore?
4. Spain emerges as a credible Nearshore destination
5. Madrid unique value proposition


© 2009 IDC                                             Sep-09   6
The Spanish IT Services Market Overview (I)

                                                                                             Highlights
        Spanish IT market is quite sensitive (Hw) to economic cycles                                                                        Cyclical
        Spanish IT Services grow at a “regular” rate                                                  Stability
        Spanish IT services are winning weight                                                    Maturity

        Spanish IT market growth. Years 1996 - 2007                                                             Spanish IT Segments weights. Years 1996 - 2007
                                                                                                             70%
  25%


                                                                                                             65%
  20%


                                                                                                             60%
  15%


                                                                                                             55%
  10%


                                                                                                             50%
   5%


                                                                                                             45%
   0%
         1996   1997   1998        1999   2000   2001   2002   2003   2004   2005   2006   2007


                                                                                                             40%
  -5%                                                                                                           1995   1996   1997   1998    1999   2000   2001   2002   2003   2004   2005   2006   2007
                                                                                                                                Hardware             Software             Services
                              IT          Hardware      Software       Services


   Source: IDC, 2008                                                                                               Source: IDC, 2008

 © 2009 IDC                                                                                                                                                                            Sep-09           7
The Spanish IT Services Market Overview (II)

                                                                                        Highlights
               Spanish IT market is wining gaining in WE IT market                                                                 5th IT market in WE.
               Spanish services market is growing faster than WE                                                                Growing Faster
               Spanish services market has more than doubled in 10 years

       Spanish IT market gaining share in WE. Years 1996 - 2007                                          Spanish services and total IT markets. Years 1996 - 2007
6,5%
                                                                                                                30.000


                                                                                                                25.000


                                                                                                                20.000


                                                                                                    Million €
5,5%
                                                                                                                15.000


                                                                                                                10.000


                                                                                                                 5.000


4,5%
                                                                                                                    0
        1995    1996   1997   1998   1999   2000   2001   2002   2003   2004   2005   2006   2007
                                                                                                                         1995   1996   1997   1998   1999   2000   2001   2002   2003   2004   2005   2006   2007


       Source: IDC, 2008                                                                                                 Source: IDC, 2008


       © 2009 IDC                                                                                                                                                                                     Sep-09        8
The Spanish IT Services Market Overview (III)

                                                                                                Highlights
          Outsourcing represents more than 1/3 of the Spanish service market.
          IS outsourcing is the biggest outsourcing market while BPO grows at a high rate.


 Spanish Service market by Submarket. Year 2007                                                             Spanish Outsourcing by type. Year 2007
   100%


   90%


                                                                                                                                            Application Management
   80%                                                                                                                                                11%
                                                                                                                                                     Hosted Application Management
                                                                                                       Network And Desktop Outsourcing
                                                                                                                                                                  1%
                                                                                                                  Services
   70%                                                                                                              27%                                   Hosted Infrastructure Services
                                                                                                                                                                       6%

   60%


   50%


   40%


   30%


   20%                                                                                                         Key Horizontal Business                 IS Outsourcing
                                                                                                                    Outsourcing                             37%
                                                                                                                        18%
   10%


    0%
                                                        2007 Total
      Outsourcing Total   Project Based Total   Support & Training   Support & Training Total


                                                                                                                        Source: IDC, 2008
           Source: IDC, 2008

 © 2009 IDC                                                                                                                                                                  Sep-09        9
Agenda

1. A few words about IDC
2. The Spanish IT Services Market Overview
3. Why Nearshore?
4. Spain emerges as a credible Nearshore destination
5. Madrid unique value proposition


© 2009 IDC                                             Sep-09   10
Setting the Stage.
New spending Priorities:
      Companies under dual pressure.
             – Lower cost of implementation
             – High level skill workers scarcity
Off-Shoring as a means to alleviate pressures
      1st wave off shoring: moving to India.
             – English speaking countries shore in India.
             – Application Management

      Competitive effect
             – Onshore providers dealing with new entrants

      Growing offshore demand
             – Moving beyond English speaking countries
             – More than Application Management
Clients seek to reduce risk
      Push a reinvention of IT services
             – So global and India-centric vendors refine Global Delivery

© 2009 IDC                                                                  Sep-09   11
Understanding Global Delivery


      Integrating rich domain expertise, broad technical
      skills, and project management discipline across a
      network of low-cost locations through consistent and
      robust processes, tools, and infrastructure to maximize
      the timely delivery of superior IT and BPO solutions

                               Highlights

      Yes, really is as complex as it sounds!
      No, it is not just about labour arbitrage anymore.

© 2009 IDC                                                      Sep-09   12
Origin of IT Services Import to EMEA 2007

                                                                   Highlights
                                                India      EMEA import IT services over
                                              $6,129M     7.5 Billion $.
                                                           India represents more than
                    EMEA imported                         80% of the imports.
                    $7,758M
                    in IT services from                    IDC estimates that in 2007
                    offshore companies                    India exports to EMEA grew
                    in 2007                        CEE    for about 50%
                                                  $248M
                                                           An increasing number of
                                                          companies were using in 2007
                                                          Off Shore service providers.


                      ROW
                     $335M                China
                                          $76M


Source: IDC, 2007

  © 2009 IDC                                                                       Sep-09   13
Why Nearshore? Cost
(Focus on India)

Rising attrition, wage inflation and skill shortages
      A victim of its own success, even in a recession
Indian skills lose their shine and quality dips
      More work, higher churn, less seniority
Customer issues challenge effective communication
      Language really and working culture
Service quality suffers from poor communication
      Deals don’t reflect cultural issues
Internal business stakeholders put up resistance

© 2009 IDC                                               Sep-09   14
Why Nearshore? Risk
(Focus India)


External risks                                                    External risks
                    External risks compound internal risks
 Time zone          • Lack of governance                             Vendor
 differences        • Lack of management                             stability
                    • Weak IT processes/outsourcing process
                      maturity (requirements gathering, change    Cultural and
   Country                                                         language
                      management, specification writing,
infrastructure                                                    differences
                      testing/QA, SLAs, documentation)
                    • Internal customers unprepared for the
Management            rigidity of the outsourcing relationship
 challenges         • Improper project selection                  Governance
                    • Unrealistic expectations
                    • No recognition that vendors lack business
   Security           knowledge                                    Distance to
                                                                     vendor

Source: IDC, 2009


© 2009 IDC                                                                Sep-09   15
Why Nearshore? Value

Skill levels and skill maturity
     European organizations evaluate, over all, a service
     provider by the quality of its people.
Vertical experience
     European organizations expect deep industry experience in
     search of developing solutions that might provide
     competitive advantage.
Transformational outsourcing
     More than just cost reduction now helping to transform the
     business.


© 2009 IDC                                                        Sep-09   16
Choice of Offshore Location
                                                                            Highlights
    Easter europe is the overall preferred location.
    Other category includes geographies such Spain and North Africa.
    Nearshore locations close to 50% of preferred locations.

                                  European preferred Offshore destination
                            40%
       (% of respondents)


                            30%


                            20%


                            10%


                             0%
                                     Eastern Europe                 India        China   Other


                            Note: N(2008)=381
                            Source: IDC's European Services Survey, 2008


© 2009 IDC                                                                                       Sep-09   17
European Firms Seek Nearshore Skills

   Some countries are more mature than others

             Mature nearshore delivery hubs in Eastern Europe

             Russia rich in software development expertise

             Spanish industry expertise
   Many European service providers focused on Poland

             Pure plays have gone further East
   What counts in deciding a nearshore location

             Country stability; infrastructure quality, cultural affinity and the
             quality of local labour count
   What about Spain?

© 2009 IDC                                                                          Sep-09   18
Agenda

1. Few words about IDC
2. The Spanish IT Services Market Overview
3. Why Nearshore?
4. Spain emerges as a credible Nearshore destination
5. Madrid unique value proposition


© 2009 IDC                                             Sep-09   19
Skills, Scale and Location Underpin
Spain’s Appeal
• Addressing…
      … The IT Shortage challenge.            Check out the ratios!


      … The value / cost trade off

      … The value of industry experience


• EU Member
      Regulation (ie. Security concerns)
• Potential to scale with Latin America
      Spain/Latin American delivery model offering skilled pool


© 2009 IDC                                                            Sep-09   20
Addressing the IT Skill Shortage
Challenge
Number of graduates in sciences, math…Year 2007              Highlights
                                                   Spain more than doubles Poland
                                                  number of Science graduates.
                               70% under 45
                                                   Looking at the long term… A high
                                                  percentage of Spanish graduates are
                                                  under 45 years old.


      Source: Eurostat, 2009

© 2009 IDC                                                                          Sep-09   21
Addressing the Value/ Cost Trade-off
   Spanish IT labor cost. Year 2007
                                                                                               Highlights
        Denmark

         Sweden                                                                  Spain has a lower cost than western
        Germany                                                                  Europe…
          Norway
                                                                                  … while remaining competitive with
      Netherlands
                                                                                 eastern europe.
          Finland

          France                                                                 Spain ranks in between Austria and
         Belgium                                                                 Greece.
  United Kingdom
                                                                                  Nordics have the most expensive
          Ireland
                                                                                 human resources.
             Italy

          Austria                                                                 Ireland and Italy are more expensive
           Spain                                                                 than Spain.
          Greece

   Czech Republic

         Hungary

        Romania

          Poland

                     0    10.000   20.000    30.000   40.000   50.000   60.000

                         Experienced (5 - 9 year experience)
                         Juniors (1 - 4 year experience)
Source: IDC, 2009

  © 2009 IDC                                                                                                           Sep-09   22
The Value of Industry Experience

 Spanish Industry experience. Year 2007.                                              Highlights
                                                                          Spain enjoys high level of experience
  O. Verticals
                                                                         in the main vertical sectors.
                                                                          Consultants with more than 3 years
     Telecom                                                             experience form the largest segments,
                                                                         followed by analyst and senior
                                                                         consultants
 Government
                                                                          Finance lead the way in experience at
                                                                         all levels: Analysts, consultants, etc.
      Utilities
                                                                          Telco and manufacturing surpass
                                                                         10,000 skilled resources in Spain.
Manufacturing


     Finance


                  0   5.000     10.000      15.000     20.000   25.000
                      Analysts       (Finance)
                      Consultant (+3 Years experience)
                      Senior Consultant (+4 Years experience)
                      Manager (+5 Years experience)
                      Partner
           Source: IDC, 2009

© 2009 IDC                                                                                                    Sep-09   23
Considering Spain

1. Valued Skills in a low-risk environment at a competitive
   cost.
2. Ability to source the right skills for specific tasks from the
   preferred locations for commoditized projects.
3. Vertical expertise, length of experience in innovation in the
   market, and global best practices.
4. Investments by established service providers, attractiveness
   of IT sector (influences future availability of skills)
5. Common environment: similar practices, vertical maturity,
   EU regulations, etc.
6. Cultural affinity between Spain and the rest of Europe as
   opposition to the cultural issues raised by offshore projects.


© 2009 IDC                                                     Sep-09   24
Agenda

1. Few words about IDC
2. The Spanish IT Services Market Overview
3. Firms move nearshore to solve offshore issues
4. Spain emerges as a credible nearshore destination
5. Madrid unique value proposition.


© 2009 IDC                                             Sep-09   25
Madrid Region: Snapshot
                                   Madrid contribution to Spain through different variables. Year 2007                                  Highlights
                             25%

                                                                                                                            Madrid contributed in
                                                                                                      19,20%
                             20%                                               18,60%
                                                                                                                           2007 to the Spanish
    As percentage of Spain


                             15%
                                                                                                                           population by 13,6% (6,2
                                                            13,60%
                                                                                                                           Million) while its
                             10%                                                                                           contribution to the GDP
                                                                                                                           was 18,6% (203.237 M€).
                              5%

                                           1,60%                                                                            Madrid counts with 14
                              0%                                                                                           universities and a number
                                            Size          Population             GDP             Foreign population
                                                                                                                           of graduates of 232,449
                                   Madrid skill work force. Year 2007
    250000
                                                            232449
                                                                                                                           (2007). While engineering
                                                                                                                           students were 64,855
    200000
                                                                                                                           which was about 17% of
                                                                                                                           Spain.
    150000

                                                                                                                           In 2007 95,785 people
                                                                                                       95785
    100000
                                                                                                                           were employed by the IT
                                                                                64857

                50000
                                                                                                                           sector in madrid.
                                           35000


                               0
                                          Graduates      Under graduate   Engeniering students      IT employees

Source: Madrid region statistics sector, Observatorio regional de inmigración, Secretaria general del consejo de coordinación universitaria.

                             © 2009 IDC                                                                                                              Sep-09   26
Check List When Considering a Location

                                                   Economic and Political Factors
      Resources Skill Factors                      • Political Commitment
      • Education Levels                           • Regulatory Environment
      • Language Proficiency                       • Intellectual Property Protection
      • Resource Availability                      • Economy
      • Work Culture

                                                                                        Financial Factors
                                                                                        • Compensation
                                                                                        • Tax and Country-Specific Costs
                                                           Check out the ratios!
                                                                                        • Fixed Costs and Variable Costs
                                      IT industry Itself


             Infrastructure Factors
             • ICT Infrastructure               Business and Regional Factors
             • Transportation                   • Location
                                                • Employee Acquisition and Dismissal
                                                • Market Experience
                                                • Real Estate


© 2009 IDC                                                                                                  Sep-09   27
Madrid Contribution to Spanish IT Market.
                                                                            Highlights
                  Madrid is the biggest IT market inside Spain, it represented 39% in 2007.
                   Madrid concentrates more than half of the Spanish external IT expenditure made by
                  very large companies.

   Madrid Contribution to Spanish IT market                                           Madrid Contribution to Spanish IT market by company size

   Year 2007.                                                                         Year 2007.


                                                                              SMB


                                                     Madrid
                                                      39%          Large Enterprise


                                                              Very Large Enterprise
Resto de España
      61%


                                                                 Consumer & Soho


                                                                                      0%          10%          20%           30%   40%   50%            60%


              Source: IDC, 2008 (España en Cifras)                                    Source: IDC, 2008 (España en Cifras)

     © 2009 IDC                                                                                                                                Sep-09   28
Madrid Contribution to Spanish IT Market.
                                                                              Highlights
                               Madrid gathers more than 50% of the IT expenditure made by 5 vertical markets
                               Madrid contributes to more than 40% of the Spanish outsourcing market.

                   Madrid Contribution to Spanish IT vertical markets                  Madrid Contribution to Spanish IT segment markets
                   Year 2007.                                                          Year 2007
                                 Utilities                                               Workstations
                               Transport
                                                                                              Support
                  Professional Services
                                                                               Infraestructure software
                     Personal and other
                                                                                              Servers
                                  Health
                                  Public                                                  Peripherics

                        Other Financial                                                       Desktop
                    Industrial processes                                                       Laptop
                      Industrial discrete                                                 Outsourcing
                              Education
                                                                                           Networking
                      Retail Distribution
                                                                                   System Integration
                 Wholesale Distribution
                                                                                   Development tools
                   Consumer and Soho
             Communication and Media                                                          Training

                                Banking                                                     Consulting
                                 Insurer                                                  Applications
Agriculture / Construction / Commodities                                                      Storage
                                             0% 10% 20% 30% 40% 50% 60% 70%                            0%         10%         20%   30%   40%      50%
                          Source: IDC, 2009 (España en Cifras)                         Source: IDC, 2009 (España en Cifras)

                  © 2009 IDC                                                                                                              Sep-09   29
Considering Madrid
• Value added specialised expertise
      Expertise centres in Madrid with technology and industry focus
• Strong infrastructures reduces operating cost
      Communication infrastructure (ie Travelling cost reduction)
• High rate of IT employment
      High percentage with more than 3 Years experience
• Experience and collaboration with European and Latam peers
      Project management expertise and complex IT processes
• Physical and cultural affinity
      Reduced hidden cost (ie Smoothing day-to-day relationship)


                                        Good balance of Risk – Value – Cost.

© 2009 IDC                                                             Sep-09   30
Agenda

1. Few words about IDC
2. The Spanish IT Services Market Overview
3. Firms move nearshore to solve offshore issues
4. Spain emerges as a credible nearshore destination
5. Madrid unique value proposition.
6. Key take away


© 2009 IDC                                             Sep-09   31
Key take away

               Global delivery is used in most large
             1 outsourcing deals


             2 European firms need Nearshore options


               Spain offers a credible Nearshore
             3
               destination

               Madrid have shown a good balance:
             4
               Cost / Risk / Value
© 2009 IDC                                             Sep-09   32
Thank You!


             Fernando Maldonado   IDC
             fmaldonado@idc.com   Plaza Colón 2
             Program Manager      28046 Madrid


             www.idc.com          www.idc.com/spain


© 2009 IDC                                            Sep-09   33

03 IDC SFIC 2009

  • 1.
    “Madrid as yourIT sourcing location” Fernando Maldonado Program Manager IDC Spain This Presentation is based on IDC WP: Closer To Home: Could Spain be Your Preferred Sourcing Destination Source: IDC 2008 Sponsored by: AEC (Spanish Association of Consulting Firms) Copyright 2009 IDC. Reproduction is forbidden unless authorized. All rights reserved.
  • 2.
    Agenda 1. A fewwords about IDC 2. The Spanish IT Services Market Overview 3. Why Nearshore? 4. Spain emerges as a credible Nearshore destination 5. Madrid unique value proposition © 2009 IDC Sep-09 2
  • 3.
    IDC Overview IDCis the premier independent global market intelligence, events, and advisory firm for information technology, telecommunications, and consumer technology markets (ICT) More than 1,000 IDC analysts provide global, regional, and local expertise on technology and industry opportunities and trends in over 110 countries We have been delivering IT intelligence, industry analysis, market data, and strategic guidance since 1964 Our multilingual, multicultural workforce surveys over 250,000 technology users and decision makers annually, delivering unrivaled coverage IDC is a subsidiary of IDG, the world's leading technology media, research, and event company © 2009 IDC Sep-09 3
  • 4.
    IDC’s Global Networkof Country Offices • 1000+ analysts providing a global information network • Coverage of 110 countries around the world • More than 44 years experience analyzing IT and Communications markets © 2009 IDC Sep-09 4
  • 5.
    IDC’s Research Assetsare Distributed Around the World IDC’s 1000+ analysts are located in all regions around the world Latin America 10% North America Asia/Pacific 39% 26% 25% EMEA © 2009 IDC Sep-09 5
  • 6.
    Agenda 1. A fewwords about IDC 2. The Spanish IT Services Market Overview 3. Why Nearshore? 4. Spain emerges as a credible Nearshore destination 5. Madrid unique value proposition © 2009 IDC Sep-09 6
  • 7.
    The Spanish ITServices Market Overview (I) Highlights Spanish IT market is quite sensitive (Hw) to economic cycles Cyclical Spanish IT Services grow at a “regular” rate Stability Spanish IT services are winning weight Maturity Spanish IT market growth. Years 1996 - 2007 Spanish IT Segments weights. Years 1996 - 2007 70% 25% 65% 20% 60% 15% 55% 10% 50% 5% 45% 0% 1996 1997 1998 1999 2000 2001 2002 2003 2004 2005 2006 2007 40% -5% 1995 1996 1997 1998 1999 2000 2001 2002 2003 2004 2005 2006 2007 Hardware Software Services IT Hardware Software Services Source: IDC, 2008 Source: IDC, 2008 © 2009 IDC Sep-09 7
  • 8.
    The Spanish ITServices Market Overview (II) Highlights Spanish IT market is wining gaining in WE IT market 5th IT market in WE. Spanish services market is growing faster than WE Growing Faster Spanish services market has more than doubled in 10 years Spanish IT market gaining share in WE. Years 1996 - 2007 Spanish services and total IT markets. Years 1996 - 2007 6,5% 30.000 25.000 20.000 Million € 5,5% 15.000 10.000 5.000 4,5% 0 1995 1996 1997 1998 1999 2000 2001 2002 2003 2004 2005 2006 2007 1995 1996 1997 1998 1999 2000 2001 2002 2003 2004 2005 2006 2007 Source: IDC, 2008 Source: IDC, 2008 © 2009 IDC Sep-09 8
  • 9.
    The Spanish ITServices Market Overview (III) Highlights Outsourcing represents more than 1/3 of the Spanish service market. IS outsourcing is the biggest outsourcing market while BPO grows at a high rate. Spanish Service market by Submarket. Year 2007 Spanish Outsourcing by type. Year 2007 100% 90% Application Management 80% 11% Hosted Application Management Network And Desktop Outsourcing 1% Services 70% 27% Hosted Infrastructure Services 6% 60% 50% 40% 30% 20% Key Horizontal Business IS Outsourcing Outsourcing 37% 18% 10% 0% 2007 Total Outsourcing Total Project Based Total Support & Training Support & Training Total Source: IDC, 2008 Source: IDC, 2008 © 2009 IDC Sep-09 9
  • 10.
    Agenda 1. A fewwords about IDC 2. The Spanish IT Services Market Overview 3. Why Nearshore? 4. Spain emerges as a credible Nearshore destination 5. Madrid unique value proposition © 2009 IDC Sep-09 10
  • 11.
    Setting the Stage. Newspending Priorities: Companies under dual pressure. – Lower cost of implementation – High level skill workers scarcity Off-Shoring as a means to alleviate pressures 1st wave off shoring: moving to India. – English speaking countries shore in India. – Application Management Competitive effect – Onshore providers dealing with new entrants Growing offshore demand – Moving beyond English speaking countries – More than Application Management Clients seek to reduce risk Push a reinvention of IT services – So global and India-centric vendors refine Global Delivery © 2009 IDC Sep-09 11
  • 12.
    Understanding Global Delivery Integrating rich domain expertise, broad technical skills, and project management discipline across a network of low-cost locations through consistent and robust processes, tools, and infrastructure to maximize the timely delivery of superior IT and BPO solutions Highlights Yes, really is as complex as it sounds! No, it is not just about labour arbitrage anymore. © 2009 IDC Sep-09 12
  • 13.
    Origin of ITServices Import to EMEA 2007 Highlights India EMEA import IT services over $6,129M 7.5 Billion $. India represents more than EMEA imported 80% of the imports. $7,758M in IT services from IDC estimates that in 2007 offshore companies India exports to EMEA grew in 2007 CEE for about 50% $248M An increasing number of companies were using in 2007 Off Shore service providers. ROW $335M China $76M Source: IDC, 2007 © 2009 IDC Sep-09 13
  • 14.
    Why Nearshore? Cost (Focuson India) Rising attrition, wage inflation and skill shortages A victim of its own success, even in a recession Indian skills lose their shine and quality dips More work, higher churn, less seniority Customer issues challenge effective communication Language really and working culture Service quality suffers from poor communication Deals don’t reflect cultural issues Internal business stakeholders put up resistance © 2009 IDC Sep-09 14
  • 15.
    Why Nearshore? Risk (FocusIndia) External risks External risks External risks compound internal risks Time zone • Lack of governance Vendor differences • Lack of management stability • Weak IT processes/outsourcing process maturity (requirements gathering, change Cultural and Country language management, specification writing, infrastructure differences testing/QA, SLAs, documentation) • Internal customers unprepared for the Management rigidity of the outsourcing relationship challenges • Improper project selection Governance • Unrealistic expectations • No recognition that vendors lack business Security knowledge Distance to vendor Source: IDC, 2009 © 2009 IDC Sep-09 15
  • 16.
    Why Nearshore? Value Skilllevels and skill maturity European organizations evaluate, over all, a service provider by the quality of its people. Vertical experience European organizations expect deep industry experience in search of developing solutions that might provide competitive advantage. Transformational outsourcing More than just cost reduction now helping to transform the business. © 2009 IDC Sep-09 16
  • 17.
    Choice of OffshoreLocation Highlights Easter europe is the overall preferred location. Other category includes geographies such Spain and North Africa. Nearshore locations close to 50% of preferred locations. European preferred Offshore destination 40% (% of respondents) 30% 20% 10% 0% Eastern Europe India China Other Note: N(2008)=381 Source: IDC's European Services Survey, 2008 © 2009 IDC Sep-09 17
  • 18.
    European Firms SeekNearshore Skills Some countries are more mature than others Mature nearshore delivery hubs in Eastern Europe Russia rich in software development expertise Spanish industry expertise Many European service providers focused on Poland Pure plays have gone further East What counts in deciding a nearshore location Country stability; infrastructure quality, cultural affinity and the quality of local labour count What about Spain? © 2009 IDC Sep-09 18
  • 19.
    Agenda 1. Few wordsabout IDC 2. The Spanish IT Services Market Overview 3. Why Nearshore? 4. Spain emerges as a credible Nearshore destination 5. Madrid unique value proposition © 2009 IDC Sep-09 19
  • 20.
    Skills, Scale andLocation Underpin Spain’s Appeal • Addressing… … The IT Shortage challenge. Check out the ratios! … The value / cost trade off … The value of industry experience • EU Member Regulation (ie. Security concerns) • Potential to scale with Latin America Spain/Latin American delivery model offering skilled pool © 2009 IDC Sep-09 20
  • 21.
    Addressing the ITSkill Shortage Challenge Number of graduates in sciences, math…Year 2007 Highlights Spain more than doubles Poland number of Science graduates. 70% under 45 Looking at the long term… A high percentage of Spanish graduates are under 45 years old. Source: Eurostat, 2009 © 2009 IDC Sep-09 21
  • 22.
    Addressing the Value/Cost Trade-off Spanish IT labor cost. Year 2007 Highlights Denmark Sweden Spain has a lower cost than western Germany Europe… Norway … while remaining competitive with Netherlands eastern europe. Finland France Spain ranks in between Austria and Belgium Greece. United Kingdom Nordics have the most expensive Ireland human resources. Italy Austria Ireland and Italy are more expensive Spain than Spain. Greece Czech Republic Hungary Romania Poland 0 10.000 20.000 30.000 40.000 50.000 60.000 Experienced (5 - 9 year experience) Juniors (1 - 4 year experience) Source: IDC, 2009 © 2009 IDC Sep-09 22
  • 23.
    The Value ofIndustry Experience Spanish Industry experience. Year 2007. Highlights Spain enjoys high level of experience O. Verticals in the main vertical sectors. Consultants with more than 3 years Telecom experience form the largest segments, followed by analyst and senior consultants Government Finance lead the way in experience at all levels: Analysts, consultants, etc. Utilities Telco and manufacturing surpass 10,000 skilled resources in Spain. Manufacturing Finance 0 5.000 10.000 15.000 20.000 25.000 Analysts (Finance) Consultant (+3 Years experience) Senior Consultant (+4 Years experience) Manager (+5 Years experience) Partner Source: IDC, 2009 © 2009 IDC Sep-09 23
  • 24.
    Considering Spain 1. ValuedSkills in a low-risk environment at a competitive cost. 2. Ability to source the right skills for specific tasks from the preferred locations for commoditized projects. 3. Vertical expertise, length of experience in innovation in the market, and global best practices. 4. Investments by established service providers, attractiveness of IT sector (influences future availability of skills) 5. Common environment: similar practices, vertical maturity, EU regulations, etc. 6. Cultural affinity between Spain and the rest of Europe as opposition to the cultural issues raised by offshore projects. © 2009 IDC Sep-09 24
  • 25.
    Agenda 1. Few wordsabout IDC 2. The Spanish IT Services Market Overview 3. Firms move nearshore to solve offshore issues 4. Spain emerges as a credible nearshore destination 5. Madrid unique value proposition. © 2009 IDC Sep-09 25
  • 26.
    Madrid Region: Snapshot Madrid contribution to Spain through different variables. Year 2007 Highlights 25% Madrid contributed in 19,20% 20% 18,60% 2007 to the Spanish As percentage of Spain 15% population by 13,6% (6,2 13,60% Million) while its 10% contribution to the GDP was 18,6% (203.237 M€). 5% 1,60% Madrid counts with 14 0% universities and a number Size Population GDP Foreign population of graduates of 232,449 Madrid skill work force. Year 2007 250000 232449 (2007). While engineering students were 64,855 200000 which was about 17% of Spain. 150000 In 2007 95,785 people 95785 100000 were employed by the IT 64857 50000 sector in madrid. 35000 0 Graduates Under graduate Engeniering students IT employees Source: Madrid region statistics sector, Observatorio regional de inmigración, Secretaria general del consejo de coordinación universitaria. © 2009 IDC Sep-09 26
  • 27.
    Check List WhenConsidering a Location Economic and Political Factors Resources Skill Factors • Political Commitment • Education Levels • Regulatory Environment • Language Proficiency • Intellectual Property Protection • Resource Availability • Economy • Work Culture Financial Factors • Compensation • Tax and Country-Specific Costs Check out the ratios! • Fixed Costs and Variable Costs IT industry Itself Infrastructure Factors • ICT Infrastructure Business and Regional Factors • Transportation • Location • Employee Acquisition and Dismissal • Market Experience • Real Estate © 2009 IDC Sep-09 27
  • 28.
    Madrid Contribution toSpanish IT Market. Highlights Madrid is the biggest IT market inside Spain, it represented 39% in 2007. Madrid concentrates more than half of the Spanish external IT expenditure made by very large companies. Madrid Contribution to Spanish IT market Madrid Contribution to Spanish IT market by company size Year 2007. Year 2007. SMB Madrid 39% Large Enterprise Very Large Enterprise Resto de España 61% Consumer & Soho 0% 10% 20% 30% 40% 50% 60% Source: IDC, 2008 (España en Cifras) Source: IDC, 2008 (España en Cifras) © 2009 IDC Sep-09 28
  • 29.
    Madrid Contribution toSpanish IT Market. Highlights Madrid gathers more than 50% of the IT expenditure made by 5 vertical markets Madrid contributes to more than 40% of the Spanish outsourcing market. Madrid Contribution to Spanish IT vertical markets Madrid Contribution to Spanish IT segment markets Year 2007. Year 2007 Utilities Workstations Transport Support Professional Services Infraestructure software Personal and other Servers Health Public Peripherics Other Financial Desktop Industrial processes Laptop Industrial discrete Outsourcing Education Networking Retail Distribution System Integration Wholesale Distribution Development tools Consumer and Soho Communication and Media Training Banking Consulting Insurer Applications Agriculture / Construction / Commodities Storage 0% 10% 20% 30% 40% 50% 60% 70% 0% 10% 20% 30% 40% 50% Source: IDC, 2009 (España en Cifras) Source: IDC, 2009 (España en Cifras) © 2009 IDC Sep-09 29
  • 30.
    Considering Madrid • Valueadded specialised expertise Expertise centres in Madrid with technology and industry focus • Strong infrastructures reduces operating cost Communication infrastructure (ie Travelling cost reduction) • High rate of IT employment High percentage with more than 3 Years experience • Experience and collaboration with European and Latam peers Project management expertise and complex IT processes • Physical and cultural affinity Reduced hidden cost (ie Smoothing day-to-day relationship) Good balance of Risk – Value – Cost. © 2009 IDC Sep-09 30
  • 31.
    Agenda 1. Few wordsabout IDC 2. The Spanish IT Services Market Overview 3. Firms move nearshore to solve offshore issues 4. Spain emerges as a credible nearshore destination 5. Madrid unique value proposition. 6. Key take away © 2009 IDC Sep-09 31
  • 32.
    Key take away Global delivery is used in most large 1 outsourcing deals 2 European firms need Nearshore options Spain offers a credible Nearshore 3 destination Madrid have shown a good balance: 4 Cost / Risk / Value © 2009 IDC Sep-09 32
  • 33.
    Thank You! Fernando Maldonado IDC fmaldonado@idc.com Plaza Colón 2 Program Manager 28046 Madrid www.idc.com www.idc.com/spain © 2009 IDC Sep-09 33