Understanding the Pakistan Budgeting Process: Basics and Key Insights
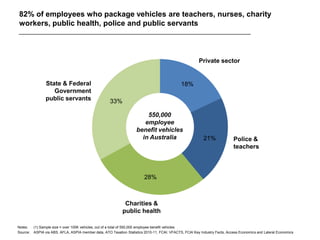
82% of employees who package vehicles are teachers nurses charity workers public health police and public servants
1. 82% of employees who package vehicles are teachers, nurses, charity
workers, public health, police and public servants
Notes: (1) Sample size = over 100K vehicles, out of a total of 550,000 employee benefit vehicles
Source: ASPIA via ABS, AFLA, ASPIA member data, ATO Taxation Statistics 2010-11, FCAI: VFACTS, FCAI Key Industry Facts, Access Economics and Lateral Economics
18%
21%
28%
33%
Private sector
Police &
teachers
Charities &
public health
State & Federal
Government
public servants
550,000
employee
benefit vehicles
in Australia
2. 35% of packaged cars made by local manufacturers Toyota, Ford and Holden;
just 5% are BMW, Mercedes and Audi
5%
35%
60%
BMW, Mercedes
& Audi
Toyota, Ford &
Holden – Local
Manufacturers
Other Makes
$34,500 =
average price
Notes: (1) Sample size = over 100K vehicles, out of a total of 550,000 employee benefit vehicles
Source: ASPIA via ABS, AFLA, ASPIA member data, ATO Taxation Statistics 2010-11, FCAI: VFACTS, FCAI Key Industry Facts, Access Economics and Lateral Economics
3. 21% of new vehicles sold in Australia are employee benefit vehicles
Source: ASPIA via ABS, AFLA, ASPIA member data, ATO Taxation Statistics 2010-11, FCAI: VFACTS, FCAI Key Industry Facts, Access Economics and Lateral Economics
21%
79%
Employee
Benefit Vehicles
Non-Benefit
Vehicles
1.1 million
new vehicles
sold annually in
Australia
4. 70% of employees who package vehicles earn less than $100,000
30%
70%
Greater than or
equal to $100,000
Less than
$100,000
Notes: (1) Sample size = over 100K vehicles, out of a total of 550,000 employee benefit vehicles
Source: ASPIA via ABS, AFLA, ASPIA member data, ATO Taxation Statistics 2010-11, FCAI: VFACTS, FCAI Key Industry Facts, Access Economics and Lateral Economics
550,000
employee
benefit vehicles
in Australia
5. Some key log book facts
Source: ASPIA via ABS, AFLA, ASPIA member data, ATO Taxation Statistics 2010-11, FCAI: VFACTS, FCAI Key Industry Facts, Access Economics and Lateral Economics
How often? What is needed? How many affected?
• 12 weeks, every 5 years
• However, a log book
refresh is needed:
— Every time a driver
changes jobs
— Every time cars are
rotated amongst staff
— Every time a driver
moves residences
— Every time a driver
moves to another
branch or location
within their employment
— Every time driving
patterns change
• All business kilometres
• All running
costs, including:
— Fuel costs
— Tyre costs
— Servicing costs
• An invalid log book
means that all costs will
become taxable at the top
tax rate
• Around 550,000 employee
benefit vehicles
• In addition, the vast
majority of all tool-of-
trade vehicles will be
affected