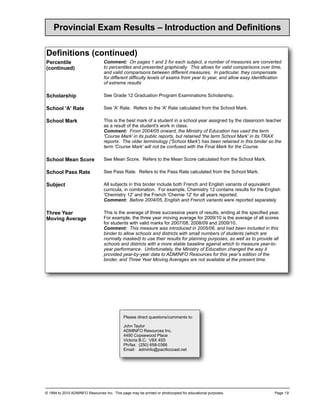
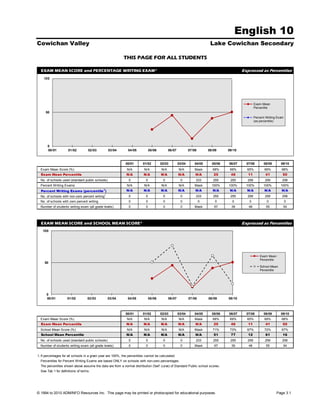
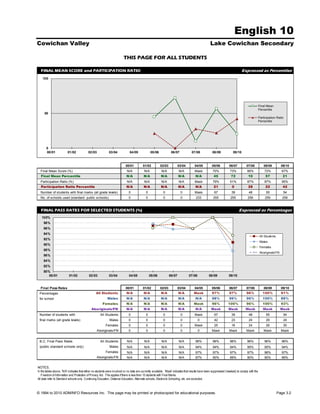
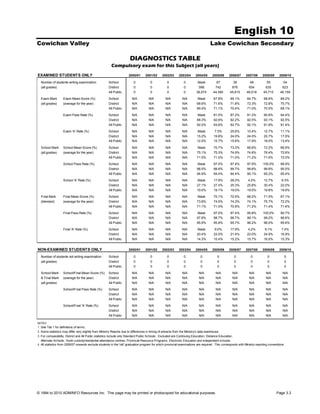
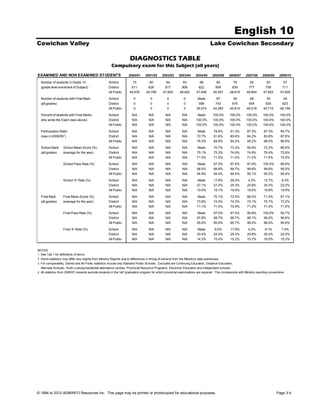
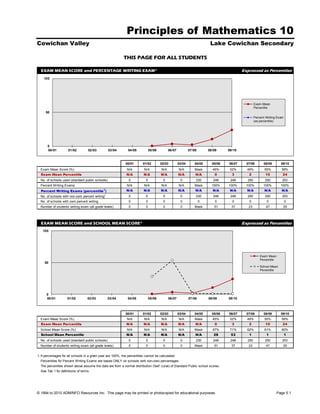
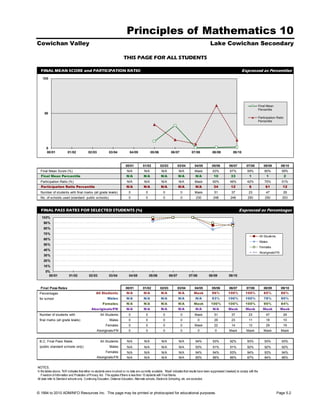
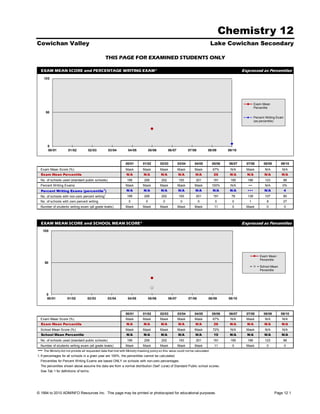
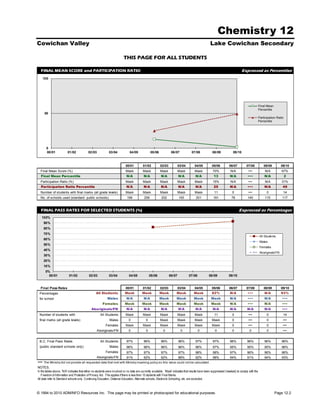
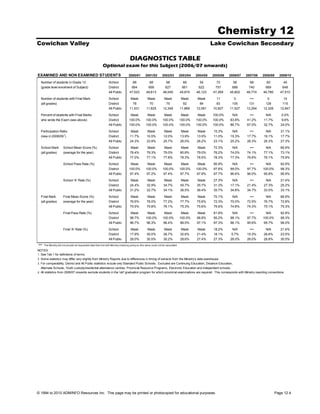
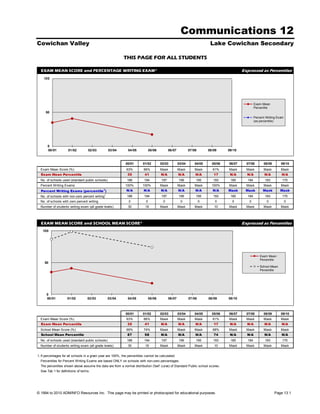
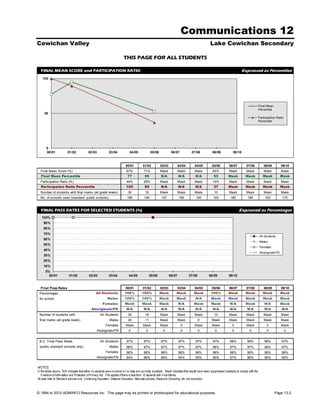
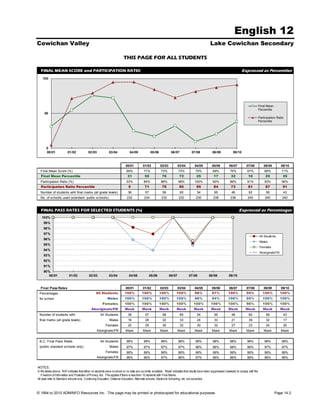
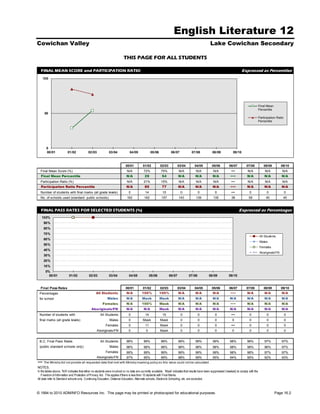
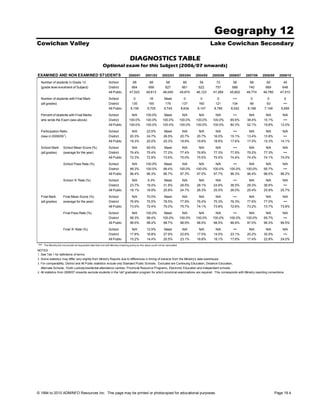
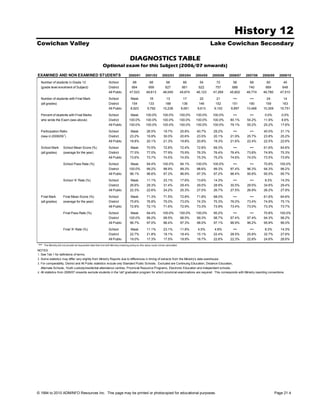
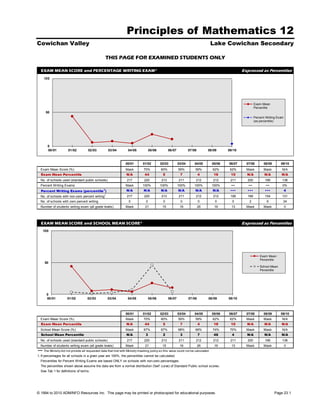
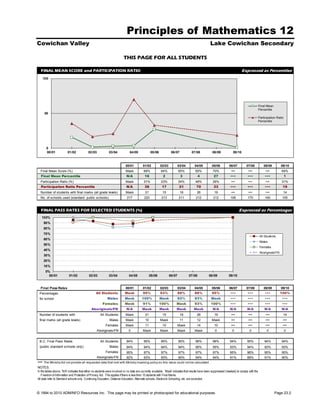
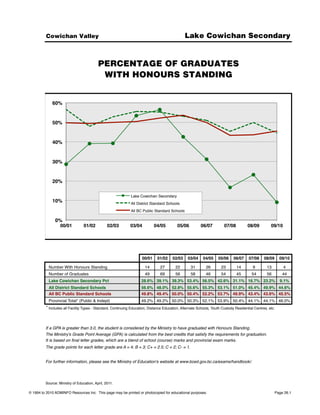
This document is an introduction to a binder presenting provincial exam results for secondary school students. It defines key terms and measures used in the binder such as participation ratio and percentiles. It emphasizes analyzing multi-year trends rather than single year results, and comparing schools to their facility type peers. Interpreting relationships between exam marks, school marks, and participation ratio while accounting for students who opt out of exams is important.
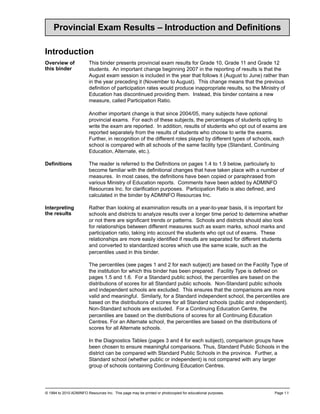
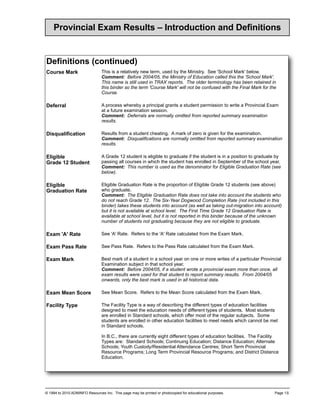


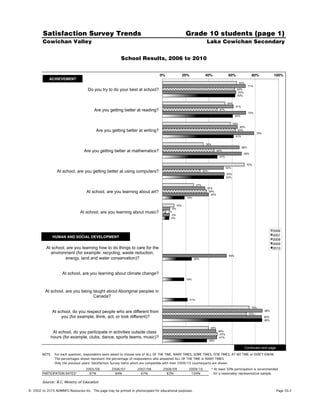
![Satisfaction Survey, 2010 Grade 10 students (page 1)
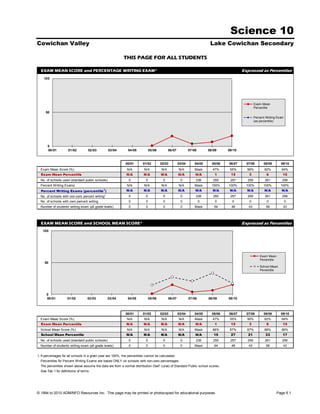
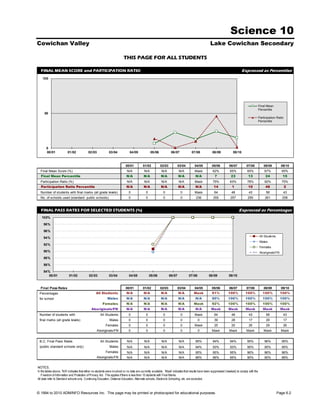
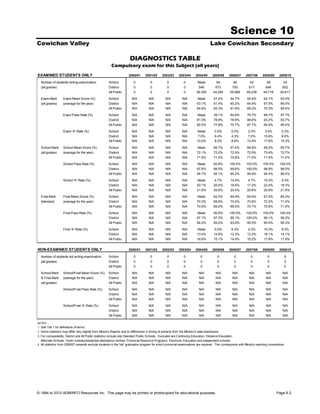
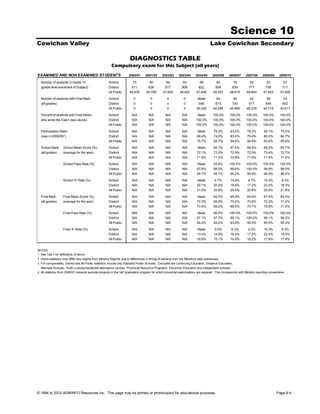
Cowichan Valley Lake Cowichan Secondary
Percentage responding 'All of the time' or 'Many times'
0%! 20%! 40%! 60%! 80%! 100%!
ACHIEVEMENT!
63%
Do you try to do your best at school? [63% = 17th 69%
percentile] 70%
60%
Are you getting better at reading? [60% = 66th percentile] 49%
57%
61%
Are you getting better at writing? [61% = 73rd percentile] 56%
57%
47%
Are you getting better at mathematics? [47% = 21st 52%
percentile] 54%
53%
At school, are you getting better at using computers? [53% 34%
= 91st percentile] 40%
19%
At school, are you learning about art? [19% = 62nd 18%
percentile] 17%
6%
At school, are you learning about music? [6% = 16th 7%
percentile] 15%
School!
HUMAN AND SOCIAL DEVELOPMENT! District!
Province!
At school, are you learning how to do things to care for the
25%
environment (for example: recycling, waste reduction, 29%
energy, land and water conservation)? [25% = 14th 39%
percentile]
19%
At school, are you learning about climate change? [19% = 26%
8th percentile] 33%
21%
At school, are you being taught about Aboriginal peoples in 28%
Canada? [21% = 7th percentile] 36%
At school, do you respect people who are different from you 86%
(for example, think, act, or look different)? [86% = 79th 80%
percentile] 81%
At school, do you participate in activities outside class 38%
hours (for example, clubs, dance, sports teams, music)? 33%
[38% = 37th percentile] 40%
Continued next page
NOTES. For each question, respondents were asked to choose one of ALL OF THE TIME, MANY TIMES, SOME TIMES, FEW TIMES, AT NO TIME or DON'T KNOW.
The percentages shown represent the percentage of respondents who answered ALL OF THE TIME or MANY TIMES.
>> Participation for the school was 104%. Participation of at least 50% is recommended for a reasonably representative sample.
>> Participation for the district was 91%. Participation of at least 50% is recommended for a reasonably representative sample.
>> Participation for the province was 72%. Participation of at least 50% is recommended for a reasonably representative sample.
Percentiles shown after each question represent the percentile rank among all schools (0th percentile = lowest school; 100th percentile = highest school).
Source: B.C. Ministry of Education
©!2002 to 2010 ADMINFO Resources Inc. This page may be printed or photocopied for educational purposes. Page 29.2](https://image.slidesharecdn.com/79lakecowichansec2010set-120726204946-phpapp02/85/79-lake-cowichan-sec-2010-set-126-320.jpg)
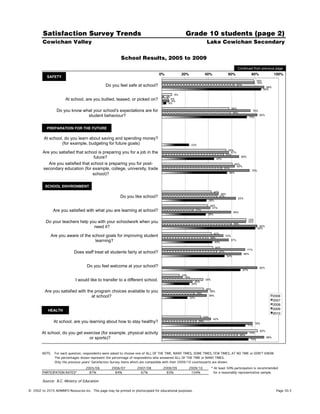
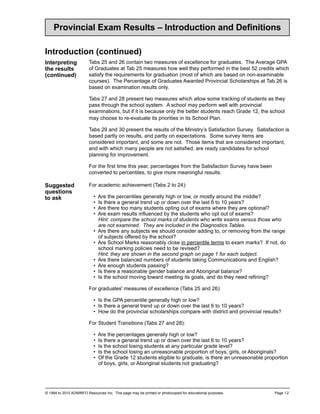
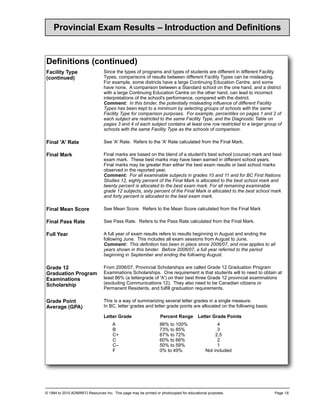
![Satisfaction Survey, 2010 Grade 10 students (page 2)
Cowichan Valley Lake Cowichan Secondary
Percentage responding 'All of the time' or 'Many times'
Continued from previous page
0%! 20%! 40%! 60%! 80%! 100%!
SAFETY!
85%
Do you feel safe at school? [85% = 94th percentile] 72%
73%
At school, are you bullied, teased, or picked on? [4% = 15th 4%
8%
percentile] 7%
Do you know what your school's expectations are for 63%
73%
student behaviour? [73% = 76th percentile] 67%
PREPARATION FOR THE FUTURE!
At school, do you learn about saving and spending money? 23%
(for example, budgeting for future goals) [23% = 39th 31%
27%
percentile]
Are you satisfied that school is preparing you for a job in the 45%
48%
future? [45% = 50th percentile] 46%
Are you satisfied that school is preparing you for post- 56%
secondary education (for example, college, university, trade 56%
54%
school)? [56% = 65th percentile]
SCHOOL ENVIRONMENT!
38%
Do you like school? [38% = 56th percentile] 35%
38%
Are you satisfied with what you are learning at school? [38% 38%
36%
= 54th percentile] 38%
Do your teachers help you with your schoolwork when you 63%
80%
need it? [80% = 96th percentile] 62%
Are you aware of the school goals for improving student 27%
43%
learning? [43% = 93rd percentile] 30%
Does staff treat all students fairly at school? [54% = 89th 46%
54%
percentile] 44%
Do you feel welcome at your school? [67% = 60th 63%
67%
percentile] 65%
I would like to transfer to a different school. [24% = 78th 18%
24%
percentile] 18%
Are you satisfied with the program choices available to you 22%
54%
at school? [22% = 8th percentile] 52%
School!
HEALTH! District!
Province!
At school, are you learning about how to stay healthy? [71% 44%
71%
= 100th percentile] 46%
At school, do you get exercise (for example, physical activity 63%
74%
or sports)? [74% = 83rd percentile] 65%
NOTES. For each question, respondents were asked to choose one of ALL OF THE TIME, MANY TIMES, SOME TIMES, FEW TIMES, AT NO TIME or DON'T KNOW.
The percentages shown represent the percentage of respondents who answered ALL OF THE TIME or MANY TIMES.
>> Participation for the school was 104%. Participation of at least 50% is recommended for a reasonably representative sample.
>> Participation for the district was 91%. Participation of at least 50% is recommended for a reasonably representative sample.
>> Participation for the province was 72%. Participation of at least 50% is recommended for a reasonably representative sample.
Percentiles shown after each question represent the percentile rank among all schools (0th percentile = lowest school; 100th percentile = highest school).
Source: B.C. Ministry of Education
©!2002 to 2010 ADMINFO Resources Inc. This page may be printed or photocopied for educational purposes. Page 29.3](https://image.slidesharecdn.com/79lakecowichansec2010set-120726204946-phpapp02/85/79-lake-cowichan-sec-2010-set-127-320.jpg)
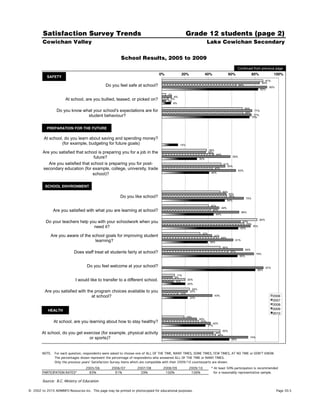
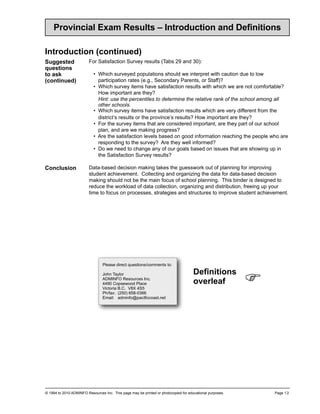
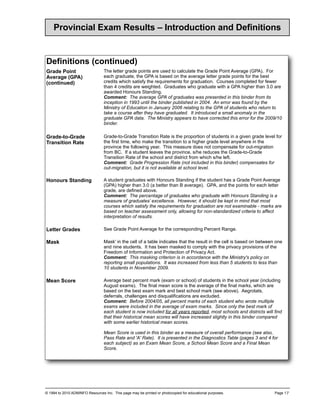
![Satisfaction Survey, 2010 Grade 12 students (page 1)
Cowichan Valley Lake Cowichan Secondary
Percentage responding 'All of the time' or 'Many times'
0%! 20%! 40%! 60%! 80%! 100%!
ACHIEVEMENT!
50%
Do you try to do your best at school? [50% = 0th percentile] 68%
66%
54%
Are you getting better at reading? [54% = 45th percentile] 47%
55%
69%
Are you getting better at writing? [69% = 93rd percentile] 60%
57%
39%
Are you getting better at mathematics? [39% = 30th 48%
percentile] 44%
39%
At school, are you getting better at using computers? [39% 35%
= 68th percentile] 34%
24%
At school, are you learning about art? [24% = 73rd 23%
percentile] 19%
8%
At school, are you learning about music? [8% = 26th 8%
percentile] 13%
School!
HUMAN AND SOCIAL DEVELOPMENT! District!
Province!
At school, are you learning how to do things to care for the
33%
environment (for example: recycling, waste reduction, 34%
energy, land and water conservation)? [33% = 38th 38%
percentile]
19%
At school, are you learning about climate change? [19% = 22%
37th percentile] 22%
10%
At school, are you being taught about Aboriginal peoples in 11%
Canada? [10% = 12th percentile] 19%
At school, do you respect people who are different from you 70%
(for example, think, act, or look different)? [70% = 4th 83%
percentile] 83%
At school, do you participate in activities outside class 37%
hours (for example, clubs, dance, sports teams, music)? 38%
[37% = 34th percentile] 40%
Continued next page
NOTES. For each question, respondents were asked to choose one of ALL OF THE TIME, MANY TIMES, SOME TIMES, FEW TIMES, AT NO TIME or DON'T KNOW.
The percentages shown represent the percentage of respondents who answered ALL OF THE TIME or MANY TIMES.
>> Participation for the school was 106%. Participation of at least 50% is recommended for a reasonably representative sample.
>> Participation for the district was 84%. Participation of at least 50% is recommended for a reasonably representative sample.
>> Participation for the province was 60%. Participation of at least 50% is recommended for a reasonably representative sample.
Percentiles shown after each question represent the percentile rank among all schools (0th percentile = lowest school; 100th percentile = highest school).
Source: B.C. Ministry of Education
©!2002 to 2010 ADMINFO Resources Inc. This page may be printed or photocopied for educational purposes. Page 29.4](https://image.slidesharecdn.com/79lakecowichansec2010set-120726204946-phpapp02/85/79-lake-cowichan-sec-2010-set-128-320.jpg)
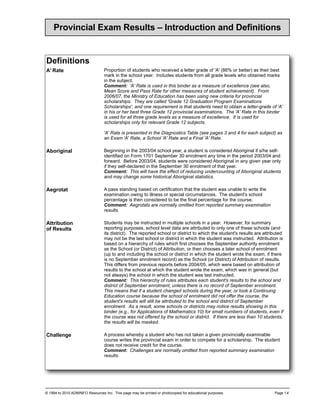
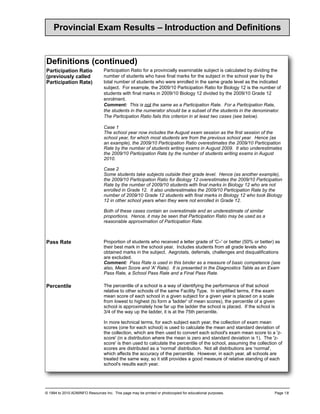
![Satisfaction Survey, 2010 Grade 12 students (page 2)
Cowichan Valley Lake Cowichan Secondary
Percentage responding 'All of the time' or 'Many times'
Continued from previous page
0%! 20%! 40%! 60%! 80%! 100%!
SAFETY!
82%
Do you feel safe at school? [82% = 61st percentile] 80%
79%
At school, are you bullied, teased, or picked on? [8% = 73rd 8%
6%
percentile] 6%
Do you know what your school's expectations are for 68%
75%
student behaviour? [75% = 77th percentile] 68%
PREPARATION FOR THE FUTURE!
At school, do you learn about saving and spending money? 14%
(for example, budgeting for future goals) [14% = 26th 17%
19%
percentile]
Are you satisfied that school is preparing you for a job in the 30%
38%
future? [30% = 36th percentile] 34%
Are you satisfied that school is preparing you for post- 40%
secondary education (for example, college, university, trade 54%
47%
school)? [40% = 26th percentile]
SCHOOL ENVIRONMENT!
54%
Do you like school? [54% = 87th percentile] 49%
44%
Are you satisfied with what you are learning at school? [44% 44%
46%
= 50th percentile] 44%
Do your teachers help you with your schoolwork when you 65%
72%
need it? [65% = 46th percentile] 65%
Are you aware of the school goals for improving student 28%
39%
learning? [39% = 89th percentile] 28%
Does staff treat all students fairly at school? [65% = 94th 51%
65%
percentile] 47%
Do you feel welcome at your school? [80% = 89th 74%
80%
percentile] 69%
I would like to transfer to a different school. [20% = 85th 11%
20%
percentile] 13%
Are you satisfied with the program choices available to you 22%
56%
at school? [22% = 11th percentile] 49%
School!
HEALTH! District!
Province!
At school, are you learning about how to stay healthy? [37% 37%
34%
= 66th percentile] 34%
At school, do you get exercise (for example, physical activity 40%
58%
or sports)? [58% = 94th percentile] 40%
NOTES. For each question, respondents were asked to choose one of ALL OF THE TIME, MANY TIMES, SOME TIMES, FEW TIMES, AT NO TIME or DON'T KNOW.
The percentages shown represent the percentage of respondents who answered ALL OF THE TIME or MANY TIMES.
>> Participation for the school was 106%. Participation of at least 50% is recommended for a reasonably representative sample.
>> Participation for the district was 84%. Participation of at least 50% is recommended for a reasonably representative sample.
>> Participation for the province was 60%. Participation of at least 50% is recommended for a reasonably representative sample.
Percentiles shown after each question represent the percentile rank among all schools (0th percentile = lowest school; 100th percentile = highest school).
Source: B.C. Ministry of Education
©!2002 to 2010 ADMINFO Resources Inc. This page may be printed or photocopied for educational purposes. Page 29.5](https://image.slidesharecdn.com/79lakecowichansec2010set-120726204946-phpapp02/85/79-lake-cowichan-sec-2010-set-129-320.jpg)
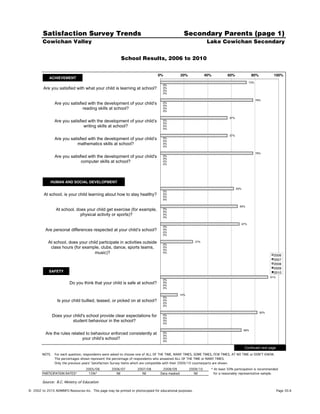
![Satisfaction Survey, 2010 Secondary Parents (page 1)
Cowichan Valley Lake Cowichan Secondary
Percentage responding 'All of the time' or 'Many times'
ACHIEVEMENT! 0%! 20%! 40%! 60%! 80%! 100%!
0%
Are you satisfied with what your child is learning at school? 58%
[No responses] 74%
0%
Are you satisfied with the development of your child’s 69%
reading skills at school? [No responses] 74%
0%
Are you satisfied with the development of your child’s 62%
writing skills at school? [No responses] 64%
0%
Are you satisfied with the development of your child’s 38%
mathematics skills at school? [No responses] 63%
0%
Are you satisfied with the development of your child's 58%
computer skills at school? [No responses] 67%
HUMAN AND SOCIAL DEVELOPMENT!
0%
At school, is your child learning about how to stay healthy? 40%
[No responses] 68%
0%
At school, does your child get exercise (for example, 52%
physical activity or sports)? [No responses] 68%
0%
Are personal differences respected at your child’s school? 74%
[No responses] 74%
At school, does your child participate in activities outside 0%
class hours (for example, clubs, dance, sports teams, 42%
50%
music)? [No responses]
School!
District!
SAFETY! Province!
0%
Do you think that your child is safe at school? [No 77%
responses] 85%
0%
Is your child bullied, teased, or picked on at school? [No 0%
responses] 5%
0%
Does your child's school provide clear expectations for 75%
student behaviour in the school? [No responses] 80%
0%
Are the rules related to behaviour enforced consistently at 67%
your child’s school? [No responses] 69%
Continued next page
NOTES. For each question, respondents were asked to choose one of ALL OF THE TIME, MANY TIMES, SOME TIMES, FEW TIMES, AT NO TIME or DON'T KNOW.
The percentages shown represent the percentage of respondents who answered ALL OF THE TIME or MANY TIMES.
>> School did not participate for this grade level.
WARNING! Participation for the district was 2%. Participation of at least 50% is recommended for a reasonably representative sample.
WARNING! Participation for the province was 4%. Participation of at least 50% is recommended for a reasonably representative sample.
Percentiles shown after each question represent the percentile rank among all schools (0th percentile = lowest school; 100th percentile = highest school).
Source: B.C. Ministry of Education
©!2002 to 2010 ADMINFO Resources Inc. This page may be printed or photocopied for educational purposes. Page 29.6](https://image.slidesharecdn.com/79lakecowichansec2010set-120726204946-phpapp02/85/79-lake-cowichan-sec-2010-set-130-320.jpg)
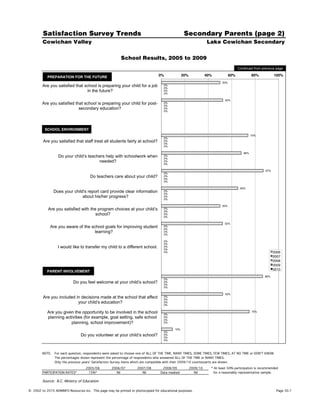
![Satisfaction Survey, 2010 Secondary Parents (page 2)
Cowichan Valley Lake Cowichan Secondary
Percentage responding 'All of the time' or 'Many times'
Continued from previous page
PREPARATION FOR THE FUTURE! 0%! 20%! 40%! 60%! 80%! 100%!
0%
Are you satisfied that school is preparing your child for a job 42%
in the future? [No responses] 52%
0%
Are you satisfied that school is preparing your child for post- 50%
secondary education? [No responses] 60%
SCHOOL ENVIRONMENT!
0%
Are you satisfied that staff treat all students fairly at school? 62%
[No responses] 69%
0%
Do your child’s teachers help with schoolwork when 50%
needed? [No responses] 68%
0%
Do teachers care about your child? [No responses] 62%
71%
0%
Does your child's report card provide clear information 54%
about his/her progress? [No responses] 74%
0%
Are you satisfied with the program choices at your child’s 54%
school? [No responses] 67%
0%
Are you aware of the school goals for improving student 41%
learning? [No responses] 47%
0%
I would like to transfer my child to a different school. [No 20%
responses] 7%
School!
District!
PARENT INVOLVEMENT! Province!
0%
Do you feel welcome at your child’s school? [No responses] 62%
78%
0%
Are you included in decisions made at the school that affect 32%
your child’s education? [No responses] 47%
Are you given the opportunity to be involved in the school 0%
planning activities (for example, goal setting, safe school 36%
54%
planning, school improvement)? [No responses]
0%
Do you volunteer at your child’s school? [No responses] 4%
14%
NOTES. For each question, respondents were asked to choose one of ALL OF THE TIME, MANY TIMES, SOME TIMES, FEW TIMES, AT NO TIME or DON'T KNOW.
The percentages shown represent the percentage of respondents who answered ALL OF THE TIME or MANY TIMES.
>> School did not participate for this grade level.
WARNING! Participation for the district was 2%. Participation of at least 50% is recommended for a reasonably representative sample.
WARNING! Participation for the province was 4%. Participation of at least 50% is recommended for a reasonably representative sample.
Percentiles shown after each question represent the percentile rank among all schools (0th percentile = lowest school; 100th percentile = highest school).
Source: B.C. Ministry of Education
©!2002 to 2010 ADMINFO Resources Inc. This page may be printed or photocopied for educational purposes. Page 29.7](https://image.slidesharecdn.com/79lakecowichansec2010set-120726204946-phpapp02/85/79-lake-cowichan-sec-2010-set-131-320.jpg)
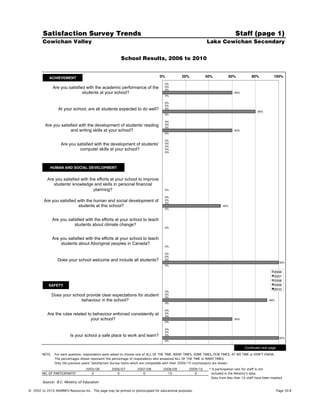
![Satisfaction Survey, 2010 Staff (page 1)
Cowichan Valley Lake Cowichan Secondary
Less than 10 survey forms returned - school data have been masked
Percentage responding 'All of the time' or 'Many times'
ACHIEVEMENT! 0%! 20%! 40%! 60%! 80%! 100%!
0%
Are you satisfied with the academic performance of the 82%
students at your school? [Masked] 70%
0%
At your school, are all students expected to do well? 95%
[Masked] 89%
0%
Are you satisfied with the development of students' reading 73%
and writing skills at your school? [Masked] 65%
0%
Are you satisfied with the development of students' 63%
computer skills at your school? [Masked] 69%
HUMAN AND SOCIAL DEVELOPMENT!
Are you satisfied with the efforts at your school to improve 0%
students' knowledge and skills in personal financial 46%
planning? [Masked] 40%
0%
Are you satisfied with the human and social development of 79%
students at this school? [Masked] 73%
0%
Are you satisfied with the efforts at your school to teach 53%
students about climate change? [Masked] 57%
0%
Are you satisfied with the efforts at your school to teach 50%
students about Aboriginal peoples in Canada? [Masked] 69%
0%
Does your school welcome and include all students? 99%
[Masked] 96%
School!
District!
SAFETY! Province!
0%
Does your school provide clear expectations for student 90%
behaviour in the school? [Masked] 86%
0%
Are the rules related to behaviour enforced consistently at 85%
your school? [Masked] 75%
0%
Is your school a safe place to work and learn? [Masked] 93%
92%
Continued next page
NOTES. For each question, respondents were asked to choose one of ALL OF THE TIME, MANY TIMES, SOME TIMES, FEW TIMES, AT NO TIME or DON'T KNOW.
The percentages shown represent the percentage of respondents who answered ALL OF THE TIME or MANY TIMES.
According to Ministry reports, a participation rate for staff is not included as the Ministry collects data only on teaching staff, and the survey is
open to all school employees. However, low historical participation suggests that the results may not represent the opinions of staff as a whole.
Percentiles shown after each question represent the percentile rank among all districts (0th percentile = lowest district; 100th percentile = highest district).
Data from less than 10 staff have been masked.
Source: B.C. Ministry of Education
©!2002 to 2010 ADMINFO Resources Inc. This page may be printed or photocopied for educational purposes. Page 29.8](https://image.slidesharecdn.com/79lakecowichansec2010set-120726204946-phpapp02/85/79-lake-cowichan-sec-2010-set-132-320.jpg)
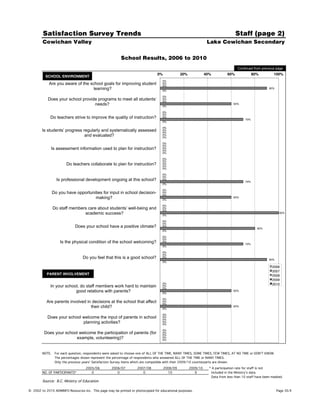
![Satisfaction Survey, 2010 Staff (page 2)
Cowichan Valley Lake Cowichan Secondary
Less than 10 survey forms returned - school data have been masked
Percentage responding 'All of the time' or 'Many times'
Continued from previous page
0%! 20%! 40%! 60%! 80%! 100%!
SCHOOL ENVIRONMENT!
Are you aware of the school goals for improving student 0%
92%
learning? [Masked] 86%
Does your school provide programs to meet all students’ 0%
79%
needs? [Masked] 79%
Do teachers strive to improve the quality of instruction? 0%
94%
[Masked] 87%
Is students’ progress regularly and systematically assessed 0%
96%
and evaluated? [Masked] 91%
Is assessment information used to plan for instruction? 0%
90%
[Masked] 82%
0%
Do teachers collaborate to plan for instruction? [Masked] 67%
67%
Is professional development ongoing at this school? 0%
83%
[Masked] 82%
Do you have opportunities for input in school decision- 0%
69%
making? [Masked] 61%
Do staff members care about students’ well-being and 0%
98%
academic success? [Masked] 96%
0%
Does your school have a positive climate? [Masked] 88%
86%
0%
Is the physical condition of the school welcoming? [Masked] 75%
77%
0%
Do you feel that this is a good school? [Masked] 95%
89%
School!
PARENT INVOLVEMENT! District!
Province!
In your school, do staff members work hard to maintain 0%
96%
good relations with parents? [Masked] 89%
Are parents involved in decisions at the school that affect 0%
77%
their child? [Masked] 74%
Does your school welcome the input of parents in school 0%
84%
planning activities? [Masked] 80%
Does your school welcome the participation of parents (for 0%
91%
example, volunteering)? [Masked] 86%
NOTES. For each question, respondents were asked to choose one of ALL OF THE TIME, MANY TIMES, SOME TIMES, FEW TIMES, AT NO TIME or DON'T KNOW.
The percentages shown represent the percentage of respondents who answered ALL OF THE TIME or MANY TIMES.
According to Ministry reports, a participation rate for staff is not included as the Ministry collects data only on teaching staff, and the survey is
open to all school employees. However, low historical participation suggests that the results may not represent the opinions of staff as a whole.
Percentiles shown after each question represent the percentile rank among all districts (0th percentile = lowest district; 100th percentile = highest district).
Data from less than 10 staff have been masked.
Source: B.C. Ministry of Education
©!2002 to 2010 ADMINFO Resources Inc. This page may be printed or photocopied for educational purposes. Page 29.9](https://image.slidesharecdn.com/79lakecowichansec2010set-120726204946-phpapp02/85/79-lake-cowichan-sec-2010-set-133-320.jpg)