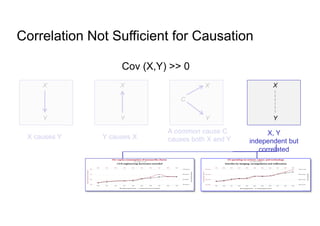
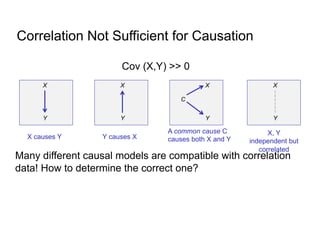
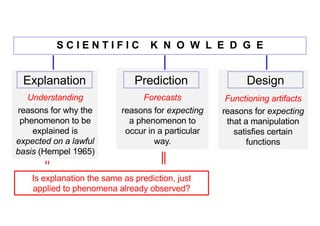
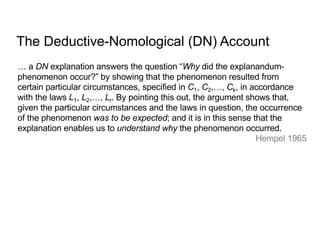
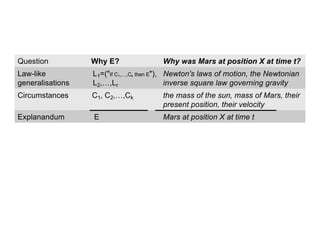
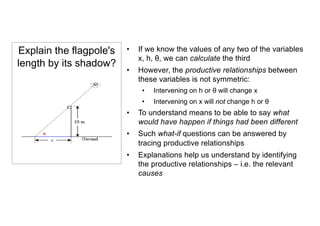
- The document discusses explanation as one aim of science according to the deductive-nomological (DN) account of explanation.
- Under the DN account, understanding a phenomenon is achieved by deducing it from laws of nature and specifying the particular circumstances.
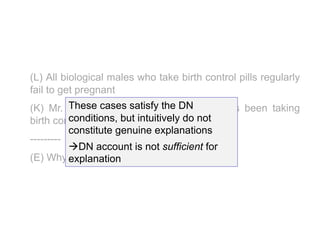
- However, the DN account is not sufficient for explanation as there can be intuitive explanations that do not satisfy the DN conditions, such as singular causal explanations.


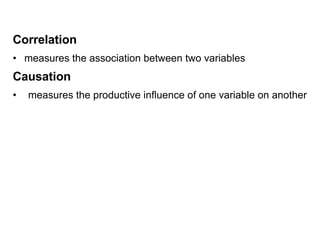
![Singular Explanandum General Explanadum
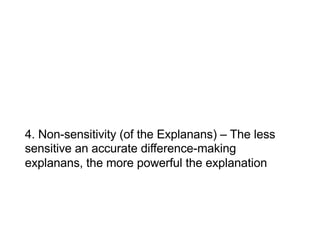
Thus, despite national averages that indicate boys’ performance was consistently higher
in science than that of girls relative to their personal mean across academic areas, there were
substantial numbers of girls within nations that performed relatively better in science than in
other areas. Within Finland and Norway, two countries with large overall sex differences in the
intra-individual science gap and very high GGGI scores, there were 24% and 18% of girls who
had science as their personal academic strength, respectively; relative to 37% and 46% of boys.
Finally, it should also be noted that the difference between the percentage of girls with a
strength in science or mathematics was always equally large or larger than the percentage of
women graduating in STEM; importantly, again this difference was larger in more gender equal
countries (rs = .41, CI = [ .15 , .62 ] , n = 50, p = .003). In other words, more gender equal
countries were more likely than less gender equal countries to lose those girls from an academic
STEM track who are most likely to choose it based on personal academic strengths.
Figure 3: Gender equality (y-axes) is related to sex differences in intra-individual science
strength and STEM graduation. The Global Gender Gap Index (GGGI) assesses the
extent to which economic, educational, health, and political opportunities are equal for
substantial numbers of girls within nations that perform
other areas. Within Finland and Norway, two countrie
intra-individual science gap and very high GGGI score
had science as their personal academic strength, respec
Finally, it should also be noted that the differ
strength in science or mathematics was always equally
women graduating in STEM; importantly, again this d
countries (rs = .41, CI = [ .15 , .62 ] , n = 50, p = .003)
countries were more likely than less gender equal coun
STEM track who are most likely to choose it based on
Figure 3: Gender equality (y-axes) is related to
strength and STEM graduation. The Global Ge
extent to which economic, educational, health,](https://image.slidesharecdn.com/7-221203130918-6a2e4b90/85/7-TaMoS-slides-explanations-and-causes-OLD-pdf-21-320.jpg)
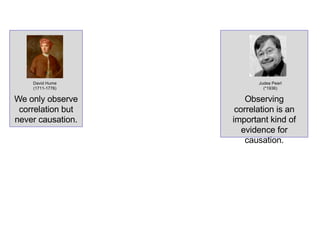
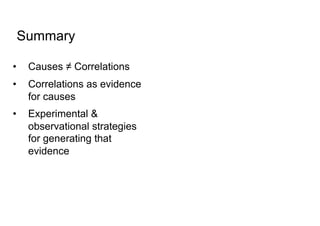
![Illustration: A Very Sensitive Explanans
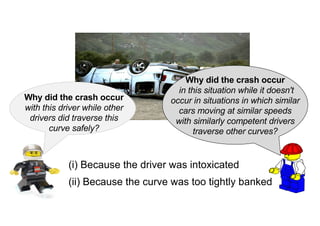
“I don’t want to listen to
[Beethoven’s Appassionata]
because it makes me want
to stroke people’s heads,
and I have to smash those
heads to bring the revolution
to them.”](https://image.slidesharecdn.com/7-221203130918-6a2e4b90/85/7-TaMoS-slides-explanations-and-causes-OLD-pdf-29-320.jpg)