SlideShare a Scribd company logo
1 of 39
6
©iStockphoto/Thinkstock
Models and Forecasting
Learning Objec�ves
A�er comple�ng this chapter, you should be able to:
Define a model and describe how models can be used to analyze
opera�ng problems.
Discuss the nature of forecas�ng.
Explain how forecas�ng can be applied to problems.
Describe methods of forecas�ng, including judgment and
experience, �me-series analysis, and regression and
correla�on.
Construct forecas�ng models.
Es�mate forecas�ng errors.
Processing math: 0%
Model airplanes and buildings have physical characteris�cs
similar to full-scale versions and can be
used to test design characteris�cs.
Uwe Lein/ASSOCIATED PRESS/AP Images
6.1 Introduction to Models and Decision Making
In order for an organiza�on to design, build, and operate
a produc�on facility that is capable of mee�ng customer
demand for services (such as health care) or goods (such
as
ceiling fans), it is necessary for management to obtain an
es�mate or forecast of demand for its products. A forecast
is a predic�on of the future. It o�en examines historical
data to
determine rela�onships among key variables in a problem
and uses those rela�onships to make statements about the
future value of one or more of the variables. Once an
organiza�on has a forecast of demand, it can make
decisions regarding the volume of product that needs to
be produced, the number of workers to hire, and other
key opera�ng
variables. A model is an abstrac�on from the real problem
of the key variables and rela�onships in order to simplify
the problem. The purpose of modeling is to provide the
user
with a be�er understanding of the problem and with a
means of manipula�ng the results for what-if analyses.
Forecas�ng uses models to help organiza�ons predict
important
parameters. Demand is one of those parameters, but cost,
revenue, profits, and other variables can also be
forecasted. The purpose of this chapter is to discuss
models and describe
how they can be applied to business problems, and to
explain forecas�ng and its role in opera�ons.
Stages in Decision Making
Organiza�onal performance is a result of the decisions
that management makes over a period of �me: decisions
about what markets to enter, what products to produce,
what types
of equipment and facili�es to acquire, and where to
locate facili�es. The quality of these decisions is a
func�on of how well managers perform (see Table 6.1).
Table 6.1: Stages in decision making
Stage Example
Define the problem and the
factors that influence it
A hospital is having difficulty maintaining high-quality,
low-cost food service. The quality and cost of incoming
food and the training of
staff are influencing factors.
Select criteria to guide the
decision; establish objec�ves
The hospital selects cost per meal and pa�ent sa�sfac�on
as the criteria. The objec�ves are to reduce meal cost by
15% and improve
pa�ent sa�sfac�on to 90%, based upon the hospital's
weekly surveys.
Formulate a model or models The model includes
mathema�cal rela�onships that indicate how materials
(food) and labor are converted into meals. This model
includes an analysis of wasted food and the standard
amount of labor required to prepare a meal.
Collect relevant data Data on food costs, the amount of
food consumed, the number of meals served, and the
amount of labor are collected. Pa�ent
preferences are inves�gated so that meals meet nutri�onal
requirements and taste good.
Iden�fy and evaluate
alterna�ves
Alterna�ves include subcontrac�ng food prepara�on,
considering new food suppliers, establishing be�er training
programs for the
staff, and changing management.
Select the best alterna�ve One of the alterna�ves or some
combina�on of alterna�ves is selected.
Implement the alterna�ve, and
reevaluate
The selected alterna�ve is implemented, and the problem
is reevaluated through monitoring costs and the pa�ent
survey data to see
if the objec�ves have been achieved.
A model is a way of thinking about a problem. Decision
makers use models to increase their understanding of the
problem because it helps to simplify the problem by
focusing on
the key variables and rela�onships. The model also allows
managers to try different op�ons quickly and
inexpensively. In these ways, decision making can be
improved.
Types of Models
Models are commonly seen for airplanes, cars, dams, or
other structures. These
models can be used to test design characteris�cs. Model
airplanes can be tested in
wind tunnels to determine aerodynamic proper�es, and a
model of a hydroelectric
dam can help architects and engineers find ways of
integra�ng the structure with
the landscape. These models have physical characteris�cs
similar to those of the
real thing. Experiments can be performed on this type of
model to see how it may
perform under opera�ng condi�ons. With technology, such
as computer simula�on
systems, virtual models can be rendered and tested quickly
and less expensively.
The aerodynamic proper�es of an airplane can be tested
in a virtual wind tunnel
that exists only inside the memory of a computer. Models
also include the drawings
of a building that display the physical rela�onships
between the various parts of the
structure. All of these models are simplifica�ons of the
real thing used to help
designers make be�er decisions.
Computer-based technology has been used for many years
to design cars, buildings,
furniture, and other products. It is moving quickly into
the field of medicine.
Medical schools teach students about anatomy using 3-D
computer generated
models. Students can see the nervous system, the blood
vessels, the lymph nodes,
and glands along with the skeleton. The so�ware can
show each separately and put
them all together in one 3-D picture. The so�ware can
take input from various
medical tests and generate 3-D models of a pa�ent to
diagnose medical condi�ons
faster and be�er.
In addi�on to these physical and virtual models, managers
use mathema�cal abstrac�on to model important
rela�onships. The break-even point calcula�on that is
taught in
accoun�ng and finance is an example of applying a
mathema�cal model. The use of drawings and diagrams is
also modeling. The newspaper graph that illustrates stock
market price
Processing math: 0%
changes in the last six months is a way to help the
reader see trends in the market. Models do not have to
be sophis�cated to be useful. Most models can be
grouped into four
categories, and computers play a cri�cal role in the
development and use of each type.
Mathema�cal models include algebraic models such as break-
even analysis, sta�s�cal models used in forecas�ng and
quality control, mathema�cal programming models, and
calculus-based models.
Graphs and charts are pictorial representa�ons of mathema�cal
rela�onships. They include a visual representa�on of break-
even analysis, a pie chart that illustrates market share,
a graph of stock prices over �me, or a bar graph that indicates
the demand for energy for the last five years.
Diagrams and drawings are pictorial representa�ons of
conceptual rela�onships. They include a precedence diagram
that represents the sequence required to assemble a
building, a drawing of a gear that is part of a transmission in a
car, a diagram that represents the logic of a computer program,
and a drawing of an aircra� carrier.
Scale models and prototypes are physical representa�ons of an
item. They include a scale model of an airplane and the first
part produced (prototype), which is normally used for
tes�ng purposes. These models are o�en built and analyzed
inside a computer system. Three-dimensional technology called
stereolithography allows computers to create solid
models of parts. This is done by successively "prin�ng" very
thin layers of a material, which cures quickly to form a sold
part.
Mathema�cal models, graphs and charts, and diagrams are
most commonly used by business and management
professionals, so the discussion in this chapter focuses on
these
types of models.
Application of Models
Many people use models frequently without realizing it.
At a pizza party, the host will probably determine how
much pizza to order by mul�plying the number of people
expected
to a�end by the amount each person is expected to
consume. The host is likely to then mul�ply the
an�cipated cost per pizza by the number ordered to
determine the cost. This is
a simple mathema�cal model that can be used to plan a
small party or major social event.
In mathema�cal models, symbols and algebra are used to
show rela�onships. Mathema�cal models can be simple or
complex. For example, suppose a family is planning a trip
to
Walt Disney World in Orlando, Florida. To es�mate
gasoline costs for the trip, family members check a road
atlas (one type of model), or go online to get direc�ons
and a map
(another type of model). They determine that Orlando is
approximately a 2,200-mile round trip from their home.
From knowledge of the family car (a database), the family
es�mates that the car will achieve 23 miles per gallon
(mpg) on the highway. The average cost of a gallon of
gasoline is es�mated at $3.80. Using the following model,
they make an
es�mate of gasoline cost.
*Throughout this text, to enlarge the size of the math
equa�ons, please right click on the equa�on and choose
"se�ngs" then "scale all math" to increase the viewing
percentage.
Cost = (trip miles)(cost per gallon)/miles per gallon
=
= $363.48
A mathema�cal model can be used to answer what-if
ques�ons. In the previous example, costs could be
es�mated with a $.30 increase in the price of a gallon of
gas, as shown in
the following:
Cost =
= $392.17
The model could also be used to es�mate the cost of the
trip if the car averaged only 20 miles per gallon, as
shown in the following:
Cost =
= $418.00
Models cannot include all factors that affect the outcome
because many factors cannot be defined precisely. Also,
adding too many variables can complicate the model
without
significantly increasing the accuracy of the predic�on. For
example, on the trip to Florida, the number of miles
driven is affected by the number of rest stops made, the
number of
unexpected detours taken, and the number of lane changes
made. The number of miles per gallon is influenced by
the car's speed, the rate of accelera�on, and the amount
of �me
spent idling in traffic. These variables are not in the
model. The model builder should ask if adding the
variables would significantly improve the model's accuracy
and usefulness.
Processing math: 0%
Technology Forecas�ng; TEDTalks: Chris Anderson—
Technology's Long Tail
6.2 Forecasting
Forecas�ng is an a�empt to predict the future. Forecasts
are usually the result of examining past experiences
to gain insights into the future. These insights o�en take
the form of mathema�cal models that are used to
project future sales, product costs, adver�sing costs, and
more. The applica�on of forecas�ng is not limited to
predic�ng factors needed to operate a business.
Forecas�ng can also be used to es�mate the cost of
living,
housing prices, the federal debt, and the average family
income in the year 2025. For organiza�ons, forecasts
are an essen�al part of planning. It would be illogical to
plan for tomorrow without some idea of what could
happen.
The cri�cal word in the last sentence is "could." Any
competent forecaster knows that the future holds many
possibili�es and that a forecast is only one of those
possibili�es. The difference between what actually happens
and what is predicted is forecas�ng error, which is
discussed later in this chapter. In spite of this poten�al
error, management should recognize the need to proceed
with planning using the best possible forecast and
should develop con�ngency plans to deal with the
possible error. Management should not assume that the
future is predetermined, but should realize that its ac�ons
can help to shape future events. With the proper
plans and execu�on of those plans, an organiza�on can
have some control over its future.
Stages of Forecast Development
The forecas�ng process consists of the following steps:
determining the objec�ves of the forecast, developing
and tes�ng a model, applying the model, considering real-
world constraints on the model's applica�on, and
revising and evalua�ng the forecast (human judgment).
Figure 6.1 illustrates these steps.
Figure 6.1: Steps in forecas�ng
Determining the objec�ves. What kind of informa�on does
the manager need? The following ques�ons should be
considered:
1. What is the purpose of the forecast?
2. What variables are to be forecast?
3. Who will use the forecast?
4. What is the �me frame of the forecast—long or short term?
5. How accurate should the forecast be?
6. When is the forecast needed?
Developing and tes�ng a model. A model should be
developed and then tested to ensure that it is as accurate
as possible. Several techniques including moving average,
weighted
moving average, exponen�al smoothing, and regression
analysis for developing forecas�ng models are discussed
later in this chapter. In addi�on to these quan�ta�ve
approaches, it
is o�en useful to consider qualita�ve factors, which are
also discussed later in this chapter.
Applying the model. A�er the model is tested, historical
data about the problem are collected. These data are
applied to the model, and the forecast is obtained. Great
care should
be taken so that the proper data are used and the model
is applied correctly.
Real-world constraints. Applying any model requires
considera�on of real-world constraints. A model may
predict that sales will double in the next three years.
Management,
therefore, adds the needed personnel and facili�es to
produce the service or good, but does not consider the
impact this increase will have on the distribu�on system.
A so�ware
company expands its product offerings by hiring addi�onal
programmers and analysts, but it does not provide the
capability to install the so�ware on customers' systems. If
a
manufacturer is planning to expand produc�on to address
an increase in demand: Should it consider raw-material
availability? Will compe�tors react by cu�ng prices so
that
Technology
Forecasting
From Title:
TEDTalks: Chris Anderson—Technology’s Long Tai...
(https://fod.infobase.com/PortalPlaylists.aspx?
wID=100753&xtid=48088)
© I f b All Ri ht R d L th 01 56
Processing math: 0%
https://fod.infobase.com/PortalPlaylists.aspx?wID=100753&xtid
=48088
demand is less than expected? Where can the firm find
the skilled labor to do the work? Forecast should not be
taken as fact. A forecast is one scenario that managers
must ground
in reality. A forecast is not a complete answer, but rather
one more piece of informa�on.
Revising and evalua�ng the forecast. The technical
forecast should be tempered with human judgment. What
rela�onships may have changed? In the case of the
electric u�lity
industry, a fundamental change in the rate of growth
greatly affected the accuracy of es�mates for future
consump�on. Forecasts should not be treated as complete
or sta�c.
Revisions should be made as changes take place within
the firm or the environment. The need for revision may
be occasioned by changes in price, product characteris�cs,
adver�sing expenditures, or ac�ons by compe�tors.
Evalua�on is the ongoing exercise of comparing the
forecast with the actual results. This control process is
necessary to a�ain
accurate forecasts.
Highlight: Forecas�ng for Quarry-Front Ice Cream Stand
In a small Midwest town, the Quarry-Front Ice Cream
Stand operates in a small spot of land that is adjacent to
an old stone quarry now used for swimming, and baseball
fields
used for T-ball, Pee Wee, Li�le League, and PONY
league baseball. The owner is preparing a plan to operate
the stand for the coming summer months, which she is
basing
upon informa�on gathered about prior years of opera�on.
1. Objec�ve: The owner needs to forecast demand, so she can
order enough milk product, sprinkles, and other items as well as
schedule enough staff to meet demand. As
expected for an ice cream stand in the Midwest, the demand is
highly seasonal, so the �me period for the forecast is from
early in May when baseball begins un�l Labor Day.
This stand closes for the rest of the year.
2. Developing and Tes�ng the Model: The owner has sales
receipts by day for the last five summers. The owner decides to
use a simple average to project demand for the coming
year. She averages the daily receipts for the 5-year period. As
she tests her forecast with the actual sales data over the past
five years, she finds that her projec�ons are not very
good. As she examines the data, she sees that there are major
differences among the days of the week. For example, demand
on Sunday is much lower. She recalculates the
averages by day of the week, so she has a projec�on for
Monday based upon the average of all Mondays, for Tuesdays
based upon all Tuesdays, etc. Demand on Mondays,
shows big differences; some Mondays are very busy, but others
are not. She is unsure how to u�lize this data, but she moves
forward with a plan based upon the daily forecast.
3. Applying the Model: As the ice cream stand opens, the owner
decides to ask her staff to keep a simple tally for the first month
of opera�ons. She provides each of them with a
sheet that is has a single column with the rows designated by
30-minute increments star�ng at 11:00 a.m. when the Quarry-
Front Ice Cream Stand opens, and ending when it
closes at night 10:00 p.m. The staff is to place a tally mark for
each customer served. As she studies the results, she no�ces
strong demand in the early a�ernoon, which she
deduces is most likely driven by kids from the quarry who want
lunch or a snack. She also no�ces a strong demand in the
evenings, which is associated with teams and baseball
players' parents purchasing a postgame ice cream treat. There is
also a very big demand in early June when the small town has
its homecoming parade and fes�val. The owner
gets the opera�ng schedule from the quarry and for the Baseball
Associa�on to use that data to adjust her inventory and staffing
to be�er meet the pa�erns of demand.
4. Real World Constraints: The quarry and the baseball leagues
are part of real world constraints, but there are other factors as
well. Weather greatly reduces demand because
the quarry may be closed and the baseball games rained out.
Games scheduled before school is dismissed also cut demand
because parents want their kids home early on
weeknights.
Real World Scenarios: 1973 Oil Embargo
In 1973, an oil embargo hit the United States, and energy
prices climbed substan�ally in only a few weeks. The
costs of all forms of energy increased, including gasoline,
natural gas, and electricity. The embargo caused a
na�onwide effort to conserve energy. The demand for
fiberglass insula�on soared; fiberglass companies did not
have
sufficient capacity because their planning models were
based upon much slower growth rates. Higher energy
prices made spending money to conserve energy an
a�rac�ve
investment. Conversely, the growth in demand for
electricity dropped from about 3% annually, to near zero.
In a rela�vely short �me it rebounded to about 1% per
year. The
embargo changed the pa�ern of growth in the industry.
Electrical u�li�es had planned for a significantly higher
growth rate and did not react quickly enough to the
change.
Many u�li�es con�nued to build new power plants. The
result was a surplus of electrical genera�on capacity and
the cancella�on of orders for nuclear power plants.
In the 1990s, the growth rate for electricity rebounded in
part because of the growing demand for computer
technology, including the prolifera�on of computer servers.
Once
again, the forecas�ng models, this �me using the slower
growth rates of the late 1970s and 1980s, underes�mated
the need for electricity. This resulted in a brownout in
some
parts of the United States in the late 1990s and early
2000s.
Application of Models
Before becoming immersed in the details involved with
preparing a forecast, it is important to know that
forecas�ng requires more than developing the model and
performing an
analysis. The results from the model should be tempered
with human judgment. The future is never perfectly
represented by the past, and rela�onships change over
�me. Thus, the
forecast should take into account judgment and experience.
Many techniques exist for developing a forecast. It is
impossible to cover all the techniques effec�vely in a
short �me. En�re books are devoted to forecas�ng, and
some university
students major in forecas�ng as others major in
marke�ng, accoun�ng, or supply chain management. In
the following sec�ons, qualita�ve, �me-series, and
regression analysis
methods of forecas�ng are discussed. Regression analysis
can be used to project �me-series and cross-sec�onal
data. There are several varia�ons of these methods:
Qualita�ve methods
Buildup method
Survey method
Test markets
Panel of experts (Delphi Technique)
Time-series methods
Simple moving average
Weighted moving averageProcessing math: 0%
Forecas�ng involves more than developing a model and
conduc�ng analysis. Because the future may
not accurately represent the past, the results from a model
should take into account the forecaster's
judgment and experience.
©Tyler E Nixon/Flickr/Ge�y Images
Exponen�al smoothing
Regression and correla�on analysis (simple and mul�ple
regression)
Qualitative Methods
Mathema�cal models are known as quan�ta�ve methods,
while more subjec�ve
approaches are referred to as qualita�ve. Although
mathema�cal models are useful
because they help management make predic�ons,
qualita�ve approaches can also be
helpful. Qualita�ve forecasts that are based upon
subjec�ve interpreta�on of historical
data and observa�ons are frequently used. A homeowner
who decides to refinance his
or her home has made an implicit predic�on that home
mortgage rates cannot be
lower, and are likely to remain constant or to increase in
the future. Similarly, a manager
who decides to purchase extra materials because of
uncertainty in supply has made an
implicit predic�on that a strike or other ac�on may
disrupt the flow of materials. There
are many different qualita�ve methods for making
forecasts. The buildup method,
surveys, test markets, and the panel of experts are
discussed briefly, next.
Buildup Method
The buildup method requires star�ng at the bo�om of an
organiza�on and making an
overall es�mate by adding together es�mates from each
element. For example, a
brokerage firm could use this approach to forecast
revenues from stock market
transac�ons. If the buildup method is used for predic�ng
revenue, the first step is to ask
each representa�ve to es�mate his or her revenue. These
es�mates are passed on to
the next-higher level in the organiza�on for review and
evalua�on. Es�mates that
appear too high or too low are discussed with the
representa�ve so that management
can understand the logic that supports the predic�on. If
the representa�ve cannot convince the supervisor, a new
predic�on based upon this discussion is made. The
predic�on is
then passed on to the next level in the organiza�on.
As these subjec�ve judgments are passed up the
organiza�on, they are reviewed and refined un�l they
become, in total, the revenue forecast for the en�re
organiza�on. It is top
management's responsibility to make the final judgment
about the forecast's validity. Once top management has
decided on the forecast, it becomes an input used in
making
capacity, produc�on planning, and other decisions.
Survey Method
In some cases, organiza�ons use surveys to gather
informa�on from external sources. A survey is a
systema�c effort to elicit informa�on from specific groups
and is usually
conducted via a wri�en ques�onnaire, a phone interview,
or the Internet. The target of the survey could be
consumers, purchasing agents, economists, or others. A
survey may
a�empt to determine how many consumers would buy a
new flavor of toothpaste, or consider a maintenance
service that comes to their home to complete minor
repairs on their
car. Currently, surveys of purchasing agents are conducted
to assess the health of the economy. Surveys are o�en
used to prepare forecasts when historical data are not
available, or
when historical data are judged not to be indica�ve of
the future. Surveys can also be used to verify the results
of another forecas�ng technique.
Test Markets
Test marke�ng is a special kind of survey. In a test
market, the forecaster arranges for the placement of a new
or redesigned product in a city believed to be
representa�ve of the
organiza�on's overall market. For example, an …
5
©John W Banagan/Photographer's Choice/Ge�y Images
Supply Chain Management: A Strategic
Perspective
Learning Objec�ves
A�er comple�ng this chapter, you should be able to:
Define supply chain management.
Explain the consequences that occur when informa�on is not
shared, and describe some of the informa�on
that can be shared in a supply chain.
Discuss various op�ons in supply chain structure.
Compare insourcing, outsourcing, and ver�cal integra�on.
Compare agile supply chains to lean supply chains.
Discuss the impact of e-commerce on supply chain management.
Explain how ERP facilitates e-commerce.
Describe some supply chain performance measures.
Discuss global issues in supply chain management.
Apple is the focal firm in its supply chain. A focal firm
is the most
important organiza�on in the supply chain and the firm
that o�en
interfaces with the final consumer.
Pablo Mar�nez Monsivais/ASSOCIATED PRESS/AP Images
5.1 Foundations of Supply Chains
The term supply chain is commonly used to refer to the
network of organiza�ons that par�cipate in producing
goods or providing services. A supply chain encompasses
all ac�vi�es associated with the flow and transfer of
goods and services, from raw material extrac�on through
use by the final consumer. The ac�ons of the par�cipants
in the supply chain are coordinated by the focal firm,
which directs the flow of informa�on much like a
conductor
coordinates the ac�vi�es of an orchestra. The be�er the
focal firm is at moving informa�on among par�cipants,
the be�er the supply chain will perform. The focal firm
is o�en, but not always, the firm that interfaces with the
final consumer. The focal firm designs and manages the
supply chain by selec�ng suppliers. For example, Apple is
the focal firm in its supply chain. Apple is primarily a
product design and marke�ng focused firm with no
manufacturing ac�vi�es, yet it is the focal firm because
its brand dominates the market. There are also cases
where the most important firm does not sell directly to
the consumer. For example, the oil industry is shi�ing
from
a model in which one firm owns the oil fields, pipelines,
refineries, and retail gasoline sta�ons to a model in
which
independent companies operate the retail opera�ons.
Bri�sh Petroleum, commonly known as BP, has been
reducing the number of retail outlets in the United States
for several years. In this example, the company that
owns the refinery and the oil fields is the focal firm
because it controls the key resource in the supply chain.
A supply chain may be contained within a single
organiza�on as shown in Figure 5.1. Exxon Mobil owns
oil fields,
refineries, distribu�on networks, and retail gasoline
sta�ons that deliver fuel to the consumer. Owning
mul�ple
assets in a supply chain is called ver�cal integra�on. The
more assets a company owns, the greater the degree of
ver�cal integra�on.
Figure 5.1: Example of a ver�cally integrated internal supply
chain
Traditional Supply Chains
In most cases, different companies own the assets in a
supply chain as shown in Figure 5.2. For example,
suppose a consumer purchases a DVD player from a
retailer. The retailer
obtained that DVD player through a distributor, which
originally purchased the player from the manufacturer. All
of those different companies, as well as the consumer, are
part of
the supply chain. However, the supply chain does not end
there. The manufacturer purchased component parts from
various �er 1 suppliers, who have purchased materials
from
�er 2 suppliers, such as companies that produce the
chemicals for making plas�c. Finally, those �er 2
suppliers could have also purchased the raw materials to
make those
chemicals from �er 3 suppliers who extract petroleum from
the earth. The supply chain also includes companies that
move these items, such as trucking companies, railroads,
and
shipping companies, as well as warehouses or distribu�on
centers where items may be temporarily stored during
movements within the supply chain. Logis�cs involves
managing
the movement of materials and components from point to
point in the supply chain.
Figure 5.2: Example of an external supply chain
In addi�on to materials, informa�on flows through a
supply chain. If a DVD player model is selling extremely
well and the retailer wants to stock more of them, then
that retailer
provides informa�on to the distributor to ship more of
that model. The distributor informs the manufacturer to
make more, and the manufacturer no�fies its suppliers to
provide
more of the component parts. Ideally, the informa�on
would be shared with the en�re supply chain
simultaneously, not only those companies with which each
member deals
directly. Taking ac�ons to have all members of the
supply chain work together, coordinate their ac�vi�es, and
share informa�on is known as supply chain management.
When it is necessary to return defec�ve products to the
manufacturer for repair or replacement, the process is
known as reverse logis�cs. Reverse logis�cs includes
efforts to reuse
and recycle materials. In Europe, the role of reverse
logis�cs is being expanded beyond tradi�onal recycling.
The no�on is that manufacturers who create a good are
responsible for
it at the end of the product's useful life. This requires
that producers of goods have a vested interest in crea�ng
designs, selec�ng materials, and using manufacturing
processes that
facilitate recycling. Because firms are responsible for the
end-of-life recycling cost, they will make decisions that
lower the cost of recycling. There is no legal requirement
for
companies to do this in the United States, but the idea of
designing to facilitate recycling is sound.
Walmart, Dell, Toyota, and The Home Depot have fine-
tuned their supply chains to provide a strong compe��ve
advantage in terms of service and price. This chapter
discusses how
these companies and others have used supply chain
management to their advantage.
Globaliza�on allows products and services to reach all
corners of the
world and results in increased compe��on. Few companies
have been
as successful at globalizing their brands as Coca-Cola.
©Liu xianglong–Imaginechina/AP Images
Wal-Mart Manages Logis�cs; The Age of Wal-Mart:
Inside America's Most Powerful Company
5.2 Overview of Supply Chain Management
Tradi�onally, each company in a supply chain acted in its
own best interests, not those of the en�re supply chain.
Informa�on was not adequately shared among members of
the supply chain. Only limited informa�on was shared
between a company and its immediate suppliers and
between that company and its customers. As a result,
important decisions including how much to produce, store,
and move along the supply chain were based on local
condi�ons rather than what was best for the supply chain.
Several factors have emerged that encourage companies
to adopt supply chain management as part of their
compe��ve strategy. Those factors are:
Increasing globaliza�on
More intense compe��on
Shorter product life cycles
Developments in informa�on technology and data
communica�on
Globaliza�on has led to new markets, but
also to more companies producing and
selling compe�ng products—Toyota sells cars
in the United States, Intel sells computer
chips worldwide, Goldman Sachs provides
financial services in the United Kingdom, and
Caterpillar sells construc�on equipment in
China. These are but a few examples of the
increase in global compe��on and global
trade since the 1960s. Established markets
have become more compe��ve as
companies iden�fy new ways of winning
market share through process improvements
that lower cost, improve product
performance, and increase product quality.
Some firms have opted to increase market
share by introducing new products. As firms
introduce new products and their
compe�tors respond, market change accelerates and product
life cycles become shorter. This means that new
products must be profitable quickly and pay the needed
return on investment in less �me than prior products.
Be�er supply chain management is one way to do this.
Informa�on and communica�on technologies have
opened up new ways of buying and selling through the
Internet and mobile devices. This has also allowed
companies to obtain and disseminate informa�on much
more rapidly than before, thereby providing the consumer
with more informa�on—not just price and features, but
availability, delivery op�ons and �ming, service a�er the
sale, repair services, and more.
Because of these changes, companies have been forced to
be more compe��ve. Supply chain management can make
a company more compe��ve by coordina�ng all supply
chain
ac�vi�es to ensure that the customer obtains the desired
product at the desired �me for a compe��ve price.
Companies should work together to minimize costs over
the en�re
supply chain, thus benefi�ng all the members. Supply
chain management is the integrated coordina�on of all
components of the supply chain—from raw materials to
the final
customer—so that informa�on and materials flow smoothly.
Wal-Mart
Manages
Logistics
From Title:
The Age of Wal-Mart: Inside America's Most Pow...
(https://fod.infobase.com/PortalPlaylists.aspx?
wID=100753&xtid=39101)
https://fod.infobase.com/PortalPlaylists.aspx?wID=100753&xtid
=39101
5.3 The Role of Information Sharing
Tradi�onally, limited informa�on has been shared between
adjacent supply chain pairs. For example, a retailer may
order a certain number of units from a distributor,
informing the
distributor only of the number of units wanted at that
�me and when those units should be delivered. Very
li�le informa�on, such as expected future changes in
demand, would be
shared between the retailer and the distributor. The small
amount of informa�on that was shared would be shared
only by those two members of the supply chain. This
limited
approach to informa�on sharing does not op�mize the
performance of the supply chain, and can even lead to
detrimental results such as the "bullwhip effect."
The Bullwhip Effect
The bullwhip effect is an example of what can happen
when informa�on is not fully shared in a supply chain or
when forecasts are updated, causing an unan�cipated shi�
in
expected demand. This effect is further complicated by
batching orders that concentrate demand at one point in
�me, price fluctua�ons that change demand, and a�empts
to ra�on
product or otherwise game the system. The bullwhip effect
is caused when a retailer experiences a slight increase in
demand and increases its order quan�ty to avoid running
out
of a product. The distributor also no�ces the increased
order from its customer (the retailer) and, also to avoid
running out, increases its order to the factory by a larger
amount.
The factory, in turn, will further increase its orders to
suppliers of raw materials. The end result is that a slight
increase in demand at the retail level increases nearly
exponen�ally,
crea�ng a huge demand increase at the supplier level, as
shown in Figure 5.3. This increase in demand may cause
the supplier to work over�me, thereby increasing costs.
When the
retailer places the next order, which is the same size as
the prior order (more or less), each par�cipant in the
supply chain will have too much inventory, so a cut back
is required.
The supplier, who overes�mated the most (see Figure
5.3), will dras�cally reduce produc�on. As a result, the
supplier may lay off staff because much of the demand
can be met
from inventory. In this system that uses sequen�al
communica�on, the supplier at the end of the chain is
"whipped" from one extreme to the other, from high
demand requiring
over�me costs to low demand leading to layoffs or excess
inventory. Both of these op�ons increase the supplier's
costs.
Figure 5.3: The bullwhip effect
To avoid problems such as the bullwhip effect,
informa�on must be shared via real-�me communica�on
methods rather than �me delayed, sequen�al
communica�on. The hub and
spoke approach is one way to do this. Each spoke
represents a connec�on to a member of the supply chain.
All members of the supply chain transmit informa�on to
a central hub,
and each member has access to the informa�on. The focal
firm o�en determines the informa�on that must be shared
in this manner. For example, if a company wants to
supply
components to a Chrysler assembly plant, it must provide
the informa�on determined by Chrysler, or the supplier
will not be accepted. By sharing this informa�on, all
supply chain
partners see changes occurring anywhere in the supply
chain, and respond to those changes accordingly. The
following sec�ons indicate some ways for data to be
shared. Electronic
data interchange (EDI) is a method of exchanging relevant
informa�on between suppliers and customers in real �me.
Collabora�ve planning, forecas�ng, and replenishment
(CPFR)
goes beyond the exchange of data to include joint
planning efforts.
Electronic Data Interchange
Electronic data interchange (EDI) connects the databases of
different companies. In one early use, EDI allowed
companies u�lizing material requirements planning (MRP)
to inform
suppliers of upcoming orders by providing them with
access to the database of planned orders. Although this
approach was innova�ve at the �me, it s�ll represented
only limited
sharing of informa�on between adjacent links in the
supply chain. In supply chain management, EDI is a way
to share informa�on among all members of a supply
chain. Shared
databases can ensure that all supply chain members have
access to the same informa�on, providing visibility to
everyone and avoiding problems such as the bullwhip
effect.
Collabora�ve Planning, Forecas�ng, and Replenishment
(CPFR)
Theore�cally, informa�on is shared easily among all
partners in a supply chain. In prac�ce, however, the
process o�en does not work very smoothly. As a result,
members of the
supply chain may make assump�ons about future ac�ons
of other supply chain members. For example, each supplier
must forecast the demand of its customers. Collabora�ve
planning, forecas�ng, and replenishment (CPFR) is a
process that accomplishes more than data exchange. It
seeks to minimize the lack of informa�on through
enabling
collabora�on among supply chain partners that jointly
develop a plan specifying what is to be sold and how,
where, and during what �me period it will be marketed
and promoted.
Sharing of informa�on is facilitated by using a common
set of communica�on standards. All partners are involved
in the development of plans and forecasts for the en�re
group.
Because these plans and forecasts have been jointly agreed
upon, considerable uncertainty is removed from the
process.
Real World Scenarios: Eroski Supermarkets
Eroski operates supermarkets and hypermarkets in Spain
and France. Henkel, a German company, is one of the
suppliers for Eroski stores. Although Henkel had u�lized
EDI with
its customers to improve inventory reordering, Eroski
stores con�nued to run out of Henkel products on a
regular basis. The two companies decided to pursue CPFR,
beginning
with joint demand forecas�ng, which requires them to
work together to es�mate demand. Before implemen�ng
CPFR, about one-half of Henkel's forecasts of demand had
been miscalculated by 50% or more. As a result, Eroski's
supermarkets ran out of Henkel's products. A�er
implementa�on of CPFR, 75% of forecasts were within
20% of actual
demand, and Henkel products were in stock at Eroski
stores 98% of the �me.
Like long-range forecasts offered in the annual Old
Farmer's Almanac, companies also predict
forecasts for the future. The condi�ons predicted can be
drama�cally different from what actually
happens.
©Brian Snyder/Reuters/Corbis
CPFR (pronounced C-P-Far) requires that all supply chain
par�es be commi�ed to
the plans developed jointly and that they be commi�ed to
upda�ng the plan on a
regular basis. A retailer will share informa�on about
demand forecasts and planned
product promo�ons with its suppliers. Likewise, the
suppliers share informa�on
about possible limita�ons on supply or periods during
which produc�on facili�es
may be shut down. Once a plan is developed, suppliers
can begin produc�on
knowing that their customers in the supply chain have
commi�ed to those orders.
Plans must be revisited regularly to ensure that
adjustments are made when
appropriate.
Forecast Accuracy
One problem with sharing informa�on is that some of
that informa�on may not be
accurate, especially forecasts. For example, a retailer may
forecast future sales of a
par�cular clothing line. When demand actually occurs, it
may differ significantly. If
the forecast was too high, then the retailer may be le�
with excess inventory that
must eventually be sold at a loss. On the other hand, a
forecast that is too low can
mean unmet demand and lost sales.
Simply realizing that forecasts are likely to be inaccurate
can lead to improving
supply chain management. For instance, quick response is
one technique that the
fashion industry has developed to address uncertainty in
demand. In general, any
�me a firm can reduce the lead �me between a customer
order and its delivery,
responsiveness is improved and forecas�ng errors become
less relevant.
Historical informa�on about forecast accuracy can be used
to develop a confidence
interval for demand. The supplier may be able to predict
that there is a certain
probability that demand will not vary from the forecast by
more than a specific amount. This informa�on can help
the supplier to plan for a certain range of possible
demand
values.
Real World Scenarios: Walmart
Walmart is one company that has used EDI to improve
forecast accuracy. Vendors who provide products to
Walmart can use Walmart's satellite network system to
directly
access real-�me, point-of-sale (POS) data coming in from
the cash registers at Walmart stores. Vendors can use this
up-to-the-minute informa�on to improve forecasts by
spo�ng trends the moment they occur.
Also, most forecasters know that it is easier to forecast
demand as the �me horizon is shorter. If the supplier has
Walmart's up-to-the-minute demand for Sauder television
stands, it can respond quickly to any demand change.
There is no �me delay in ge�ng an order because Sauder
has the most recent sales data. If Sauder can combine this
with a shorter lead �me—that is, they can be more
responsive—errors in forecas�ng will be less important. If
Sauder takes two weeks from the �me it receives an
order un�l
it delivers the product, a forecas�ng error is more likely
to cause a supply disrup�on than if Sauder can respond
in three days. With a two-week response �me, Sauder's
customer may be out of stock for several days to as
much as two weeks. With a three-day response �me,
Walmart is far less likely to be out of stock, and if an
inventory
shortage occurs, it is likely to be only a day or two
before more inventory arrives at the retail outlet.
Due to low labor costs in developing na�ons, global
outsourcing has dras�cally increased in the past
decade as firms seek to find low-cost suppliers.
iStockphoto/Thinkstock
Striking a Regulatory Balance
5.4 Structure of Supply Chains
As shown in Figure 5.2, the upstream supply chain
includes suppliers, which may be �er 1, �er 2, or �er 3.
Each �er of the upstream supply chain may include
mul�ple suppliers for
the same good or service. The upstream side of the supply
chain also includes produc�on planning and purchasing as
well as logis�cs, which is responsible for moving
materials
between supply chain members. On the downstream side,
supply chain partners are divided into echelons. For
example, echelon 1 includes organiza�ons, such as
distributors,
importers, or exporters that receive the product directly
from the organiza�on that produces it. Echelon 2
organiza�ons would receive the product from those at
echelon 1. Echelon
2 may include retailers, dealers, or final consumers.
It is important to realize that Figure 5.2 is a greatly
simplified diagram of a supply chain. There are many
more organiza�ons that provide required goods and
services and move
materials and informa�on than can be shown in Figure
5.2. How these numerous organiza�ons are arranged and
relate to one another is what determines supply chain
structure.
The next sec�on will briefly discuss how supply chains
can be structured.
Number of Suppliers
At each �er of the upstream supply chain, companies can
decide whether to use many suppliers for a par�cular
good or service or few suppliers. Using many suppliers
o�en allows
a company to take advantage of compe��on among those
suppliers to meet the company's demands for cost, quality,
and delivery. If one supplier goes out of business or is
unable
to provide the good or service as requested, it is a
simple ma�er to use another supplier.
On the other hand, there are some advantages to having
only a few suppliers, or even one supplier for a good or
service. Chief among these is the long-term partnership
arrangements that can be developed. Such rela�onships
enable both par�es to work together for greater
integra�on of the supply chain and for development of
methods that can
improve quality and lower costs. These close partnerships
o�en lead to high levels of dependency between the
customer and the supplier.
Highlight: TMD and Chrysler Toledo Assembly Complex
TMD's Toledo facility is the sole source of instrument
panels for the Jeep Wrangler, which is produced at
Chrysler's Toledo Assembly Complex (CTAC). All of the
output from
TMD's Toledo opera�ons is delivered to CTAC, which is
located less than three miles from the assembly facility,
thereby keeping shipping costs low. Because of close
interac�on
and very short travel �me, the inventory of instrument
panels is enough to sa�sfy demand at CTAC for only a
couple of hours. These two organiza�ons have developed
such a
close rela�onship that there have been very few supply
disrup�ons, administra�ve and accoun�ng costs are low,
and quality is high. The rela�onship has worked well for
both.
Because these companies are highly dependent, they have
worked hard to develop con�ngency plans to deal with
unexpected problems.
Insourcing Versus Outsourcing
Organiza�ons use a wide range of goods and services
when making and delivering
products. If those goods and services are provided by the
organiza�on itself, they
are insourced. Goods and services obtained from outside
suppliers are outsourced.
One reason companies decide to outsource is that the
goods or services can o�en
be obtained less expensively from outside suppliers.
Outside suppliers may
specialize in producing that good or service, enabling
them to maintain high quality
while keeping costs low. Suppliers may have proprietary
technology that provides
them a compe��ve advantage.
In the past decade or
more, global outsourcing
has grown drama�cally
as firms seek to find low-
cost suppliers. This push,
driven primarily by low
labor costs in developing
economies such as
Mexico, China, India, and
Vietnam, has lengthened the supply chain, which increases
transporta�on and inventory costs. With longer supply
chains
as well as poli�cal uncertainty and cultural differences,
there is also an increased risk of supply chain disrup�on.
Yet, the
allure of lower costs is a powerful force. As some of the
disadvantages of global sourcing are being examined,
including
concerns about quality and rising labor costs in some
developing countries, there are signs of produc�on
returning to the
United States. It is too early to tell if these instances are
the beginning of a growing trend. It should be clear that
global
outsourcing is not just a manufacturing phenomenon.
Engineering work, informa�on systems development, and
examina�on of medical images are being outsourced to
developing countries.
Vertical Integration
Supply chain management requires close coordina�on with
suppliers, but if those suppliers are separate organiza�ons,
there may be difficulty coordina�ng among one another.
One
way to promote coordina�on is for a company to own its
suppliers. This is called backward ver�cal integra�on.
Highlight: Henry Ford and Backward Ver�cal Integra�on
The early Ford Motor Company provides a classic example
of backward ver�cal integra�on. Henry Ford believed that
owning his sources of supply was the …
Required Resources
Text
Vonderembse, M. A., & White, G. P. (2013). Operations
management[Electronic version]. Retrieved from
https://content.ashford.edu/
· Chapter 5: Supply Chain Management: A Strategic Perspective
· Chapter 6: Models and Forecasting
Recommended Resources
Article
Terreri, A. (2007). Who’s minding the yard? Food Logistics,
(97), 24-30. Retrieved from the ProQuest database.
Multimedia
July, E. (Producer) & Rodrigo, J. M. (Director).
(2003). Business is blooming: The international floral
industry (Links to an external site.) [Video file]. Retrieved from
the Films On Demand database.
Discussion 1
Suppliers
Should a firm attempt to have fewer or more suppliers? What
are the advantages and disadvantages of each approach? Your
initial post should be 200-250 words.
Discussion 2
Forecasting Methods
Read Problem 6 in Chapter 6 of your textbook. Calculate and
answer parts a through d. Include all calculations and
spreadsheets in your post. Explain why the moving average
method was used instead of another forecasting method. What
might be another forecasting method that could prove to be just
as useful? Your initial post should be 200-250 words.
6©iStockphotoThinkstockModels and ForecastingLear.docx

More Related Content

Similar to 6©iStockphotoThinkstockModels and ForecastingLear.docx

3rd alex marketing club (pharmaceutical forecasting) dr. ahmed sham'a
3rd  alex marketing club (pharmaceutical forecasting) dr. ahmed sham'a3rd  alex marketing club (pharmaceutical forecasting) dr. ahmed sham'a
3rd alex marketing club (pharmaceutical forecasting) dr. ahmed sham'aMahmoud Bahgat
 
CHAPTER Modeling and Analysis Heuristic Search Methods .docx
CHAPTER Modeling and Analysis Heuristic Search Methods .docxCHAPTER Modeling and Analysis Heuristic Search Methods .docx
CHAPTER Modeling and Analysis Heuristic Search Methods .docxtiffanyd4
 
CHAPTER Modeling and Analysis Heuristic Search Methods .docx
CHAPTER Modeling and Analysis Heuristic Search Methods .docxCHAPTER Modeling and Analysis Heuristic Search Methods .docx
CHAPTER Modeling and Analysis Heuristic Search Methods .docxmccormicknadine86
 
Liner programming on Management Science
Liner programming on Management ScienceLiner programming on Management Science
Liner programming on Management ScienceAbdul Motaleb
 
Rethinking Analytics, Analytical Processes, and Risk Architecture Across the ...
Rethinking Analytics, Analytical Processes, and Risk Architecture Across the ...Rethinking Analytics, Analytical Processes, and Risk Architecture Across the ...
Rethinking Analytics, Analytical Processes, and Risk Architecture Across the ...Jacob Kosoff
 
Quality operations management
Quality operations managementQuality operations management
Quality operations managementselinasimpson1901
 
Churn in the Telecommunications Industry
Churn in the Telecommunications IndustryChurn in the Telecommunications Industry
Churn in the Telecommunications Industryskewdlogix
 
DAT 520 Final Project Guidelines and Rubric Overview .docx
DAT 520 Final Project Guidelines and Rubric  Overview .docxDAT 520 Final Project Guidelines and Rubric  Overview .docx
DAT 520 Final Project Guidelines and Rubric Overview .docxsimonithomas47935
 
"Agent-Based Service Analytics" by Dr. Yang Li
"Agent-Based Service Analytics" by Dr. Yang Li"Agent-Based Service Analytics" by Dr. Yang Li
"Agent-Based Service Analytics" by Dr. Yang Li李杨 Dr Yang Li
 
Summary Questions – Sartre, Leopold Put things in your own.docx
Summary Questions – Sartre, Leopold Put things in your own.docxSummary Questions – Sartre, Leopold Put things in your own.docx
Summary Questions – Sartre, Leopold Put things in your own.docxfredr6
 
Decision support systems and their role in rationalizing the production plans
Decision support systems and their role in rationalizing the production plansDecision support systems and their role in rationalizing the production plans
Decision support systems and their role in rationalizing the production plansAlexander Decker
 
CSCE 1040 Homework 2 For this assignment we are going to .docx
CSCE 1040 Homework 2  For this assignment we are going to .docxCSCE 1040 Homework 2  For this assignment we are going to .docx
CSCE 1040 Homework 2 For this assignment we are going to .docxmydrynan
 

Similar to 6©iStockphotoThinkstockModels and ForecastingLear.docx (17)

3rd alex marketing club (pharmaceutical forecasting) dr. ahmed sham'a
3rd  alex marketing club (pharmaceutical forecasting) dr. ahmed sham'a3rd  alex marketing club (pharmaceutical forecasting) dr. ahmed sham'a
3rd alex marketing club (pharmaceutical forecasting) dr. ahmed sham'a
 
Machine learning project
Machine learning project Machine learning project
Machine learning project
 
CHAPTER Modeling and Analysis Heuristic Search Methods .docx
CHAPTER Modeling and Analysis Heuristic Search Methods .docxCHAPTER Modeling and Analysis Heuristic Search Methods .docx
CHAPTER Modeling and Analysis Heuristic Search Methods .docx
 
CHAPTER Modeling and Analysis Heuristic Search Methods .docx
CHAPTER Modeling and Analysis Heuristic Search Methods .docxCHAPTER Modeling and Analysis Heuristic Search Methods .docx
CHAPTER Modeling and Analysis Heuristic Search Methods .docx
 
Liner programming on Management Science
Liner programming on Management ScienceLiner programming on Management Science
Liner programming on Management Science
 
Rethinking Analytics, Analytical Processes, and Risk Architecture Across the ...
Rethinking Analytics, Analytical Processes, and Risk Architecture Across the ...Rethinking Analytics, Analytical Processes, and Risk Architecture Across the ...
Rethinking Analytics, Analytical Processes, and Risk Architecture Across the ...
 
Quality operations management
Quality operations managementQuality operations management
Quality operations management
 
Churn in the Telecommunications Industry
Churn in the Telecommunications IndustryChurn in the Telecommunications Industry
Churn in the Telecommunications Industry
 
DAT 520 Final Project Guidelines and Rubric Overview .docx
DAT 520 Final Project Guidelines and Rubric  Overview .docxDAT 520 Final Project Guidelines and Rubric  Overview .docx
DAT 520 Final Project Guidelines and Rubric Overview .docx
 
Dmml report final
Dmml report finalDmml report final
Dmml report final
 
Employee mode of commuting
Employee mode of commutingEmployee mode of commuting
Employee mode of commuting
 
"Agent-Based Service Analytics" by Dr. Yang Li
"Agent-Based Service Analytics" by Dr. Yang Li"Agent-Based Service Analytics" by Dr. Yang Li
"Agent-Based Service Analytics" by Dr. Yang Li
 
Optimazation
OptimazationOptimazation
Optimazation
 
Manuscript dss
Manuscript dssManuscript dss
Manuscript dss
 
Summary Questions – Sartre, Leopold Put things in your own.docx
Summary Questions – Sartre, Leopold Put things in your own.docxSummary Questions – Sartre, Leopold Put things in your own.docx
Summary Questions – Sartre, Leopold Put things in your own.docx
 
Decision support systems and their role in rationalizing the production plans
Decision support systems and their role in rationalizing the production plansDecision support systems and their role in rationalizing the production plans
Decision support systems and their role in rationalizing the production plans
 
CSCE 1040 Homework 2 For this assignment we are going to .docx
CSCE 1040 Homework 2  For this assignment we are going to .docxCSCE 1040 Homework 2  For this assignment we are going to .docx
CSCE 1040 Homework 2 For this assignment we are going to .docx
 

More from sodhi3

A brief description of your employment historyYour career .docx
A brief description of your employment historyYour career .docxA brief description of your employment historyYour career .docx
A brief description of your employment historyYour career .docxsodhi3
 
A budget is a plan expressed in dollar amounts that acts as a ro.docx
A budget is a plan expressed in dollar amounts that acts as a ro.docxA budget is a plan expressed in dollar amounts that acts as a ro.docx
A budget is a plan expressed in dollar amounts that acts as a ro.docxsodhi3
 
A 72-year-old male with a past medical history for hypertension, con.docx
A 72-year-old male with a past medical history for hypertension, con.docxA 72-year-old male with a past medical history for hypertension, con.docx
A 72-year-old male with a past medical history for hypertension, con.docxsodhi3
 
a able aboutaccomplishaccomplishmentachieveachieving.docx
a able aboutaccomplishaccomplishmentachieveachieving.docxa able aboutaccomplishaccomplishmentachieveachieving.docx
a able aboutaccomplishaccomplishmentachieveachieving.docxsodhi3
 
a brief explanation of the effect of Apartheid in South Africa. Prov.docx
a brief explanation of the effect of Apartheid in South Africa. Prov.docxa brief explanation of the effect of Apartheid in South Africa. Prov.docx
a brief explanation of the effect of Apartheid in South Africa. Prov.docxsodhi3
 
A 32-year-old female presents to the ED with a chief complaint of fe.docx
A 32-year-old female presents to the ED with a chief complaint of fe.docxA 32-year-old female presents to the ED with a chief complaint of fe.docx
A 32-year-old female presents to the ED with a chief complaint of fe.docxsodhi3
 
A 4 years old is brought to the clinic by his parents with abdominal.docx
A 4 years old is brought to the clinic by his parents with abdominal.docxA 4 years old is brought to the clinic by his parents with abdominal.docx
A 4 years old is brought to the clinic by his parents with abdominal.docxsodhi3
 
A 19-year-old male complains of burning sometimes, when I pee.”.docx
A 19-year-old male complains of burning sometimes, when I pee.”.docxA 19-year-old male complains of burning sometimes, when I pee.”.docx
A 19-year-old male complains of burning sometimes, when I pee.”.docxsodhi3
 
A 34-year-old trauma victim, the Victor, is unconscious and on a.docx
A 34-year-old trauma victim, the Victor, is unconscious and on a.docxA 34-year-old trauma victim, the Victor, is unconscious and on a.docx
A 34-year-old trauma victim, the Victor, is unconscious and on a.docxsodhi3
 
A 27-year-old Vietnamese woman in the delivery room with very st.docx
A 27-year-old Vietnamese woman in the delivery room with very st.docxA 27-year-old Vietnamese woman in the delivery room with very st.docx
A 27-year-old Vietnamese woman in the delivery room with very st.docxsodhi3
 
A 25 year old male presents with chronic sinusitis and allergic .docx
A 25 year old male presents with chronic sinusitis and allergic .docxA 25 year old male presents with chronic sinusitis and allergic .docx
A 25 year old male presents with chronic sinusitis and allergic .docxsodhi3
 
A 500-700 word APA formatted PaperInclude 2 sources on your re.docx
A 500-700 word APA formatted PaperInclude 2 sources on your re.docxA 500-700 word APA formatted PaperInclude 2 sources on your re.docx
A 500-700 word APA formatted PaperInclude 2 sources on your re.docxsodhi3
 
A 65-year-old obese African American male patient presents to his HC.docx
A 65-year-old obese African American male patient presents to his HC.docxA 65-year-old obese African American male patient presents to his HC.docx
A 65-year-old obese African American male patient presents to his HC.docxsodhi3
 
A 5-year-old male is brought to the primary care clinic by his m.docx
A 5-year-old male is brought to the primary care clinic by his m.docxA 5-year-old male is brought to the primary care clinic by his m.docx
A 5-year-old male is brought to the primary care clinic by his m.docxsodhi3
 
92 S C I E N T I F I C A M E R I C A N R e p r i n t e d f r.docx
92 S C I E N T I F I C  A M E R I C A N R e p r i n t e d  f r.docx92 S C I E N T I F I C  A M E R I C A N R e p r i n t e d  f r.docx
92 S C I E N T I F I C A M E R I C A N R e p r i n t e d f r.docxsodhi3
 
a 100 words to respond to each question. Please be sure to add a que.docx
a 100 words to respond to each question. Please be sure to add a que.docxa 100 words to respond to each question. Please be sure to add a que.docx
a 100 words to respond to each question. Please be sure to add a que.docxsodhi3
 
A 12,000 word final dissertation for Masters in Education project. .docx
A 12,000 word final dissertation for Masters in Education project. .docxA 12,000 word final dissertation for Masters in Education project. .docx
A 12,000 word final dissertation for Masters in Education project. .docxsodhi3
 
918191ISMM1-UC 752SYSTEMS ANALYSISFall 2019 –.docx
918191ISMM1-UC 752SYSTEMS ANALYSISFall 2019 –.docx918191ISMM1-UC 752SYSTEMS ANALYSISFall 2019 –.docx
918191ISMM1-UC 752SYSTEMS ANALYSISFall 2019 –.docxsodhi3
 
915Rising Up from a Sea of DiscontentThe 1970 Koza.docx
915Rising Up from a Sea of DiscontentThe 1970 Koza.docx915Rising Up from a Sea of DiscontentThe 1970 Koza.docx
915Rising Up from a Sea of DiscontentThe 1970 Koza.docxsodhi3
 
96 Young Scholars in WritingFeminist Figures or Damsel.docx
96    Young Scholars in WritingFeminist Figures or Damsel.docx96    Young Scholars in WritingFeminist Figures or Damsel.docx
96 Young Scholars in WritingFeminist Figures or Damsel.docxsodhi3
 

More from sodhi3 (20)

A brief description of your employment historyYour career .docx
A brief description of your employment historyYour career .docxA brief description of your employment historyYour career .docx
A brief description of your employment historyYour career .docx
 
A budget is a plan expressed in dollar amounts that acts as a ro.docx
A budget is a plan expressed in dollar amounts that acts as a ro.docxA budget is a plan expressed in dollar amounts that acts as a ro.docx
A budget is a plan expressed in dollar amounts that acts as a ro.docx
 
A 72-year-old male with a past medical history for hypertension, con.docx
A 72-year-old male with a past medical history for hypertension, con.docxA 72-year-old male with a past medical history for hypertension, con.docx
A 72-year-old male with a past medical history for hypertension, con.docx
 
a able aboutaccomplishaccomplishmentachieveachieving.docx
a able aboutaccomplishaccomplishmentachieveachieving.docxa able aboutaccomplishaccomplishmentachieveachieving.docx
a able aboutaccomplishaccomplishmentachieveachieving.docx
 
a brief explanation of the effect of Apartheid in South Africa. Prov.docx
a brief explanation of the effect of Apartheid in South Africa. Prov.docxa brief explanation of the effect of Apartheid in South Africa. Prov.docx
a brief explanation of the effect of Apartheid in South Africa. Prov.docx
 
A 32-year-old female presents to the ED with a chief complaint of fe.docx
A 32-year-old female presents to the ED with a chief complaint of fe.docxA 32-year-old female presents to the ED with a chief complaint of fe.docx
A 32-year-old female presents to the ED with a chief complaint of fe.docx
 
A 4 years old is brought to the clinic by his parents with abdominal.docx
A 4 years old is brought to the clinic by his parents with abdominal.docxA 4 years old is brought to the clinic by his parents with abdominal.docx
A 4 years old is brought to the clinic by his parents with abdominal.docx
 
A 19-year-old male complains of burning sometimes, when I pee.”.docx
A 19-year-old male complains of burning sometimes, when I pee.”.docxA 19-year-old male complains of burning sometimes, when I pee.”.docx
A 19-year-old male complains of burning sometimes, when I pee.”.docx
 
A 34-year-old trauma victim, the Victor, is unconscious and on a.docx
A 34-year-old trauma victim, the Victor, is unconscious and on a.docxA 34-year-old trauma victim, the Victor, is unconscious and on a.docx
A 34-year-old trauma victim, the Victor, is unconscious and on a.docx
 
A 27-year-old Vietnamese woman in the delivery room with very st.docx
A 27-year-old Vietnamese woman in the delivery room with very st.docxA 27-year-old Vietnamese woman in the delivery room with very st.docx
A 27-year-old Vietnamese woman in the delivery room with very st.docx
 
A 25 year old male presents with chronic sinusitis and allergic .docx
A 25 year old male presents with chronic sinusitis and allergic .docxA 25 year old male presents with chronic sinusitis and allergic .docx
A 25 year old male presents with chronic sinusitis and allergic .docx
 
A 500-700 word APA formatted PaperInclude 2 sources on your re.docx
A 500-700 word APA formatted PaperInclude 2 sources on your re.docxA 500-700 word APA formatted PaperInclude 2 sources on your re.docx
A 500-700 word APA formatted PaperInclude 2 sources on your re.docx
 
A 65-year-old obese African American male patient presents to his HC.docx
A 65-year-old obese African American male patient presents to his HC.docxA 65-year-old obese African American male patient presents to his HC.docx
A 65-year-old obese African American male patient presents to his HC.docx
 
A 5-year-old male is brought to the primary care clinic by his m.docx
A 5-year-old male is brought to the primary care clinic by his m.docxA 5-year-old male is brought to the primary care clinic by his m.docx
A 5-year-old male is brought to the primary care clinic by his m.docx
 
92 S C I E N T I F I C A M E R I C A N R e p r i n t e d f r.docx
92 S C I E N T I F I C  A M E R I C A N R e p r i n t e d  f r.docx92 S C I E N T I F I C  A M E R I C A N R e p r i n t e d  f r.docx
92 S C I E N T I F I C A M E R I C A N R e p r i n t e d f r.docx
 
a 100 words to respond to each question. Please be sure to add a que.docx
a 100 words to respond to each question. Please be sure to add a que.docxa 100 words to respond to each question. Please be sure to add a que.docx
a 100 words to respond to each question. Please be sure to add a que.docx
 
A 12,000 word final dissertation for Masters in Education project. .docx
A 12,000 word final dissertation for Masters in Education project. .docxA 12,000 word final dissertation for Masters in Education project. .docx
A 12,000 word final dissertation for Masters in Education project. .docx
 
918191ISMM1-UC 752SYSTEMS ANALYSISFall 2019 –.docx
918191ISMM1-UC 752SYSTEMS ANALYSISFall 2019 –.docx918191ISMM1-UC 752SYSTEMS ANALYSISFall 2019 –.docx
918191ISMM1-UC 752SYSTEMS ANALYSISFall 2019 –.docx
 
915Rising Up from a Sea of DiscontentThe 1970 Koza.docx
915Rising Up from a Sea of DiscontentThe 1970 Koza.docx915Rising Up from a Sea of DiscontentThe 1970 Koza.docx
915Rising Up from a Sea of DiscontentThe 1970 Koza.docx
 
96 Young Scholars in WritingFeminist Figures or Damsel.docx
96    Young Scholars in WritingFeminist Figures or Damsel.docx96    Young Scholars in WritingFeminist Figures or Damsel.docx
96 Young Scholars in WritingFeminist Figures or Damsel.docx
 

Recently uploaded

BASLIQ CURRENT LOOKBOOK LOOKBOOK(1) (1).pdf
BASLIQ CURRENT LOOKBOOK  LOOKBOOK(1) (1).pdfBASLIQ CURRENT LOOKBOOK  LOOKBOOK(1) (1).pdf
BASLIQ CURRENT LOOKBOOK LOOKBOOK(1) (1).pdfSoniaTolstoy
 
Class 11th Physics NEET formula sheet pdf
Class 11th Physics NEET formula sheet pdfClass 11th Physics NEET formula sheet pdf
Class 11th Physics NEET formula sheet pdfAyushMahapatra5
 
Activity 01 - Artificial Culture (1).pdf
Activity 01 - Artificial Culture (1).pdfActivity 01 - Artificial Culture (1).pdf
Activity 01 - Artificial Culture (1).pdfciinovamais
 
Russian Escort Service in Delhi 11k Hotel Foreigner Russian Call Girls in Delhi
Russian Escort Service in Delhi 11k Hotel Foreigner Russian Call Girls in DelhiRussian Escort Service in Delhi 11k Hotel Foreigner Russian Call Girls in Delhi
Russian Escort Service in Delhi 11k Hotel Foreigner Russian Call Girls in Delhikauryashika82
 
Holdier Curriculum Vitae (April 2024).pdf
Holdier Curriculum Vitae (April 2024).pdfHoldier Curriculum Vitae (April 2024).pdf
Holdier Curriculum Vitae (April 2024).pdfagholdier
 
Call Girls in Dwarka Mor Delhi Contact Us 9654467111
Call Girls in Dwarka Mor Delhi Contact Us 9654467111Call Girls in Dwarka Mor Delhi Contact Us 9654467111
Call Girls in Dwarka Mor Delhi Contact Us 9654467111Sapana Sha
 
IGNOU MSCCFT and PGDCFT Exam Question Pattern: MCFT003 Counselling and Family...
IGNOU MSCCFT and PGDCFT Exam Question Pattern: MCFT003 Counselling and Family...IGNOU MSCCFT and PGDCFT Exam Question Pattern: MCFT003 Counselling and Family...
IGNOU MSCCFT and PGDCFT Exam Question Pattern: MCFT003 Counselling and Family...PsychoTech Services
 
Accessible design: Minimum effort, maximum impact
Accessible design: Minimum effort, maximum impactAccessible design: Minimum effort, maximum impact
Accessible design: Minimum effort, maximum impactdawncurless
 
Interactive Powerpoint_How to Master effective communication
Interactive Powerpoint_How to Master effective communicationInteractive Powerpoint_How to Master effective communication
Interactive Powerpoint_How to Master effective communicationnomboosow
 
APM Welcome, APM North West Network Conference, Synergies Across Sectors
APM Welcome, APM North West Network Conference, Synergies Across SectorsAPM Welcome, APM North West Network Conference, Synergies Across Sectors
APM Welcome, APM North West Network Conference, Synergies Across SectorsAssociation for Project Management
 
1029 - Danh muc Sach Giao Khoa 10 . pdf
1029 -  Danh muc Sach Giao Khoa 10 . pdf1029 -  Danh muc Sach Giao Khoa 10 . pdf
1029 - Danh muc Sach Giao Khoa 10 . pdfQucHHunhnh
 
The basics of sentences session 2pptx copy.pptx
The basics of sentences session 2pptx copy.pptxThe basics of sentences session 2pptx copy.pptx
The basics of sentences session 2pptx copy.pptxheathfieldcps1
 
Software Engineering Methodologies (overview)
Software Engineering Methodologies (overview)Software Engineering Methodologies (overview)
Software Engineering Methodologies (overview)eniolaolutunde
 
Unit-IV- Pharma. Marketing Channels.pptx
Unit-IV- Pharma. Marketing Channels.pptxUnit-IV- Pharma. Marketing Channels.pptx
Unit-IV- Pharma. Marketing Channels.pptxVishalSingh1417
 
Sanyam Choudhary Chemistry practical.pdf
Sanyam Choudhary Chemistry practical.pdfSanyam Choudhary Chemistry practical.pdf
Sanyam Choudhary Chemistry practical.pdfsanyamsingh5019
 
A Critique of the Proposed National Education Policy Reform
A Critique of the Proposed National Education Policy ReformA Critique of the Proposed National Education Policy Reform
A Critique of the Proposed National Education Policy ReformChameera Dedduwage
 
Key note speaker Neum_Admir Softic_ENG.pdf
Key note speaker Neum_Admir Softic_ENG.pdfKey note speaker Neum_Admir Softic_ENG.pdf
Key note speaker Neum_Admir Softic_ENG.pdfAdmir Softic
 

Recently uploaded (20)

BASLIQ CURRENT LOOKBOOK LOOKBOOK(1) (1).pdf
BASLIQ CURRENT LOOKBOOK  LOOKBOOK(1) (1).pdfBASLIQ CURRENT LOOKBOOK  LOOKBOOK(1) (1).pdf
BASLIQ CURRENT LOOKBOOK LOOKBOOK(1) (1).pdf
 
Class 11th Physics NEET formula sheet pdf
Class 11th Physics NEET formula sheet pdfClass 11th Physics NEET formula sheet pdf
Class 11th Physics NEET formula sheet pdf
 
Activity 01 - Artificial Culture (1).pdf
Activity 01 - Artificial Culture (1).pdfActivity 01 - Artificial Culture (1).pdf
Activity 01 - Artificial Culture (1).pdf
 
Russian Escort Service in Delhi 11k Hotel Foreigner Russian Call Girls in Delhi
Russian Escort Service in Delhi 11k Hotel Foreigner Russian Call Girls in DelhiRussian Escort Service in Delhi 11k Hotel Foreigner Russian Call Girls in Delhi
Russian Escort Service in Delhi 11k Hotel Foreigner Russian Call Girls in Delhi
 
Holdier Curriculum Vitae (April 2024).pdf
Holdier Curriculum Vitae (April 2024).pdfHoldier Curriculum Vitae (April 2024).pdf
Holdier Curriculum Vitae (April 2024).pdf
 
Call Girls in Dwarka Mor Delhi Contact Us 9654467111
Call Girls in Dwarka Mor Delhi Contact Us 9654467111Call Girls in Dwarka Mor Delhi Contact Us 9654467111
Call Girls in Dwarka Mor Delhi Contact Us 9654467111
 
IGNOU MSCCFT and PGDCFT Exam Question Pattern: MCFT003 Counselling and Family...
IGNOU MSCCFT and PGDCFT Exam Question Pattern: MCFT003 Counselling and Family...IGNOU MSCCFT and PGDCFT Exam Question Pattern: MCFT003 Counselling and Family...
IGNOU MSCCFT and PGDCFT Exam Question Pattern: MCFT003 Counselling and Family...
 
Mattingly "AI & Prompt Design: Structured Data, Assistants, & RAG"
Mattingly "AI & Prompt Design: Structured Data, Assistants, & RAG"Mattingly "AI & Prompt Design: Structured Data, Assistants, & RAG"
Mattingly "AI & Prompt Design: Structured Data, Assistants, & RAG"
 
Accessible design: Minimum effort, maximum impact
Accessible design: Minimum effort, maximum impactAccessible design: Minimum effort, maximum impact
Accessible design: Minimum effort, maximum impact
 
Interactive Powerpoint_How to Master effective communication
Interactive Powerpoint_How to Master effective communicationInteractive Powerpoint_How to Master effective communication
Interactive Powerpoint_How to Master effective communication
 
APM Welcome, APM North West Network Conference, Synergies Across Sectors
APM Welcome, APM North West Network Conference, Synergies Across SectorsAPM Welcome, APM North West Network Conference, Synergies Across Sectors
APM Welcome, APM North West Network Conference, Synergies Across Sectors
 
1029 - Danh muc Sach Giao Khoa 10 . pdf
1029 -  Danh muc Sach Giao Khoa 10 . pdf1029 -  Danh muc Sach Giao Khoa 10 . pdf
1029 - Danh muc Sach Giao Khoa 10 . pdf
 
The basics of sentences session 2pptx copy.pptx
The basics of sentences session 2pptx copy.pptxThe basics of sentences session 2pptx copy.pptx
The basics of sentences session 2pptx copy.pptx
 
Mattingly "AI & Prompt Design: The Basics of Prompt Design"
Mattingly "AI & Prompt Design: The Basics of Prompt Design"Mattingly "AI & Prompt Design: The Basics of Prompt Design"
Mattingly "AI & Prompt Design: The Basics of Prompt Design"
 
Software Engineering Methodologies (overview)
Software Engineering Methodologies (overview)Software Engineering Methodologies (overview)
Software Engineering Methodologies (overview)
 
Unit-IV- Pharma. Marketing Channels.pptx
Unit-IV- Pharma. Marketing Channels.pptxUnit-IV- Pharma. Marketing Channels.pptx
Unit-IV- Pharma. Marketing Channels.pptx
 
Sanyam Choudhary Chemistry practical.pdf
Sanyam Choudhary Chemistry practical.pdfSanyam Choudhary Chemistry practical.pdf
Sanyam Choudhary Chemistry practical.pdf
 
A Critique of the Proposed National Education Policy Reform
A Critique of the Proposed National Education Policy ReformA Critique of the Proposed National Education Policy Reform
A Critique of the Proposed National Education Policy Reform
 
Advance Mobile Application Development class 07
Advance Mobile Application Development class 07Advance Mobile Application Development class 07
Advance Mobile Application Development class 07
 
Key note speaker Neum_Admir Softic_ENG.pdf
Key note speaker Neum_Admir Softic_ENG.pdfKey note speaker Neum_Admir Softic_ENG.pdf
Key note speaker Neum_Admir Softic_ENG.pdf
 

6©iStockphotoThinkstockModels and ForecastingLear.docx

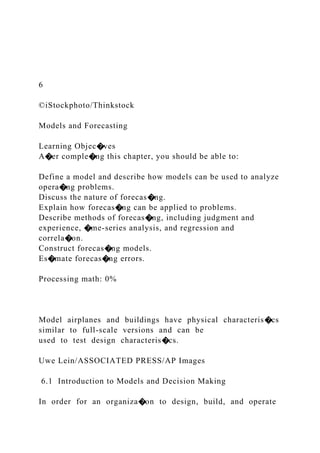
  • 1. 6 ©iStockphoto/Thinkstock Models and Forecasting Learning Objec�ves A�er comple�ng this chapter, you should be able to: Define a model and describe how models can be used to analyze opera�ng problems. Discuss the nature of forecas�ng. Explain how forecas�ng can be applied to problems. Describe methods of forecas�ng, including judgment and experience, �me-series analysis, and regression and correla�on. Construct forecas�ng models. Es�mate forecas�ng errors. Processing math: 0% Model airplanes and buildings have physical characteris�cs similar to full-scale versions and can be used to test design characteris�cs. Uwe Lein/ASSOCIATED PRESS/AP Images 6.1 Introduction to Models and Decision Making In order for an organiza�on to design, build, and operate
  • 2. a produc�on facility that is capable of mee�ng customer demand for services (such as health care) or goods (such as ceiling fans), it is necessary for management to obtain an es�mate or forecast of demand for its products. A forecast is a predic�on of the future. It o�en examines historical data to determine rela�onships among key variables in a problem and uses those rela�onships to make statements about the future value of one or more of the variables. Once an organiza�on has a forecast of demand, it can make decisions regarding the volume of product that needs to be produced, the number of workers to hire, and other key opera�ng variables. A model is an abstrac�on from the real problem of the key variables and rela�onships in order to simplify the problem. The purpose of modeling is to provide the user with a be�er understanding of the problem and with a means of manipula�ng the results for what-if analyses. Forecas�ng uses models to help organiza�ons predict important parameters. Demand is one of those parameters, but cost, revenue, profits, and other variables can also be forecasted. The purpose of this chapter is to discuss models and describe how they can be applied to business problems, and to explain forecas�ng and its role in opera�ons. Stages in Decision Making Organiza�onal performance is a result of the decisions that management makes over a period of �me: decisions about what markets to enter, what products to produce, what types of equipment and facili�es to acquire, and where to
  • 3. locate facili�es. The quality of these decisions is a func�on of how well managers perform (see Table 6.1). Table 6.1: Stages in decision making Stage Example Define the problem and the factors that influence it A hospital is having difficulty maintaining high-quality, low-cost food service. The quality and cost of incoming food and the training of staff are influencing factors. Select criteria to guide the decision; establish objec�ves The hospital selects cost per meal and pa�ent sa�sfac�on as the criteria. The objec�ves are to reduce meal cost by 15% and improve pa�ent sa�sfac�on to 90%, based upon the hospital's weekly surveys. Formulate a model or models The model includes mathema�cal rela�onships that indicate how materials (food) and labor are converted into meals. This model includes an analysis of wasted food and the standard amount of labor required to prepare a meal. Collect relevant data Data on food costs, the amount of food consumed, the number of meals served, and the amount of labor are collected. Pa�ent preferences are inves�gated so that meals meet nutri�onal requirements and taste good.
  • 4. Iden�fy and evaluate alterna�ves Alterna�ves include subcontrac�ng food prepara�on, considering new food suppliers, establishing be�er training programs for the staff, and changing management. Select the best alterna�ve One of the alterna�ves or some combina�on of alterna�ves is selected. Implement the alterna�ve, and reevaluate The selected alterna�ve is implemented, and the problem is reevaluated through monitoring costs and the pa�ent survey data to see if the objec�ves have been achieved. A model is a way of thinking about a problem. Decision makers use models to increase their understanding of the problem because it helps to simplify the problem by focusing on the key variables and rela�onships. The model also allows managers to try different op�ons quickly and inexpensively. In these ways, decision making can be improved. Types of Models Models are commonly seen for airplanes, cars, dams, or other structures. These models can be used to test design characteris�cs. Model airplanes can be tested in wind tunnels to determine aerodynamic proper�es, and a model of a hydroelectric
  • 5. dam can help architects and engineers find ways of integra�ng the structure with the landscape. These models have physical characteris�cs similar to those of the real thing. Experiments can be performed on this type of model to see how it may perform under opera�ng condi�ons. With technology, such as computer simula�on systems, virtual models can be rendered and tested quickly and less expensively. The aerodynamic proper�es of an airplane can be tested in a virtual wind tunnel that exists only inside the memory of a computer. Models also include the drawings of a building that display the physical rela�onships between the various parts of the structure. All of these models are simplifica�ons of the real thing used to help designers make be�er decisions. Computer-based technology has been used for many years to design cars, buildings, furniture, and other products. It is moving quickly into the field of medicine. Medical schools teach students about anatomy using 3-D computer generated models. Students can see the nervous system, the blood vessels, the lymph nodes, and glands along with the skeleton. The so�ware can show each separately and put them all together in one 3-D picture. The so�ware can take input from various medical tests and generate 3-D models of a pa�ent to diagnose medical condi�ons faster and be�er.
  • 6. In addi�on to these physical and virtual models, managers use mathema�cal abstrac�on to model important rela�onships. The break-even point calcula�on that is taught in accoun�ng and finance is an example of applying a mathema�cal model. The use of drawings and diagrams is also modeling. The newspaper graph that illustrates stock market price Processing math: 0% changes in the last six months is a way to help the reader see trends in the market. Models do not have to be sophis�cated to be useful. Most models can be grouped into four categories, and computers play a cri�cal role in the development and use of each type. Mathema�cal models include algebraic models such as break- even analysis, sta�s�cal models used in forecas�ng and quality control, mathema�cal programming models, and calculus-based models. Graphs and charts are pictorial representa�ons of mathema�cal rela�onships. They include a visual representa�on of break- even analysis, a pie chart that illustrates market share, a graph of stock prices over �me, or a bar graph that indicates the demand for energy for the last five years. Diagrams and drawings are pictorial representa�ons of conceptual rela�onships. They include a precedence diagram that represents the sequence required to assemble a building, a drawing of a gear that is part of a transmission in a car, a diagram that represents the logic of a computer program, and a drawing of an aircra� carrier. Scale models and prototypes are physical representa�ons of an
  • 7. item. They include a scale model of an airplane and the first part produced (prototype), which is normally used for tes�ng purposes. These models are o�en built and analyzed inside a computer system. Three-dimensional technology called stereolithography allows computers to create solid models of parts. This is done by successively "prin�ng" very thin layers of a material, which cures quickly to form a sold part. Mathema�cal models, graphs and charts, and diagrams are most commonly used by business and management professionals, so the discussion in this chapter focuses on these types of models. Application of Models Many people use models frequently without realizing it. At a pizza party, the host will probably determine how much pizza to order by mul�plying the number of people expected to a�end by the amount each person is expected to consume. The host is likely to then mul�ply the an�cipated cost per pizza by the number ordered to determine the cost. This is a simple mathema�cal model that can be used to plan a small party or major social event. In mathema�cal models, symbols and algebra are used to show rela�onships. Mathema�cal models can be simple or complex. For example, suppose a family is planning a trip to Walt Disney World in Orlando, Florida. To es�mate gasoline costs for the trip, family members check a road atlas (one type of model), or go online to get direc�ons and a map
  • 8. (another type of model). They determine that Orlando is approximately a 2,200-mile round trip from their home. From knowledge of the family car (a database), the family es�mates that the car will achieve 23 miles per gallon (mpg) on the highway. The average cost of a gallon of gasoline is es�mated at $3.80. Using the following model, they make an es�mate of gasoline cost. *Throughout this text, to enlarge the size of the math equa�ons, please right click on the equa�on and choose "se�ngs" then "scale all math" to increase the viewing percentage. Cost = (trip miles)(cost per gallon)/miles per gallon = = $363.48 A mathema�cal model can be used to answer what-if ques�ons. In the previous example, costs could be es�mated with a $.30 increase in the price of a gallon of gas, as shown in the following: Cost = = $392.17 The model could also be used to es�mate the cost of the trip if the car averaged only 20 miles per gallon, as shown in the following: Cost = = $418.00 Models cannot include all factors that affect the outcome
  • 9. because many factors cannot be defined precisely. Also, adding too many variables can complicate the model without significantly increasing the accuracy of the predic�on. For example, on the trip to Florida, the number of miles driven is affected by the number of rest stops made, the number of unexpected detours taken, and the number of lane changes made. The number of miles per gallon is influenced by the car's speed, the rate of accelera�on, and the amount of �me spent idling in traffic. These variables are not in the model. The model builder should ask if adding the variables would significantly improve the model's accuracy and usefulness. Processing math: 0% Technology Forecas�ng; TEDTalks: Chris Anderson— Technology's Long Tail 6.2 Forecasting Forecas�ng is an a�empt to predict the future. Forecasts are usually the result of examining past experiences to gain insights into the future. These insights o�en take the form of mathema�cal models that are used to project future sales, product costs, adver�sing costs, and more. The applica�on of forecas�ng is not limited to predic�ng factors needed to operate a business. Forecas�ng can also be used to es�mate the cost of living, housing prices, the federal debt, and the average family income in the year 2025. For organiza�ons, forecasts
  • 10. are an essen�al part of planning. It would be illogical to plan for tomorrow without some idea of what could happen. The cri�cal word in the last sentence is "could." Any competent forecaster knows that the future holds many possibili�es and that a forecast is only one of those possibili�es. The difference between what actually happens and what is predicted is forecas�ng error, which is discussed later in this chapter. In spite of this poten�al error, management should recognize the need to proceed with planning using the best possible forecast and should develop con�ngency plans to deal with the possible error. Management should not assume that the future is predetermined, but should realize that its ac�ons can help to shape future events. With the proper plans and execu�on of those plans, an organiza�on can have some control over its future. Stages of Forecast Development The forecas�ng process consists of the following steps: determining the objec�ves of the forecast, developing and tes�ng a model, applying the model, considering real- world constraints on the model's applica�on, and revising and evalua�ng the forecast (human judgment). Figure 6.1 illustrates these steps. Figure 6.1: Steps in forecas�ng Determining the objec�ves. What kind of informa�on does the manager need? The following ques�ons should be considered: 1. What is the purpose of the forecast? 2. What variables are to be forecast?
  • 11. 3. Who will use the forecast? 4. What is the �me frame of the forecast—long or short term? 5. How accurate should the forecast be? 6. When is the forecast needed? Developing and tes�ng a model. A model should be developed and then tested to ensure that it is as accurate as possible. Several techniques including moving average, weighted moving average, exponen�al smoothing, and regression analysis for developing forecas�ng models are discussed later in this chapter. In addi�on to these quan�ta�ve approaches, it is o�en useful to consider qualita�ve factors, which are also discussed later in this chapter. Applying the model. A�er the model is tested, historical data about the problem are collected. These data are applied to the model, and the forecast is obtained. Great care should be taken so that the proper data are used and the model is applied correctly. Real-world constraints. Applying any model requires considera�on of real-world constraints. A model may predict that sales will double in the next three years. Management, therefore, adds the needed personnel and facili�es to produce the service or good, but does not consider the impact this increase will have on the distribu�on system. A so�ware company expands its product offerings by hiring addi�onal programmers and analysts, but it does not provide the capability to install the so�ware on customers' systems. If a manufacturer is planning to expand produc�on to address
  • 12. an increase in demand: Should it consider raw-material availability? Will compe�tors react by cu�ng prices so that Technology Forecasting From Title: TEDTalks: Chris Anderson—Technology’s Long Tai... (https://fod.infobase.com/PortalPlaylists.aspx? wID=100753&xtid=48088) © I f b All Ri ht R d L th 01 56 Processing math: 0% https://fod.infobase.com/PortalPlaylists.aspx?wID=100753&xtid =48088 demand is less than expected? Where can the firm find the skilled labor to do the work? Forecast should not be taken as fact. A forecast is one scenario that managers must ground in reality. A forecast is not a complete answer, but rather one more piece of informa�on. Revising and evalua�ng the forecast. The technical forecast should be tempered with human judgment. What rela�onships may have changed? In the case of the electric u�lity industry, a fundamental change in the rate of growth
  • 13. greatly affected the accuracy of es�mates for future consump�on. Forecasts should not be treated as complete or sta�c. Revisions should be made as changes take place within the firm or the environment. The need for revision may be occasioned by changes in price, product characteris�cs, adver�sing expenditures, or ac�ons by compe�tors. Evalua�on is the ongoing exercise of comparing the forecast with the actual results. This control process is necessary to a�ain accurate forecasts. Highlight: Forecas�ng for Quarry-Front Ice Cream Stand In a small Midwest town, the Quarry-Front Ice Cream Stand operates in a small spot of land that is adjacent to an old stone quarry now used for swimming, and baseball fields used for T-ball, Pee Wee, Li�le League, and PONY league baseball. The owner is preparing a plan to operate the stand for the coming summer months, which she is basing upon informa�on gathered about prior years of opera�on. 1. Objec�ve: The owner needs to forecast demand, so she can order enough milk product, sprinkles, and other items as well as schedule enough staff to meet demand. As expected for an ice cream stand in the Midwest, the demand is highly seasonal, so the �me period for the forecast is from early in May when baseball begins un�l Labor Day. This stand closes for the rest of the year. 2. Developing and Tes�ng the Model: The owner has sales receipts by day for the last five summers. The owner decides to use a simple average to project demand for the coming year. She averages the daily receipts for the 5-year period. As
  • 14. she tests her forecast with the actual sales data over the past five years, she finds that her projec�ons are not very good. As she examines the data, she sees that there are major differences among the days of the week. For example, demand on Sunday is much lower. She recalculates the averages by day of the week, so she has a projec�on for Monday based upon the average of all Mondays, for Tuesdays based upon all Tuesdays, etc. Demand on Mondays, shows big differences; some Mondays are very busy, but others are not. She is unsure how to u�lize this data, but she moves forward with a plan based upon the daily forecast. 3. Applying the Model: As the ice cream stand opens, the owner decides to ask her staff to keep a simple tally for the first month of opera�ons. She provides each of them with a sheet that is has a single column with the rows designated by 30-minute increments star�ng at 11:00 a.m. when the Quarry- Front Ice Cream Stand opens, and ending when it closes at night 10:00 p.m. The staff is to place a tally mark for each customer served. As she studies the results, she no�ces strong demand in the early a�ernoon, which she deduces is most likely driven by kids from the quarry who want lunch or a snack. She also no�ces a strong demand in the evenings, which is associated with teams and baseball players' parents purchasing a postgame ice cream treat. There is also a very big demand in early June when the small town has its homecoming parade and fes�val. The owner gets the opera�ng schedule from the quarry and for the Baseball Associa�on to use that data to adjust her inventory and staffing to be�er meet the pa�erns of demand. 4. Real World Constraints: The quarry and the baseball leagues are part of real world constraints, but there are other factors as well. Weather greatly reduces demand because the quarry may be closed and the baseball games rained out. Games scheduled before school is dismissed also cut demand
  • 15. because parents want their kids home early on weeknights. Real World Scenarios: 1973 Oil Embargo In 1973, an oil embargo hit the United States, and energy prices climbed substan�ally in only a few weeks. The costs of all forms of energy increased, including gasoline, natural gas, and electricity. The embargo caused a na�onwide effort to conserve energy. The demand for fiberglass insula�on soared; fiberglass companies did not have sufficient capacity because their planning models were based upon much slower growth rates. Higher energy prices made spending money to conserve energy an a�rac�ve investment. Conversely, the growth in demand for electricity dropped from about 3% annually, to near zero. In a rela�vely short �me it rebounded to about 1% per year. The embargo changed the pa�ern of growth in the industry. Electrical u�li�es had planned for a significantly higher growth rate and did not react quickly enough to the change. Many u�li�es con�nued to build new power plants. The result was a surplus of electrical genera�on capacity and the cancella�on of orders for nuclear power plants. In the 1990s, the growth rate for electricity rebounded in part because of the growing demand for computer technology, including the prolifera�on of computer servers. Once again, the forecas�ng models, this �me using the slower growth rates of the late 1970s and 1980s, underes�mated the need for electricity. This resulted in a brownout in some
  • 16. parts of the United States in the late 1990s and early 2000s. Application of Models Before becoming immersed in the details involved with preparing a forecast, it is important to know that forecas�ng requires more than developing the model and performing an analysis. The results from the model should be tempered with human judgment. The future is never perfectly represented by the past, and rela�onships change over �me. Thus, the forecast should take into account judgment and experience. Many techniques exist for developing a forecast. It is impossible to cover all the techniques effec�vely in a short �me. En�re books are devoted to forecas�ng, and some university students major in forecas�ng as others major in marke�ng, accoun�ng, or supply chain management. In the following sec�ons, qualita�ve, �me-series, and regression analysis methods of forecas�ng are discussed. Regression analysis can be used to project �me-series and cross-sec�onal data. There are several varia�ons of these methods: Qualita�ve methods Buildup method Survey method Test markets Panel of experts (Delphi Technique) Time-series methods Simple moving average Weighted moving averageProcessing math: 0%
  • 17. Forecas�ng involves more than developing a model and conduc�ng analysis. Because the future may not accurately represent the past, the results from a model should take into account the forecaster's judgment and experience. ©Tyler E Nixon/Flickr/Ge�y Images Exponen�al smoothing Regression and correla�on analysis (simple and mul�ple regression) Qualitative Methods Mathema�cal models are known as quan�ta�ve methods, while more subjec�ve approaches are referred to as qualita�ve. Although mathema�cal models are useful because they help management make predic�ons, qualita�ve approaches can also be helpful. Qualita�ve forecasts that are based upon subjec�ve interpreta�on of historical data and observa�ons are frequently used. A homeowner who decides to refinance his or her home has made an implicit predic�on that home mortgage rates cannot be lower, and are likely to remain constant or to increase in the future. Similarly, a manager who decides to purchase extra materials because of uncertainty in supply has made an implicit predic�on that a strike or other ac�on may disrupt the flow of materials. There are many different qualita�ve methods for making
  • 18. forecasts. The buildup method, surveys, test markets, and the panel of experts are discussed briefly, next. Buildup Method The buildup method requires star�ng at the bo�om of an organiza�on and making an overall es�mate by adding together es�mates from each element. For example, a brokerage firm could use this approach to forecast revenues from stock market transac�ons. If the buildup method is used for predic�ng revenue, the first step is to ask each representa�ve to es�mate his or her revenue. These es�mates are passed on to the next-higher level in the organiza�on for review and evalua�on. Es�mates that appear too high or too low are discussed with the representa�ve so that management can understand the logic that supports the predic�on. If the representa�ve cannot convince the supervisor, a new predic�on based upon this discussion is made. The predic�on is then passed on to the next level in the organiza�on. As these subjec�ve judgments are passed up the organiza�on, they are reviewed and refined un�l they become, in total, the revenue forecast for the en�re organiza�on. It is top management's responsibility to make the final judgment about the forecast's validity. Once top management has decided on the forecast, it becomes an input used in making capacity, produc�on planning, and other decisions.
  • 19. Survey Method In some cases, organiza�ons use surveys to gather informa�on from external sources. A survey is a systema�c effort to elicit informa�on from specific groups and is usually conducted via a wri�en ques�onnaire, a phone interview, or the Internet. The target of the survey could be consumers, purchasing agents, economists, or others. A survey may a�empt to determine how many consumers would buy a new flavor of toothpaste, or consider a maintenance service that comes to their home to complete minor repairs on their car. Currently, surveys of purchasing agents are conducted to assess the health of the economy. Surveys are o�en used to prepare forecasts when historical data are not available, or when historical data are judged not to be indica�ve of the future. Surveys can also be used to verify the results of another forecas�ng technique. Test Markets Test marke�ng is a special kind of survey. In a test market, the forecaster arranges for the placement of a new or redesigned product in a city believed to be representa�ve of the organiza�on's overall market. For example, an … 5 ©John W Banagan/Photographer's Choice/Ge�y Images
  • 20. Supply Chain Management: A Strategic Perspective Learning Objec�ves A�er comple�ng this chapter, you should be able to: Define supply chain management. Explain the consequences that occur when informa�on is not shared, and describe some of the informa�on that can be shared in a supply chain. Discuss various op�ons in supply chain structure. Compare insourcing, outsourcing, and ver�cal integra�on. Compare agile supply chains to lean supply chains. Discuss the impact of e-commerce on supply chain management. Explain how ERP facilitates e-commerce. Describe some supply chain performance measures. Discuss global issues in supply chain management. Apple is the focal firm in its supply chain. A focal firm is the most important organiza�on in the supply chain and the firm that o�en interfaces with the final consumer. Pablo Mar�nez Monsivais/ASSOCIATED PRESS/AP Images 5.1 Foundations of Supply Chains The term supply chain is commonly used to refer to the network of organiza�ons that par�cipate in producing goods or providing services. A supply chain encompasses all ac�vi�es associated with the flow and transfer of goods and services, from raw material extrac�on through use by the final consumer. The ac�ons of the par�cipants
  • 21. in the supply chain are coordinated by the focal firm, which directs the flow of informa�on much like a conductor coordinates the ac�vi�es of an orchestra. The be�er the focal firm is at moving informa�on among par�cipants, the be�er the supply chain will perform. The focal firm is o�en, but not always, the firm that interfaces with the final consumer. The focal firm designs and manages the supply chain by selec�ng suppliers. For example, Apple is the focal firm in its supply chain. Apple is primarily a product design and marke�ng focused firm with no manufacturing ac�vi�es, yet it is the focal firm because its brand dominates the market. There are also cases where the most important firm does not sell directly to the consumer. For example, the oil industry is shi�ing from a model in which one firm owns the oil fields, pipelines, refineries, and retail gasoline sta�ons to a model in which independent companies operate the retail opera�ons. Bri�sh Petroleum, commonly known as BP, has been reducing the number of retail outlets in the United States for several years. In this example, the company that owns the refinery and the oil fields is the focal firm because it controls the key resource in the supply chain. A supply chain may be contained within a single organiza�on as shown in Figure 5.1. Exxon Mobil owns oil fields, refineries, distribu�on networks, and retail gasoline sta�ons that deliver fuel to the consumer. Owning mul�ple assets in a supply chain is called ver�cal integra�on. The more assets a company owns, the greater the degree of ver�cal integra�on.
  • 22. Figure 5.1: Example of a ver�cally integrated internal supply chain Traditional Supply Chains In most cases, different companies own the assets in a supply chain as shown in Figure 5.2. For example, suppose a consumer purchases a DVD player from a retailer. The retailer obtained that DVD player through a distributor, which originally purchased the player from the manufacturer. All of those different companies, as well as the consumer, are part of the supply chain. However, the supply chain does not end there. The manufacturer purchased component parts from various �er 1 suppliers, who have purchased materials from �er 2 suppliers, such as companies that produce the chemicals for making plas�c. Finally, those �er 2 suppliers could have also purchased the raw materials to make those chemicals from �er 3 suppliers who extract petroleum from the earth. The supply chain also includes companies that move these items, such as trucking companies, railroads, and shipping companies, as well as warehouses or distribu�on centers where items may be temporarily stored during movements within the supply chain. Logis�cs involves managing the movement of materials and components from point to point in the supply chain. Figure 5.2: Example of an external supply chain In addi�on to materials, informa�on flows through a supply chain. If a DVD player model is selling extremely
  • 23. well and the retailer wants to stock more of them, then that retailer provides informa�on to the distributor to ship more of that model. The distributor informs the manufacturer to make more, and the manufacturer no�fies its suppliers to provide more of the component parts. Ideally, the informa�on would be shared with the en�re supply chain simultaneously, not only those companies with which each member deals directly. Taking ac�ons to have all members of the supply chain work together, coordinate their ac�vi�es, and share informa�on is known as supply chain management. When it is necessary to return defec�ve products to the manufacturer for repair or replacement, the process is known as reverse logis�cs. Reverse logis�cs includes efforts to reuse and recycle materials. In Europe, the role of reverse logis�cs is being expanded beyond tradi�onal recycling. The no�on is that manufacturers who create a good are responsible for it at the end of the product's useful life. This requires that producers of goods have a vested interest in crea�ng designs, selec�ng materials, and using manufacturing processes that facilitate recycling. Because firms are responsible for the end-of-life recycling cost, they will make decisions that lower the cost of recycling. There is no legal requirement for companies to do this in the United States, but the idea of designing to facilitate recycling is sound.
  • 24. Walmart, Dell, Toyota, and The Home Depot have fine- tuned their supply chains to provide a strong compe��ve advantage in terms of service and price. This chapter discusses how these companies and others have used supply chain management to their advantage. Globaliza�on allows products and services to reach all corners of the world and results in increased compe��on. Few companies have been as successful at globalizing their brands as Coca-Cola. ©Liu xianglong–Imaginechina/AP Images Wal-Mart Manages Logis�cs; The Age of Wal-Mart: Inside America's Most Powerful Company 5.2 Overview of Supply Chain Management Tradi�onally, each company in a supply chain acted in its own best interests, not those of the en�re supply chain. Informa�on was not adequately shared among members of the supply chain. Only limited informa�on was shared between a company and its immediate suppliers and between that company and its customers. As a result, important decisions including how much to produce, store, and move along the supply chain were based on local condi�ons rather than what was best for the supply chain. Several factors have emerged that encourage companies to adopt supply chain management as part of their compe��ve strategy. Those factors are: Increasing globaliza�on
  • 25. More intense compe��on Shorter product life cycles Developments in informa�on technology and data communica�on Globaliza�on has led to new markets, but also to more companies producing and selling compe�ng products—Toyota sells cars in the United States, Intel sells computer chips worldwide, Goldman Sachs provides financial services in the United Kingdom, and Caterpillar sells construc�on equipment in China. These are but a few examples of the increase in global compe��on and global trade since the 1960s. Established markets have become more compe��ve as companies iden�fy new ways of winning market share through process improvements that lower cost, improve product performance, and increase product quality. Some firms have opted to increase market share by introducing new products. As firms introduce new products and their compe�tors respond, market change accelerates and product life cycles become shorter. This means that new products must be profitable quickly and pay the needed return on investment in less �me than prior products. Be�er supply chain management is one way to do this. Informa�on and communica�on technologies have opened up new ways of buying and selling through the Internet and mobile devices. This has also allowed companies to obtain and disseminate informa�on much more rapidly than before, thereby providing the consumer with more informa�on—not just price and features, but availability, delivery op�ons and �ming, service a�er the
  • 26. sale, repair services, and more. Because of these changes, companies have been forced to be more compe��ve. Supply chain management can make a company more compe��ve by coordina�ng all supply chain ac�vi�es to ensure that the customer obtains the desired product at the desired �me for a compe��ve price. Companies should work together to minimize costs over the en�re supply chain, thus benefi�ng all the members. Supply chain management is the integrated coordina�on of all components of the supply chain—from raw materials to the final customer—so that informa�on and materials flow smoothly. Wal-Mart Manages Logistics From Title: The Age of Wal-Mart: Inside America's Most Pow... (https://fod.infobase.com/PortalPlaylists.aspx? wID=100753&xtid=39101) https://fod.infobase.com/PortalPlaylists.aspx?wID=100753&xtid =39101 5.3 The Role of Information Sharing Tradi�onally, limited informa�on has been shared between
  • 27. adjacent supply chain pairs. For example, a retailer may order a certain number of units from a distributor, informing the distributor only of the number of units wanted at that �me and when those units should be delivered. Very li�le informa�on, such as expected future changes in demand, would be shared between the retailer and the distributor. The small amount of informa�on that was shared would be shared only by those two members of the supply chain. This limited approach to informa�on sharing does not op�mize the performance of the supply chain, and can even lead to detrimental results such as the "bullwhip effect." The Bullwhip Effect The bullwhip effect is an example of what can happen when informa�on is not fully shared in a supply chain or when forecasts are updated, causing an unan�cipated shi� in expected demand. This effect is further complicated by batching orders that concentrate demand at one point in �me, price fluctua�ons that change demand, and a�empts to ra�on product or otherwise game the system. The bullwhip effect is caused when a retailer experiences a slight increase in demand and increases its order quan�ty to avoid running out of a product. The distributor also no�ces the increased order from its customer (the retailer) and, also to avoid running out, increases its order to the factory by a larger amount. The factory, in turn, will further increase its orders to suppliers of raw materials. The end result is that a slight increase in demand at the retail level increases nearly
  • 28. exponen�ally, crea�ng a huge demand increase at the supplier level, as shown in Figure 5.3. This increase in demand may cause the supplier to work over�me, thereby increasing costs. When the retailer places the next order, which is the same size as the prior order (more or less), each par�cipant in the supply chain will have too much inventory, so a cut back is required. The supplier, who overes�mated the most (see Figure 5.3), will dras�cally reduce produc�on. As a result, the supplier may lay off staff because much of the demand can be met from inventory. In this system that uses sequen�al communica�on, the supplier at the end of the chain is "whipped" from one extreme to the other, from high demand requiring over�me costs to low demand leading to layoffs or excess inventory. Both of these op�ons increase the supplier's costs. Figure 5.3: The bullwhip effect To avoid problems such as the bullwhip effect, informa�on must be shared via real-�me communica�on methods rather than �me delayed, sequen�al communica�on. The hub and spoke approach is one way to do this. Each spoke represents a connec�on to a member of the supply chain. All members of the supply chain transmit informa�on to a central hub, and each member has access to the informa�on. The focal firm o�en determines the informa�on that must be shared in this manner. For example, if a company wants to supply components to a Chrysler assembly plant, it must provide
  • 29. the informa�on determined by Chrysler, or the supplier will not be accepted. By sharing this informa�on, all supply chain partners see changes occurring anywhere in the supply chain, and respond to those changes accordingly. The following sec�ons indicate some ways for data to be shared. Electronic data interchange (EDI) is a method of exchanging relevant informa�on between suppliers and customers in real �me. Collabora�ve planning, forecas�ng, and replenishment (CPFR) goes beyond the exchange of data to include joint planning efforts. Electronic Data Interchange Electronic data interchange (EDI) connects the databases of different companies. In one early use, EDI allowed companies u�lizing material requirements planning (MRP) to inform suppliers of upcoming orders by providing them with access to the database of planned orders. Although this approach was innova�ve at the �me, it s�ll represented only limited sharing of informa�on between adjacent links in the supply chain. In supply chain management, EDI is a way to share informa�on among all members of a supply chain. Shared databases can ensure that all supply chain members have access to the same informa�on, providing visibility to everyone and avoiding problems such as the bullwhip effect. Collabora�ve Planning, Forecas�ng, and Replenishment (CPFR)
  • 30. Theore�cally, informa�on is shared easily among all partners in a supply chain. In prac�ce, however, the process o�en does not work very smoothly. As a result, members of the supply chain may make assump�ons about future ac�ons of other supply chain members. For example, each supplier must forecast the demand of its customers. Collabora�ve planning, forecas�ng, and replenishment (CPFR) is a process that accomplishes more than data exchange. It seeks to minimize the lack of informa�on through enabling collabora�on among supply chain partners that jointly develop a plan specifying what is to be sold and how, where, and during what �me period it will be marketed and promoted. Sharing of informa�on is facilitated by using a common set of communica�on standards. All partners are involved in the development of plans and forecasts for the en�re group. Because these plans and forecasts have been jointly agreed upon, considerable uncertainty is removed from the process. Real World Scenarios: Eroski Supermarkets Eroski operates supermarkets and hypermarkets in Spain and France. Henkel, a German company, is one of the suppliers for Eroski stores. Although Henkel had u�lized EDI with its customers to improve inventory reordering, Eroski stores con�nued to run out of Henkel products on a regular basis. The two companies decided to pursue CPFR, beginning with joint demand forecas�ng, which requires them to work together to es�mate demand. Before implemen�ng CPFR, about one-half of Henkel's forecasts of demand had
  • 31. been miscalculated by 50% or more. As a result, Eroski's supermarkets ran out of Henkel's products. A�er implementa�on of CPFR, 75% of forecasts were within 20% of actual demand, and Henkel products were in stock at Eroski stores 98% of the �me. Like long-range forecasts offered in the annual Old Farmer's Almanac, companies also predict forecasts for the future. The condi�ons predicted can be drama�cally different from what actually happens. ©Brian Snyder/Reuters/Corbis CPFR (pronounced C-P-Far) requires that all supply chain par�es be commi�ed to the plans developed jointly and that they be commi�ed to upda�ng the plan on a regular basis. A retailer will share informa�on about demand forecasts and planned product promo�ons with its suppliers. Likewise, the suppliers share informa�on about possible limita�ons on supply or periods during which produc�on facili�es may be shut down. Once a plan is developed, suppliers can begin produc�on knowing that their customers in the supply chain have commi�ed to those orders. Plans must be revisited regularly to ensure that adjustments are made when appropriate. Forecast Accuracy
  • 32. One problem with sharing informa�on is that some of that informa�on may not be accurate, especially forecasts. For example, a retailer may forecast future sales of a par�cular clothing line. When demand actually occurs, it may differ significantly. If the forecast was too high, then the retailer may be le� with excess inventory that must eventually be sold at a loss. On the other hand, a forecast that is too low can mean unmet demand and lost sales. Simply realizing that forecasts are likely to be inaccurate can lead to improving supply chain management. For instance, quick response is one technique that the fashion industry has developed to address uncertainty in demand. In general, any �me a firm can reduce the lead �me between a customer order and its delivery, responsiveness is improved and forecas�ng errors become less relevant. Historical informa�on about forecast accuracy can be used to develop a confidence interval for demand. The supplier may be able to predict that there is a certain probability that demand will not vary from the forecast by more than a specific amount. This informa�on can help the supplier to plan for a certain range of possible demand values. Real World Scenarios: Walmart
  • 33. Walmart is one company that has used EDI to improve forecast accuracy. Vendors who provide products to Walmart can use Walmart's satellite network system to directly access real-�me, point-of-sale (POS) data coming in from the cash registers at Walmart stores. Vendors can use this up-to-the-minute informa�on to improve forecasts by spo�ng trends the moment they occur. Also, most forecasters know that it is easier to forecast demand as the �me horizon is shorter. If the supplier has Walmart's up-to-the-minute demand for Sauder television stands, it can respond quickly to any demand change. There is no �me delay in ge�ng an order because Sauder has the most recent sales data. If Sauder can combine this with a shorter lead �me—that is, they can be more responsive—errors in forecas�ng will be less important. If Sauder takes two weeks from the �me it receives an order un�l it delivers the product, a forecas�ng error is more likely to cause a supply disrup�on than if Sauder can respond in three days. With a two-week response �me, Sauder's customer may be out of stock for several days to as much as two weeks. With a three-day response �me, Walmart is far less likely to be out of stock, and if an inventory shortage occurs, it is likely to be only a day or two before more inventory arrives at the retail outlet. Due to low labor costs in developing na�ons, global outsourcing has dras�cally increased in the past decade as firms seek to find low-cost suppliers.
  • 34. iStockphoto/Thinkstock Striking a Regulatory Balance 5.4 Structure of Supply Chains As shown in Figure 5.2, the upstream supply chain includes suppliers, which may be �er 1, �er 2, or �er 3. Each �er of the upstream supply chain may include mul�ple suppliers for the same good or service. The upstream side of the supply chain also includes produc�on planning and purchasing as well as logis�cs, which is responsible for moving materials between supply chain members. On the downstream side, supply chain partners are divided into echelons. For example, echelon 1 includes organiza�ons, such as distributors, importers, or exporters that receive the product directly from the organiza�on that produces it. Echelon 2 organiza�ons would receive the product from those at echelon 1. Echelon 2 may include retailers, dealers, or final consumers. It is important to realize that Figure 5.2 is a greatly simplified diagram of a supply chain. There are many more organiza�ons that provide required goods and services and move materials and informa�on than can be shown in Figure 5.2. How these numerous organiza�ons are arranged and relate to one another is what determines supply chain structure. The next sec�on will briefly discuss how supply chains can be structured. Number of Suppliers
  • 35. At each �er of the upstream supply chain, companies can decide whether to use many suppliers for a par�cular good or service or few suppliers. Using many suppliers o�en allows a company to take advantage of compe��on among those suppliers to meet the company's demands for cost, quality, and delivery. If one supplier goes out of business or is unable to provide the good or service as requested, it is a simple ma�er to use another supplier. On the other hand, there are some advantages to having only a few suppliers, or even one supplier for a good or service. Chief among these is the long-term partnership arrangements that can be developed. Such rela�onships enable both par�es to work together for greater integra�on of the supply chain and for development of methods that can improve quality and lower costs. These close partnerships o�en lead to high levels of dependency between the customer and the supplier. Highlight: TMD and Chrysler Toledo Assembly Complex TMD's Toledo facility is the sole source of instrument panels for the Jeep Wrangler, which is produced at Chrysler's Toledo Assembly Complex (CTAC). All of the output from TMD's Toledo opera�ons is delivered to CTAC, which is located less than three miles from the assembly facility, thereby keeping shipping costs low. Because of close interac�on and very short travel �me, the inventory of instrument panels is enough to sa�sfy demand at CTAC for only a couple of hours. These two organiza�ons have developed
  • 36. such a close rela�onship that there have been very few supply disrup�ons, administra�ve and accoun�ng costs are low, and quality is high. The rela�onship has worked well for both. Because these companies are highly dependent, they have worked hard to develop con�ngency plans to deal with unexpected problems. Insourcing Versus Outsourcing Organiza�ons use a wide range of goods and services when making and delivering products. If those goods and services are provided by the organiza�on itself, they are insourced. Goods and services obtained from outside suppliers are outsourced. One reason companies decide to outsource is that the goods or services can o�en be obtained less expensively from outside suppliers. Outside suppliers may specialize in producing that good or service, enabling them to maintain high quality while keeping costs low. Suppliers may have proprietary technology that provides them a compe��ve advantage. In the past decade or more, global outsourcing has grown drama�cally as firms seek to find low- cost suppliers. This push, driven primarily by low labor costs in developing economies such as Mexico, China, India, and
  • 37. Vietnam, has lengthened the supply chain, which increases transporta�on and inventory costs. With longer supply chains as well as poli�cal uncertainty and cultural differences, there is also an increased risk of supply chain disrup�on. Yet, the allure of lower costs is a powerful force. As some of the disadvantages of global sourcing are being examined, including concerns about quality and rising labor costs in some developing countries, there are signs of produc�on returning to the United States. It is too early to tell if these instances are the beginning of a growing trend. It should be clear that global outsourcing is not just a manufacturing phenomenon. Engineering work, informa�on systems development, and examina�on of medical images are being outsourced to developing countries. Vertical Integration Supply chain management requires close coordina�on with suppliers, but if those suppliers are separate organiza�ons, there may be difficulty coordina�ng among one another. One way to promote coordina�on is for a company to own its suppliers. This is called backward ver�cal integra�on. Highlight: Henry Ford and Backward Ver�cal Integra�on
  • 38. The early Ford Motor Company provides a classic example of backward ver�cal integra�on. Henry Ford believed that owning his sources of supply was the … Required Resources Text Vonderembse, M. A., & White, G. P. (2013). Operations management[Electronic version]. Retrieved from https://content.ashford.edu/ · Chapter 5: Supply Chain Management: A Strategic Perspective · Chapter 6: Models and Forecasting Recommended Resources Article Terreri, A. (2007). Who’s minding the yard? Food Logistics, (97), 24-30. Retrieved from the ProQuest database. Multimedia July, E. (Producer) & Rodrigo, J. M. (Director). (2003). Business is blooming: The international floral industry (Links to an external site.) [Video file]. Retrieved from the Films On Demand database. Discussion 1 Suppliers Should a firm attempt to have fewer or more suppliers? What are the advantages and disadvantages of each approach? Your initial post should be 200-250 words. Discussion 2 Forecasting Methods Read Problem 6 in Chapter 6 of your textbook. Calculate and answer parts a through d. Include all calculations and spreadsheets in your post. Explain why the moving average method was used instead of another forecasting method. What might be another forecasting method that could prove to be just as useful? Your initial post should be 200-250 words.