
Recommended
Recommended
More Related Content
More from mydrynan
More from mydrynan (20)
Recently uploaded
Recently uploaded (20)
CSCE 1040 Homework 2 For this assignment we are going to .docx
- 1. CSCE 1040 Homework 2 For this assignment we are going to design a system to schedule drivers and passengers for rides in the Mean Green EagleLift system For this we will need the following entities, plus collections for each of the entities: Driver, Passenger and Ride. The data for a Driver will contain at least the following: Driver Id (6 digits) Driver Name (20 characters each for first and last name) Vehicle Capacity ( integer value for number of passengers) Handicapped Capable (Boolean) Vehicle Type (compact 2 dr, sedan 4dr, SUV, Van, other) Driver Rating (floating point value 0-5) Available (Boolean) Pets allowed (Boolean) Notes (String – could include days and hours of operation, coverage area, etc) You may add other data needed for your implementation as well as you will need accessor and mutator functions for the data. The data for a Passenger will contain at least: Name (e.g. Fred Smith) ID number (6 digits e.g. 123456) Payment preference (cash, credit, debit) Handicapped (Boolean) Default rating required (floating point)
- 2. Has pets (Boolean) You may add other data needed for your implementation as well as you will need accessor and mutator functions for the data. The data for a Ride (The transaction entity) will contain at least the following: Ride ID (8 digit value auto assigned) Pickup location (string) Pickup Time (Time value) Drop-off location (string) Size of party (whole number) Includes pets (Boolean) Drop-off time (Time value – entered at completion) Status (Active, Completed, Cancelled) Rating by customer (floating point value) You may add other data needed for your implementation as well as you will need accessor and mutator functions for the data. For the collections of each of the 3 Entity Classes identified above you will need to include the ability to: Add Edit Delete Search/Find based on appropriate criteria Print a list of all entries in the specific collection
- 3. Print the details for a single entity (do a find first) Print a list of all Rides for a particular Passenger Print a list of all Rides for a Particular Driver Print a list of all Active (future and current) Rides, all completed rides and all cancelled rides for the Rides collection when you add a Ride you will need to verify that a. the Driver selected is available during the defined time period b. the Driver selected has number of seats sufficient for the passengers c. The Driver has the appropriate pet policy d. The Driver has required Handicapped capability e. the driver has at least the minimum rating preferred by the Passenger Note that a particular Driver could have multiple assignments as long as they do not conflict with dates or times. For this assignment you do not need to worry about verifying availability based on starting and ending locations. You will also need to provide in the Rides collection the ability to print an assignment schedule for a particular Driver or for a particular Passenger of all the active assignments. Also to print a list of Rides based on their status. You should also provide a means to delete all cancelled rides or all completed flights from the menu. You should also
- 4. provide a means to periodically update all rides from active to completed based on time and date. You will need to provide an appropriate menu system that can be multi-level if you like. You will need to load and store the data to a permanent disk file. This can be done automatically when the program starts and ends. You should also want to store after an add, delete or edit to make sure changes to the data are preserved. For this design you will need to turn in the following: A diagram set consisting of: 1. A title page with your name, assignment, course and title 2. a single class diagram showing only the relationships between the entities 3. a set of six individual class diagrams showing the attributes and methods for each of the classes in #2 4. Step by Step pseudo code algorithms for every method defined in every class in the diagram from #2. You do not need to provide pseudo code for simple accessor and mutator functions (i.e. sets and gets) 5. A 1-2 paragraph report about your design experience.
- 5. All of theseitems should be gathered together, in order, in a single PDF File that you will turn in on Canvas for the design, and a separate PDF for the report. That is a total of 2 documents. NOTE: This assignment is for the design only Nothing you turn in should look like C/C++ code -538- Inzinerine Ekonomika-Engineering Economics, 2014, 25(5), 538–548 Finding a New Way to Increase Project Management Efficiency in Terms of Time Reduction Seweryn Spalek Silesian University of Technology Gliwice, Poland E-mail. [email protected] http://dx.doi.org/10.5755/j01.ee.25.5.8419 There are three basic constraints called ‘the golden triangle’ in each project: time, budget and scope. Researchers and practitioners are trying to find a way to increase the efficacy of
- 6. the project’s outcomes in terms of shortening the project’s duration, lowering budgetary costs and meeting the scope. Although several publications have been written on that topic, there is still no common solution in place. However, more in- depth research related to the specific type of projects or industries is being conducted and this paper seeks to incorporate additional knowledge into that contemporary field. Furthermore, this is of growing importance in modern, turbulent times, where the expectations of profiting from lessons learned are ever increasing. Following the current market demands, in the article a new, innovative approach is proposed to manage the expectation that future projects will have a shorter duration. Therefore, the idea of creating specific roadmaps is proposed, which should help the decision makers improve the efficacy of project management in the company, where the process of such improvement is measured using the maturity levels assessment concept. Based on the world-wide quantitative studies in the construction, information technology and machinery industries, specific roadmaps for each industry were determined. The purpose of these roadmaps is to indicate the most effective investment sequence in the increase of project management maturity, which should result in a decrease of future projects’ duration. Moreover, discussions on the limitations of such
- 7. investments are examined. Keywords: Investment, Time pressure, Company, Projects, Improvement, PM, Implementation of Strategies, Knowledge, Innovation. Introduction Three of the world’s most recognized Latin words, “Citius, Altius, Fortius,” meaning “Faster, Higher, Stronger”, have been the Olympic motto since 1894. At the time: Pierre de Coubertin proposed the motto, having borrowed it from his friend Henri Didon, a Dominican priest who taught sport close to Paris (IOC, 2007, p. 5). These three words encourage the athlete to give his or her best during competition. To better understand the motto, we can compare it with the Olympic creed: “The most important thing in life is not the triumph, but the fight; the essential thing is not to have won, but to have fought well.” Together, the Olympic motto and the creed represent an ideal that Coubertin believed in and promoted as an important life lesson that could be gained from
- 8. participation in sport and the Olympic Games: that giving one’s best and striving for personal excellence was a worthwhile goal. It is a lesson that can still be applied equally today, not just to athletes but to each one of us (IOC, 2007, p. 5). Modern project management has its roots (Lenfle and Loch, 2010, p. 33) in the atomic bomb Manhattan project (Morris, 1994, p. 18) and the ballistic missile projects, Atlas and Polaris (Kerzner, 2013). The term “modern project management” is used by some authors and relates mostly to the project management approach started in the 1950s and continuing through today (Chen et al., 2011; Hill, 2004; Lenfle & Loch, 2010; Shenhar, 2001). Remarkably, from the very beginning of contemporary project management, projects were, and continue to be, under similar time pressure (Campos Silva et al., 2012; Chen et al., 2012; Griffin, 1993, 1997; Herroelen & Leus, 2005; Omorede et al., 2013; Radziszewska-Zielina, 2010; Zavadskas et al., 2010). Kach and colleagues (2012, p.
- 9. 377) state: The speed of technological change and shortened product life cycles have made the time-to-market requirements for developing new products increasingly stringent (Kessler and Chakrabarti, Langerak et al., 2010; Heightened competitive forces have motivated many firms to move their new products through the design and manufacturing pipeline at a faster rate, encouraging greater focus on accelerated development and compressed time lines (Prasnikar & Skerlj, 2006; Wright et al., 1995). The above statement for NPD (new product development) projects can be applied to most projects, whatever their nature. In our current, turbulent times, the pressure of time seems to increase to an ever greater extent. Project managers and their teams experience similar pressure to athletes: to beat the record and to go faster and faster. The first word, “Citius”, of the Olympic hendiatris1 seems to dominate projects managed by 1 Hendiatris is a figure of speech in which three words are used to
- 10. emphasize one idea, for example, Wine, women, and song. Hendiatris is often used to create mottos for organizations; for example, The motto at West Point is “Duty, Honor, Country.” see K. Wilson and J. Wauson, the AMA handbook of business writing: the ultimate guide to style, grammar, Inzinerine Ekonomika-Engineering Economics, 2014, 25(5), 538–548 - 539 - companies today. The majority of project stakeholders (executives, sponsors, clients, managers) expect new projects to be completed faster than ever. Moreover, companies are always careful about spending money. Therefore, they also want to know where to invest their typically limited funds. This issue also arises when deciding where to invest to shorten the time of future projects.
- 11. This paper gives new insight into the dilemma of where and when to invest limited company funds to achieve the best approach to time reduction of future projects. (R)evolution in Managing Projects Project management has evolved throughout history. This evolution has occurred mostly due to the tools and techniques applied to single projects and the gradual improvement of human resource management (Avots, 1969). This situation lasted until the 1990s, when the number of projects executed by companies increased. Moreover, companies’ operating environments became turbulent (Keil & Mahring, 2010). Furthermore, the influence of project outcomes on the success of an entire company increased (Baron & Hannan, 2002). As a result, companies placed a greater emphasis on project management. To speed up time-to-market, companies experienced increased pressure to reduce the duration of projects. The existing methods for reducing the time of
- 12. ongoing single projects (e.g., application of modern scheduling techniques supported by computer technology) (Brucker et al., 1999; Iacovou & Dexter, 2004) are significant; however, they are no longer sufficient. A new, more efficient and revolutionary approach to managing companies’ portfolios of projects was needed (Cooper et al., 1999). This need generated new approaches for how to better manage projects to face the new challenges appearing in multi-project (Hofman, 2014), dynamic environments (Spalek, 2013). Accordingly, new concepts in project management were introduced, focusing on project environment and knowledge management (del Cano and de la Cruz, 2002; Ethiraj et al., 2005; Neverauskas and Stankevicius, 2008; Pemsel & Wiewiora, 2013). Among these concepts is the idea of assessing the maturity level of project management in the company (Cooke-Davies, 2007; Fraser et al., 2003; Spalek, 2014; Tan et al., 2011). Assessing Maturity: the Purpose
- 13. To gain competitive advantage in executing projects, companies wanted to know how well they manage projects while taking into consideration different aspects influencing the effective execution of projects (Kerzner, 2013; Rudzianskaite-Kvaraciejiene et al., 2010). The assessment outcomes should note the areas for potential improvement (Ahmad et al., 2013). This expectation can be fulfilled by project management maturity assessment. There are several existing models of maturity assessment; however, their main purpose remains the same: to identify weak and usage, punctuation, construction, and formatting (New York: American Management Association, 2010, p. 216). strong areas in an organization (Belt et al., 2009). By knowing its strengths and weaknesses, a company can undertake actions to improve activities related to the management of projects, resulting in an increased maturity level and improved project outcomes.
- 14. The majority of existing models assess project management maturity level on a scale from 1 to 5, where 1 represents the lowest and 5 the highest level (Khoshgoftar & Osman, 2009). The assessment is performed in different areas related to project management. Therefore, the assessment results in a matrix with maturity scores and testing areas (Spalek, 2011). Increasing Maturity: the Investment in the Future It is critical to understand that an increase of maturity level will mostly benefit future projects. Increasing by one maturity level up also has some impact, however limited, on existing projects. Because the planning phase in each project is crucial (Wyrozebski & Spalek, 2014), the biggest possible improvements are associated with future projects. There is even a well–known quotation saying2: “Show me how your project starts and I can tell you how it will end.” If the level of maturity is increased, e.g., from level 1 to 2, the outcomes of that action will be beneficial in new
- 15. projects. For existing projects, it will usually be too late to have an impact. Therefore, the decision to assess and then increase the project management maturity level in a company is an investment in future projects. Investment “in maturity” is time consuming and money intensive; therefore, to achieve the highest possible time reduction of future projects, it is crucial to decide where and when (in which sequence) a company investment should be placed. Moreover, a company’s investment funds are often very limited, making the issue even more important. Therefore, it is essential for companies today to have a road map guiding decision makers on the following topic: “In which areas and in what sequence should limited funds be most effectively invested in my company?”. The Research Method The prediction of the future is a complex issue (Glenn
- 16. & Gordon, 2003), often involving various methods and techniques, and thus has a wide record in publications.(Booth, 2006; Galbraith & Merrill, 1996; Lacher et al., 1995; Landeta, 2006; Onkal et al., 2013). To predict reduction of the future time of projects, questionnaire-based cross-impact analysis was used following the ideas presented by Fabiana Scapolo and Ian Miles (2006, p. 680–681). The method included the following steps: the object of studies; 2 Author unknown, also exists as: “Show me how your project starts and I can tell you how it will finish” or “Show me how your project starts and I show you how it will end”.
- 17. Seweryn Spalek. Finding a New Way to Increase Project Management Efficiency in Terms of Time Reduction - 540 - Three Industries: Construction, Information Technology and Machinery The research presented in this article was part of a larger effort supported by the National Science Centre, focusing on world-wide studies of maturity in project management in the chosen industries. The overall research was designed in two major steps. The first step was to conduct quantitative empirical studies on project management maturity levels in three types of industries: machinery, construction and information technology. Data from 447 global companies, mostly medium- and large-sized ones, was collected. Ninety-eight per cent of them earned over € 2,000,000 per year, and 99,5 % of them employed over 49 people. The second step, which is discussed in this study, was designed to investigate the relationship between the
- 18. increase in maturity level in project management and the predicted duration of forthcoming projects. The Assessment For the purpose of this study, a model was used that assesses the company’s project management maturity in four areas (Spalek, 2011): 2000); 3; Killen & Kjaer, 2012); 2011). The description of the maturity assessment areas is shown in table 1. Table 1 Project Management Maturity Assessment Areas ID Area Description 1. Human Resources staffing, career paths, motivation, training, team work
- 19. 2. Methods (incl. Tools & Techniques) methods, tools, techniques and means used for project planning and execution; risk, requir ements, scope, costs, time and quality management 3. Environment organizational structures, top management support, stakeholders’ management, company culture 4. Knowledge Management lessons learned approach, gathering data and experience for on-going operations and future references In the applied project management maturity model the results of the assessment are reported from level 1 to 5: -improvement. The experts were asked to express their opinion on an increase of maturity level by one increment (from 1 to 2, from 2 to 3, etc.) and how it influences the time reduction
- 20. of future projects in their companies. The possible impact was measured on a scale from 1 to 5, as shown in table 2. The assessment was made separately in each testing area. Table 2 The Impact on Time Reduction on Future Projects Impact Level Description 1 No influence 2 1–10 % 3 11–20 % 4 21–30 % 5 over 30 % In our study, the experts were practitioners from the investigated companies. The invitation to participate in this study was sent to 308 chosen experts as a follow-up to the major global study on project management maturity. The experts were chosen based on the demographic information obtained in the first step of the overall research. They were experienced managers that had at least five years of experience and possessed a deep knowledge of the projects
- 21. executed in their companies. Moreover, the invitations were sent to experts from companies that reported a maturity level of at least 2 in each of the testing areas. The response rate was 63 %. Such a high rate was obtained as there were individually approached named persons who expressed, in the first step of overall research, their willingness to participate in the second step of the studies. Non-response bias was tested by comparing the demographic data of participating and non-participating experts. No significant difference was found, proving that survey respondents represent the overall sample accurately. Results and Discussion Data from 39 information technology, 48 construction and 107 machinery industry global companies was collected. The reliability of data was checked using Cronbach’s alpha, resulting in a value of over 0,9 in each testing area. Data analysis using mean, median and mode values was performed. The equality of variances was tested using
- 22. Levene's test and the equality of means using a t-test, and satisfactory results were obtained as the significance for Levene’s test was greater than 0,05. Additionally, Spearman's rho correlation coefficients and factor analysis using rotated component matrix were calculated for further rigid data analyses. The data analysis was performed using Statistical Package for the Social Sciences (IBM SPSS build V21.0.0). The results revealed differences in the predicted impact of change in maturity level on the duration of future projects. This level of impact depended on the specific change in the designated area of assessment (e.g., a change from level 1 to 2 in the knowledge management area) and varied between industries. The Impact on Future Projects: by Maturity Area and Type of Industry The data analysis revealed that the dispersion of the acquired data is low; consequently, the mean value was
- 23. chosen to explain the results. Using the mean value allows Inzinerine Ekonomika-Engineering Economics, 2014, 25(5), 538–548 - 541 - the results to be presented more clearly, without going into deep statistical details and allows the development of a full, more comprehensive picture. The mean values of impact on the future projects are shown in table 3. The Impact on Future Projects by Industry (CONS, IND, IT) and Change of Maturity Level in the Areas of Methods (M), Human Resources (HR), Project Environment (E) and Knowledge Management (KM). Table 3 Statistics (Mean Value of Impact on Future Projects) M 1–2 M 2–3
- 25. E 4–5 KM 1–2 KM 2–3 KM 3–4 KM 4–5 CONS 3,96 3,96 3,21 2,46 3,96 3,96 3,21 2,46 3,21 3,21 2,46 1,71 3,21 3,21 2,46 1,71 IND 3,88 3,88 3,16 2,44 3,88 3,88 3,16 2,44 3,16 3,16 2,44 1,72 3,16 3,16 2,44 1,72 IT 3,90 3,90 3,15 2,41 3,90 3,90 3,15 2,41 3,87 3,87 3,13 2,38 3,87 3,87 3,13 2,38 The impact on future projects depends on the type of industry. The highest impact levels (3,96) were observed for the change from level 1 to 2 and from 2 to 3 in the methods (M) and human resources (HR) areas in the
- 26. construction industry (CONS). The lowest impact (1.71) also appeared in the construction industry; however, it was observed in the areas of environment (E) and knowledge management (KM) for the change of maturity from level 4 to 5. Note, in each type of the studied industries, the potential impact on future projects is the highest if the company is at the initial (1) or standardized (2) level of maturity in project management and wants to increase it by going one level up. This observation is true for each assessment area: methods, human resources, environment and knowledge management. When a company reports already having appliance (3) or system management (4), maturity levels and wants to increase it by one level, the impact on future projects’ duration subsequently decreases. However, this reduction is greater in the construction and machinery industries than in information technology companies. Therefore, which project management maturity area the company should first invest funds in to reduce the future project’s duration
- 27. depends on the type of industry. Moreover, the investment sequence depends on the current level of maturity in the company in each testing area, meaning that for a chosen industry, one should consider a different roadmap, showing where and in which sequence the investment in project management maturity should be placed. Different Industries, Different Approach? This study on the influence of the increase of project management maturity on future projects’ time reduction was focused on three types of industries: that has projects that are, to some extent, inherited in its long history. The projects associated with these sectors are described and considered by numerous authors (Davies et al., 2009; Dominguez et al., 2009). of which are admittedly spread throughout the globe. The IT projects are described and discussed for many different types, such as agile (Thomke and Reinertsen, 1998) or Internet projects (Mahadevan, 2000).
- 28. s in the background of the above two industries as well as many others, is present in many countries and is a backbone industry for the other sectors. Therefore, its importance for the global economy is very high. However, a limited amount of research in this particular sector can be found in the literature. The examples are mostly qualitative case studies describing new product development (NPD) practices (Ahmad et al., 2013; Huang et al., 2004; Matsui et al., 2008), which are crucial for machinery industry companies. The Investment Road Map: The Idea Based on the factor analysis (as shown in Table 4), a road map is proposed showing the investment path in maturity areas, which should result in the biggest pay-offs in reduction of time in future projects. Analysing the groups of factors in the table, the proposed roadmaps for the companies was built. This road map operates in the areas of methods and techniques (M), human resources (HR), project environment (E) and project knowledge
- 29. management (KM), as well as the associated change in level of maturity (e.g., from 2 to 3), which is noted, for example, as follows: M 2–3 (the change in maturity from level 2 to 3 in the area of methods and techniques). In general, note that at the beginning of the road map, the investment has the biggest impact on the duration of future projects and subsequently decreases along the way. Table 4 Factor Analysis Rotated Component Matrixa,b Component 1 2 3 M2-3 ,964 ,245 -,088 HR1-2 ,964 ,245 -,088 HR2-3 ,964 ,245 -,088 M1-2 ,964 ,245 -,088 HR3-4 ,953 ,265 ,146
- 30. E1-2 ,953 ,265 ,146 KM2-3 ,953 ,265 ,146 KM1-2 ,953 ,265 ,146 E2-3 ,953 ,265 ,146 M3-4 ,953 ,265 ,146 M4-5 ,719 ,253 ,648 HR4-5 ,719 ,253 ,648 E3-4 ,719 ,253 ,648 KM3-4 ,719 ,253 ,648 KM4-5 -,019 ,093 ,992 E4-5 -,019 ,093 ,992 Extraction Method: Principal Component Analysis. Rotation Method: Varimax with Kaiser Normalization. a. BRANCH=CONS; b. Rotation converged in 18 iterations Rotated Component Matrixa,b Component 1 2 3 HR1-2 ,964 ,250 -,074
- 31. HR2-3 ,964 ,250 -,074 Seweryn Spalek. Finding a New Way to Increase Project Management Efficiency in Terms of Time Reduction - 542 - Rotated Component Matrixa,b Component 1 2 3 M1-2 ,964 ,250 -,074 M2-3 ,964 ,250 -,074 E2-3 ,945 ,265 ,191 KM2-3 ,945 ,265 ,191 E1-2 ,945 ,265 ,191 M3-4 ,945 ,265 ,191 KM1-2 ,945 ,265 ,191 HR3-4 ,945 ,265 ,191 KM4-5 -,102 ,049 ,990 E4-5 -,102 ,049 ,990
- 32. KM3-4 ,641 ,226 ,733 HR4-5 ,641 ,226 ,733 M4-5 ,641 ,226 ,733 E3-4 ,641 ,226 ,733 Extraction Method: Principal Component Analysis. Rotation Method: Varimax with Kaiser Normalization. a. BRANCH=IND; b. Rotation converged in 18 iterations. Rotated Component Matrixa,b Component 1 2 3 HR1-2 ,947 ,148 ,272 HR2-3 ,947 ,148 ,272 M1-2 ,947 ,148 ,272 M2-3 ,947 ,148 ,272 KM2-3 ,934 ,190 ,297 E2-3 ,934 ,190 ,297 E1-2 ,934 ,190 ,297
- 33. KM1-2 ,934 ,190 ,297 HR3-4 ,817 ,227 ,519 M3-4 ,817 ,227 ,519 E3-4 ,783 ,284 ,543 KM3-4 ,783 ,284 ,543 HR4-5 ,288 ,327 ,891 M4-5 ,288 ,327 ,891 E4-5 ,254 ,387 ,872 KM4-5 ,254 ,387 ,872 Extraction Method: Principal Component Analysis. Rotation Method: Varimax with Kaiser Normalization. a. BRANCH=IT; b. Rotation converged in 9 iterations. The Investment Road Map: Construction Industry The construction sector is one of the largest industries traditionally associated with using project management. The proposed road map revealed that the biggest pay-off is associated with an increase of maturity level from 1 to 2 and from 2 to 3 in the methods (M 1–2, M 2–3) and human
- 34. resources areas (HR 1–2, HR 2–3). The road map can be described in the following four steps: Step One Assuming that the company is at an initial (1) maturity level in all areas, the first step in investment should be an increase of maturity in the methods (M) and human resources areas (HR) until they reach the level 3. Step Two Then, in the second step, the investment should be placed in gradually reaching level 3 in the environment and knowledge management areas (E 1–2, E 2–3, KM 1–2, KM 2–3), and the increase in methods and human resources should continually increase until they reach level 4 (HR 3–4, M 3–4). Step Three The third step should include activities improving the maturity in the environment and knowledge management areas until they report level 4 (E 3–4, KM 3–4) and the
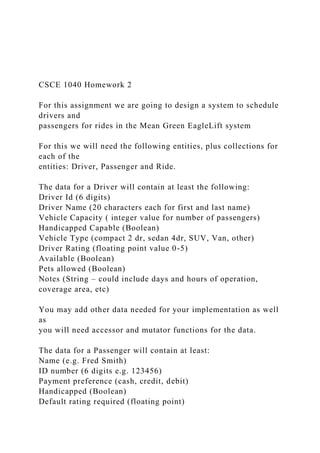
- 35. methods and human resources areas until level 5 (M 4–5, HR 4–5). Step Four Finally, in the fourth step, the increase should be from level 4 to 5 in the environment and knowledge management areas (E 4–5, KM 4–5). Figure 1 shows the investment road map for the construction industry. Figure 1. Investment road map for the construction industry
- 36. M 1–2, M 2–3, HR 1–2, HR 2–3 E 1–2, E 2–3, KM 1–2, KM 2–3, HR 3–4, M 3–4 E 3–4, KM 3–4, M 4–5, HR 4–5 E 4–5, KM 4–5
- 37. STEP 1 STEP 2 STEP 3 STEP 4 Inzinerine Ekonomika-Engineering Economics, 2014, 25(5), 538–548 - 543 - Comparing Steps in Construction Companies: the Reduction of Impact Remarkably, if assuming that in the first step, the impact on reduction of time of future projects is 100, then in the second step, it equals 81; in the third, 62; and in the fourth, 43. This information is useful for investments in a specific company, as companies in the same industry differ from one another. After performing the first step, the total investment and detailed impact on a project’s duration can be measured. Then, knowing the predicted reduction of impact, one can estimate the possible outcomes in the second step toward the investment effort and decide if it is worth it to proceed. The same approach can be performed before step three and four.
- 38. Following this advice means, of course, that time gaps are needed between successive steps to reassess the situation. The Investment Road Map: Information Technology After construction, the second industry traditionally associated with the project management sector is information technology (IT). Moreover, both industries report a long project management application history. The investment road map for information technology consists of six steps. Step One In step one, the investment in increasing project management maturity levels should be performed to go from level 1 to 2 and from 2 to 3 in the methods and human resources areas (M 1–2, M 2–3, HR 1–2, HR 2–3). Step Two After the first investments, the company should consider investments to increase the level of maturity from 1 to 2 and then from 2 to 3 in the remaining two areas: environment
- 39. and knowledge management (E 1–2, E 2–3, KM 1–2, KM 2–3). Step Three In the third step, the project management maturity level should be increased from 3 to 4 in the methods and human resources areas (M 3–4, HR 3–4). Step Four In this step, as in step three, one goes up from level 3 to 4 in the environment and knowledge management areas (E 3–4, KM 3–4). Step Five The fifth step is designated for improvement in the methods and human resources areas from level 4 to 5 (M 4– 5, HR 4–5). Step Six In the last step, the investment should be placed to increase the maturity level from 4 to 5 in the areas of environment and knowledge management (E 4–5, KM 4–5). Figure 2 shows the investment road map for information
- 40. technology companies. Figure 2. Investment road map for information technology companies Comparing Steps in IT Companies: The Reduction of Impact The highest potential impact on future projects in the IT industry occurs when investing in the areas indicated in the first step and then gradually decreases. Assuming that the impact in the first step equals 100, the impact on future projects’ duration of investment in step two is 99. Accordingly, in step three, the duration is 81; in step four, 80; in step five, 62; and, finally, in step
- 41. six, 61. Despite a relatively greater number of steps in comparison to the construction industry, the differences between some pairs of steps (1 and 2, 3 and 4, 5 and 6) are small. Thus, the decision to … CSCE 1040 Homework 3 For this assignment we are going to implement the Mean Green EagleLift Application that we designed in Homework 2. For the purposes of this assignment you will need to create a user interface menu that matches your design as well as implement each of the entities as classes in C++. Note we will be using C++ and you will need to use the g++ version of the compiler. You may use any of the C++ STL at this time. You may NOT use Inheritance at this time. It is STRONGLY recommended, in fact it is required, that you use a pattern-based solution such as the transaction pattern we have discussed, just as you created in your design. Other methods or designs will significantly increase your development time, stress level, as well as the
- 42. degree of difficulty for this assignment. And you will lose a portion of the points since it is required. Be sure that your implementation reflects the information in your updated design; based on any feedback you received from the grader or instructor. You will need to use the Time class from C++ libraries to work with the time information. We will discuss this in class and there will be some video and other resources posted about this for your reference. You may need to modify your design from Homework 2 based on grader comments and class discussion. You will need to turn this updated design in as well as use it for the basis of your program Be sure to attend class lectures, as we will discuss many of the topics you will need to complete the assignment! Program Requirements Your program will be written in C/C++ not any other computer language. You will include the steps in your algorithm in your code. You may, of course, paraphrase them if you like. Your program will be graded based largely upon whether it works correctly on a CSE Department Linux machine.
- 43. Your program will also be graded upon your program style. At the very least your program should include: A consistent indentation style as recommended in the textbook and in class. It should also use meaningful variable names. A block header comment section that includes: Your Name and Email Address, and a brief description of the program. Your program's output should initially display the department and course number, program number, your name, and your email address. Be sure to create appropriate test data and execute tests for proper and improper data on all functions. You will submit your program source file to the Canvas website under the "Homework 3" drop box. Make sure you submit your program before the due date and time. You must also submit your updated Design file, and a short report about your efforts. Each class should have its own header (.h) and code (.cpp) file as well as a .cpp for main and, if needed, a .h file for main if any other functions of constants are needed. This means you will be turning in 2 PDF’s (updated design document and report) , 7 cpp files (6 classes and 1 main) and at least 6 header files (1 for
- 44. each class). If you create a .h for main then you will have 7 header files. You should also create a makefile to make it easier to compile your code for both you and the grader. Finally zip all of these files into a single zip file named hw3xxx.zip, where xxx represents your initials. Please be sure and test your program to make sure it is working properly. You can either do this by hand (calculating some test values on paper to see if they match what your program says), or temporarily display various intermediate values you're calculating in the process and desk check the results to make sure they are correct. The more test cases you try and you get correct answers, the more certain you will be that when the grader uses his or her own test cases that your program will produce the correct result.