SlideShare a Scribd company logo
Presentation on
“Rapeseed Complex In India”
“Production, Demand & Supply Scenario”
By
Govindbhai G. Patel
Managing Partner
GGN International
G. G. Patel & Nikhil Research Company
At
SEA RAPESEED-MUSTARD CONCLAVE 2018
JAIPUR
On 8th July, 20181
Rapeseed Growing Area Map of India
Main Rapeseed
Producing States
• Rajasthan
• U.P.
• M.P. & Chhattisgarh
• Haryana
• West Bengal
•Gujarat
2
Rapeseed Area & Production in India
Above production include Rabi & Kharif (Toria)
3
Rapeseed Crop Estimate for 2017-18
State
Area
(Lac Ha)
Production
(Lac MT)
Yield
(Kg/ Ha.)
Uttar Pradesh 12.13 10.50 866
Rajasthan 20.89 24.00 1,149
Punjab/Haryana 6.29 7.50 1,192
Gujarat 2.22 3.05 1,374
M.P. 7.58 6.75 891
West Bengal 6.21 4.25 684
Eastern India & Others 11.56 8.25 714
Sub Total 66.88 64.30 961
Taramira Incl. in above 0.50
Sub Total 64.80
Kharif Toria Incl. in above 1.00
TOTAL 66.88 65.80 984
4
World Rapeseed Production
in 2016/17 & 2017/18 (in ml. T)
World total production was 63.44ml T in 2016/17 and 66.54 ml T expected in 2017/18.
India produces around 10 % of World Production.
Source : Oil World (Except India Crop Figure)5
World Rapeseed Yield
From 2012/13 & 2016/17 (in T/Ha)
Indian Rapeseed yield per Ha is only 28% of EU, 44% of Canada And 54% of China.
Source : Oil World (Except India)6
Country Jan Feb Mar Apr May Jun Jly Aug Sep Oct Nov Dec
EU-28
Ukraine
Canada
China,PR
India
Australia
World Rapeseed Harvesting Period
• EU-28 & Ukraine crop is harvested during July-August.
• Canada crop is harvested during August-October.
• China crop is harvested during June-July.
• India crop is harvested during February-April.
• Australia crop is harvested during December-January.
7
World Rapeseed Oil Production (ml T)
Source : Oil World8
World Rapeseed Oil Use for Biodiesel
Production (Lac MT)
Source : Oil World9
Rapeseed Oil Domestic Production
And Import in India (Nov-Oct)
Year
Domestic
Production
(Lac MT)
Import
(Lac MT)
Total
(Lac MT)
2012/13 20.50 0.28 20.78
2013/14 21.50 2.03 23.53
2014/15 16.80 3.55 20.35
2015/16 16.35 3.79 20.14
2016/17 19.00 2.90 21.90
2017/18 (E) 22.40 2.60 25.00
10
Rapeseed Oil Consumption in India
(Domestic + Imported) (Nov-Oct)
Year
Rapeseed Oil Consumption
Lac MT % of TTL Consump.
2012/13 20.50 11.9%
2013/14 23.60 12.9%
2014/15 20.35 10.1%
2015/16 19.90 9.6%
2016/17 21.50 9.9%
2017/18 (E) 25.80 11.4%
11
Zone-wise Rapeseed Oil Consumption
Pattern of India in 2014/15
Total Consumption of Rapeseed oil in India was 20.35 Lac MT in
2014/15. Out of which Rapeseed oil consumption is highest in East
India & North India with percentage of 46% & 38% respectively.
12
Rapeseed Meal Export From India
From 2012/13 to 2017/18 (Mar-Feb) (Lac MT)
Export of Rapeseed Meal decreased by 2.35 Lac T in last six years i.e.
average decrease 5% per year. In last six years Highest export was 10.98
Lac T in 2014/15 and lowest export was 2.14 Lac T in 2016/17
13
Monthly Rapeseed Arrival During
2012-13 to 2017-18
Month 2012-13 2013-14 2014-15 2015-16 2016-17 2017-18
Average
Monthly
%
Mar 11.15 7.93 10.00 7.47 12.10 12.00 17.7%
Apr 8.00 14.10 14.15 10.07 11.45 10.40 19.9%
May 6.15 7.95 7.80 6.04 6.30 6.65 11.9%
Jun 3.75 5.00 5.25 3.84 3.90 4.50 7.6%
Jul 3.19 2.95 4.30 2.90 2.70 3.85 5.8%
Aug 2.75 2.60 2.80 2.67 2.00 3.80 4.8%
Sep 2.80 3.07 3.00 3.10 2.05 3.60 5.1%
Oct 2.30 4.65 3.10 2.72 2.30 3.15 5.3%
Nov 2.71 3.50 3.75 2.27 2.95 4.25 5.7%
Dec 2.70 3.05 3.40 2.17 2.85 4.15 5.3%
Jan 2.50 2.63 2.70 1.52 2.15 2.75 4.2%
Feb 4.00 4.77 4.00 3.10 2.80 4.25 6.7%
Total Arrival 52.00 62.20 64.25 47.87 53.55 63.35 100.0%
50%
18%
16%
16%
(Figures in Lac MT)
14
Monthly Rapeseed Crush During
2012-13 to 2017-18
Month 2012-13 2013-14 2014-15 2015-16 2016-17 2017-18
Average
Monthly
%
Mar 5.50 5.80 7.50 5.50 6.50 6.00 10.9%
Apr 5.50 8.00 9.00 7.30 7.50 7.00 13.1%
May 5.50 7.00 8.00 5.00 5.25 6.25 11.0%
Jun 4.50 6.00 6.00 4.00 4.75 5.75 9.2%
Jul 4.00 5.30 5.00 3.00 4.25 5.50 8.0%
Aug 4.00 4.50 4.20 3.25 4.20 4.50 7.3%
Sep 4.00 4.50 5.00 3.10 4.00 4.50 7.5%
Oct 4.50 4.80 4.00 3.20 3.75 4.50 7.3%
Nov 4.00 4.50 4.30 2.80 2.50 5.00 6.9%
Dec 3.75 4.00 4.10 2.50 2.50 4.25 6.3%
Jan 3.50 3.50 2.70 2.10 2.50 3.25 5.2%
Feb 3.25 4.75 4.75 4.25 3.50 4.00 7.3%
Total Crush 52.00 62.65 64.55 46.00 51.20 60.50 100.00%
35%
25%
22%
18%
(Figures in Lac MT)
15
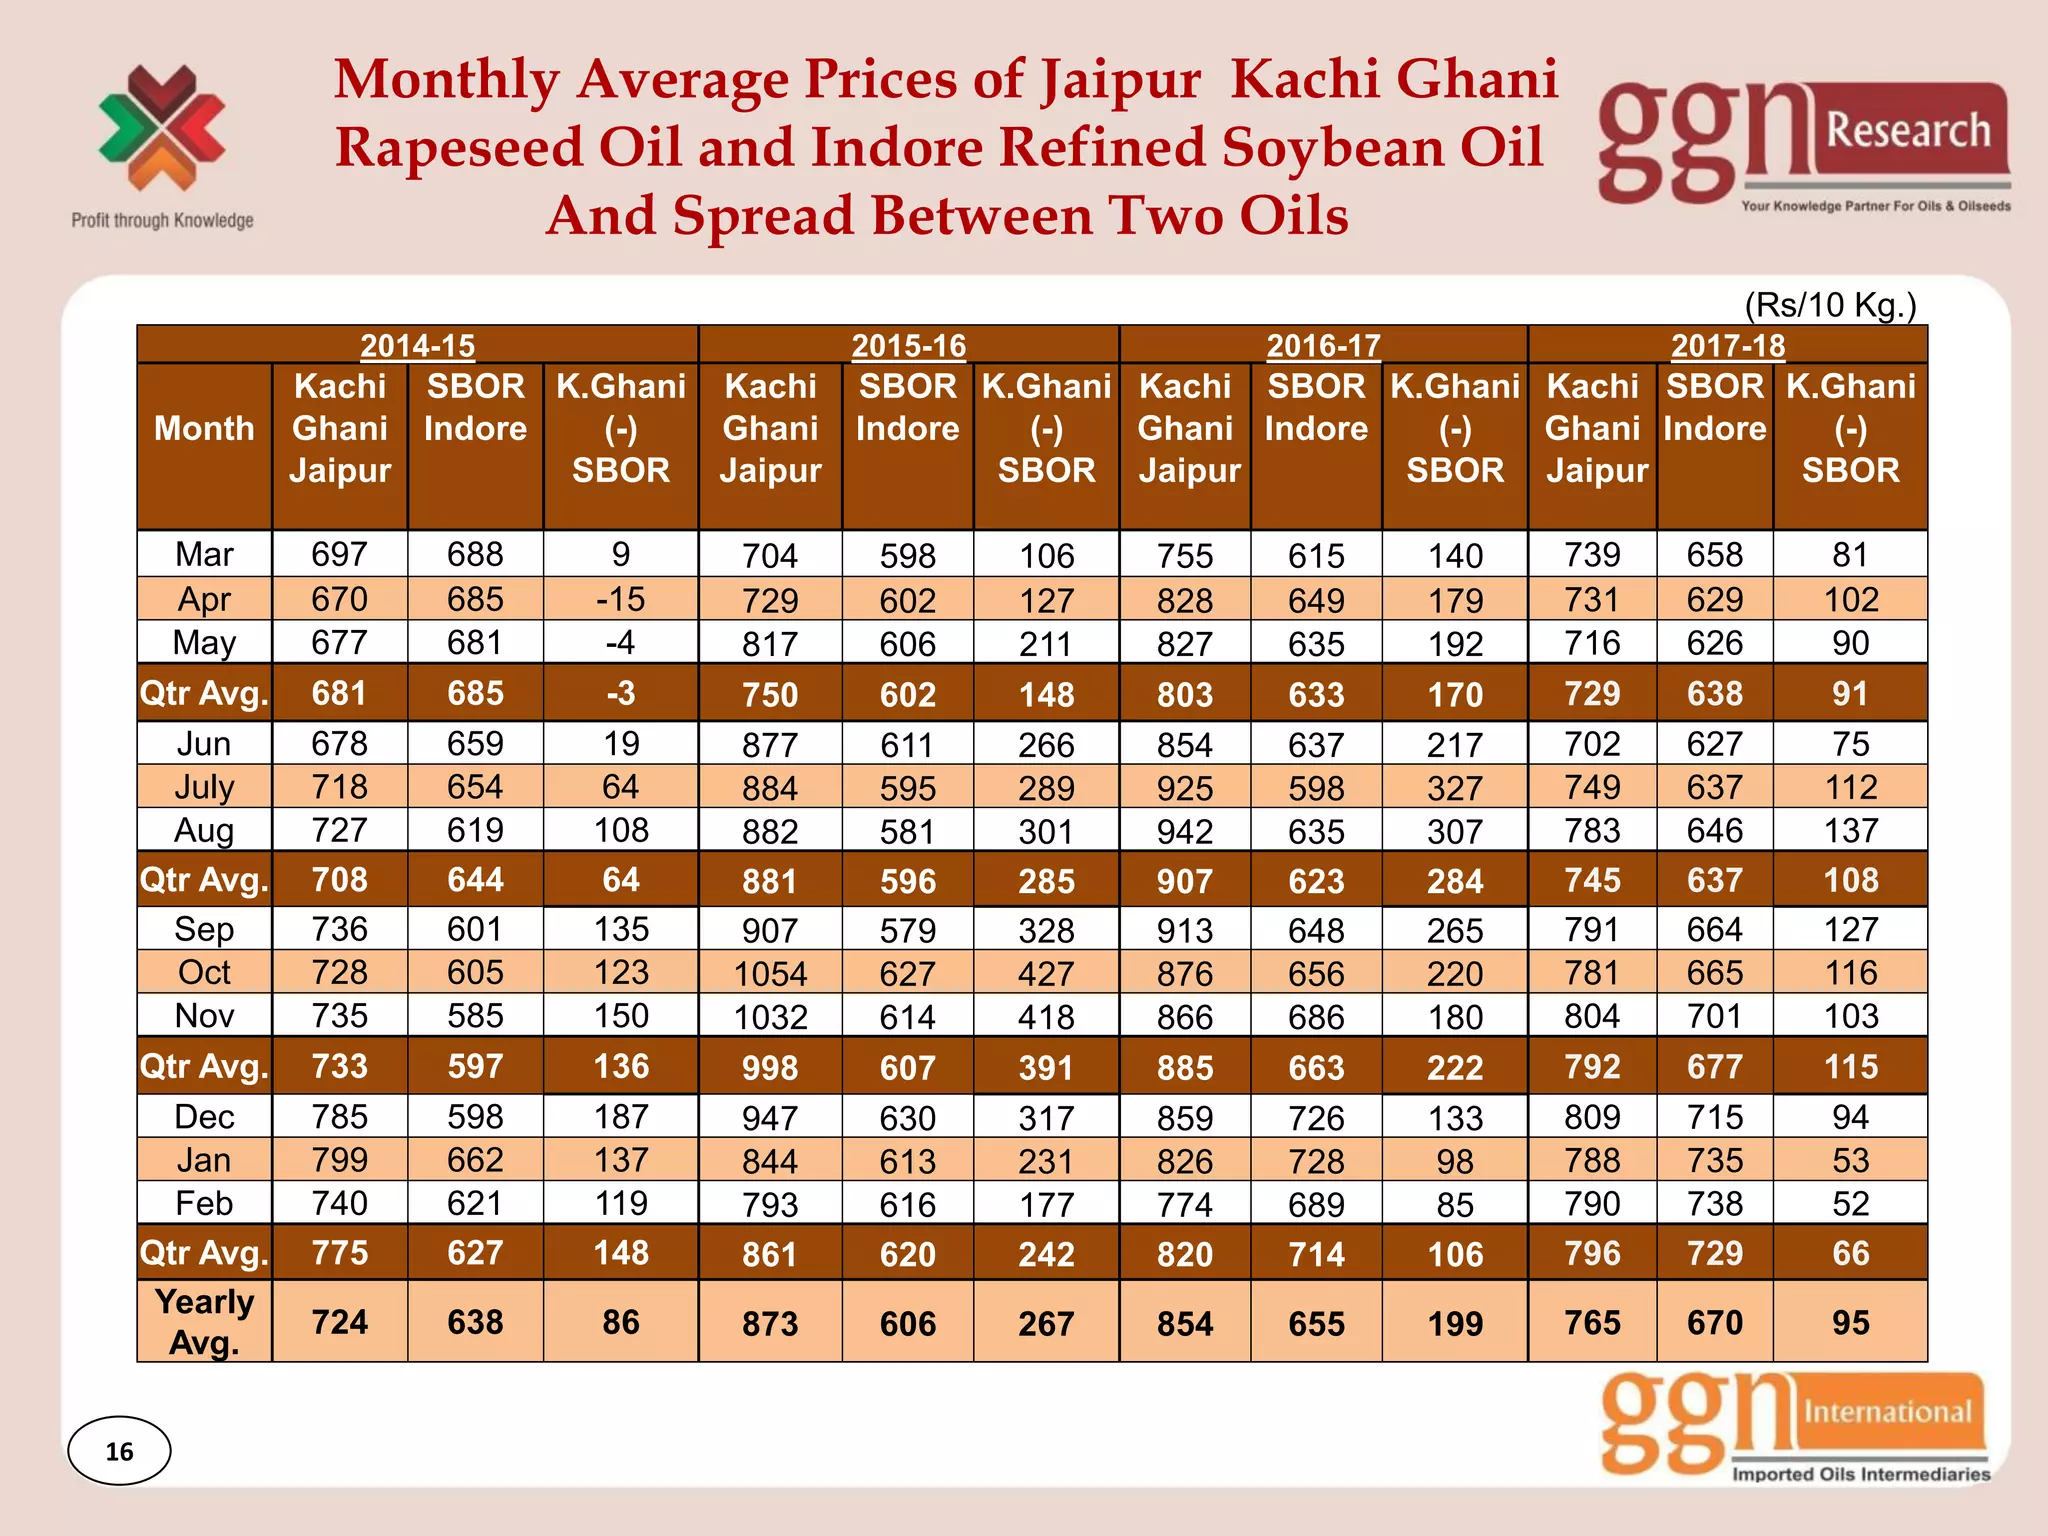
Monthly Average Prices of Jaipur Kachi Ghani
Rapeseed Oil and Indore Refined Soybean Oil
And Spread Between Two Oils
2014-15 2015-16 2016-17 2017-18
Month
Kachi SBOR K.Ghani Kachi SBOR K.Ghani Kachi SBOR K.Ghani Kachi SBOR K.Ghani
Ghani Indore (-) Ghani Indore (-) Ghani Indore (-) Ghani Indore (-)
Jaipur SBOR Jaipur SBOR Jaipur SBOR Jaipur SBOR
Mar 697 688 9 704 598 106 755 615 140 739 658 81
Apr 670 685 -15 729 602 127 828 649 179 731 629 102
May 677 681 -4 817 606 211 827 635 192 716 626 90
Qtr Avg. 681 685 -3 750 602 148 803 633 170 729 638 91
Jun 678 659 19 877 611 266 854 637 217 702 627 75
July 718 654 64 884 595 289 925 598 327 749 637 112
Aug 727 619 108 882 581 301 942 635 307 783 646 137
Qtr Avg. 708 644 64 881 596 285 907 623 284 745 637 108
Sep 736 601 135 907 579 328 913 648 265 791 664 127
Oct 728 605 123 1054 627 427 876 656 220 781 665 116
Nov 735 585 150 1032 614 418 866 686 180 804 701 103
Qtr Avg. 733 597 136 998 607 391 885 663 222 792 677 115
Dec 785 598 187 947 630 317 859 726 133 809 715 94
Jan 799 662 137 844 613 231 826 728 98 788 735 53
Feb 740 621 119 793 616 177 774 689 85 790 738 52
Qtr Avg. 775 627 148 861 620 242 820 714 106 796 729 66
Yearly
Avg.
724 638 86 873 606 267 854 655 199 765 670 95
(Rs/10 Kg.)
16
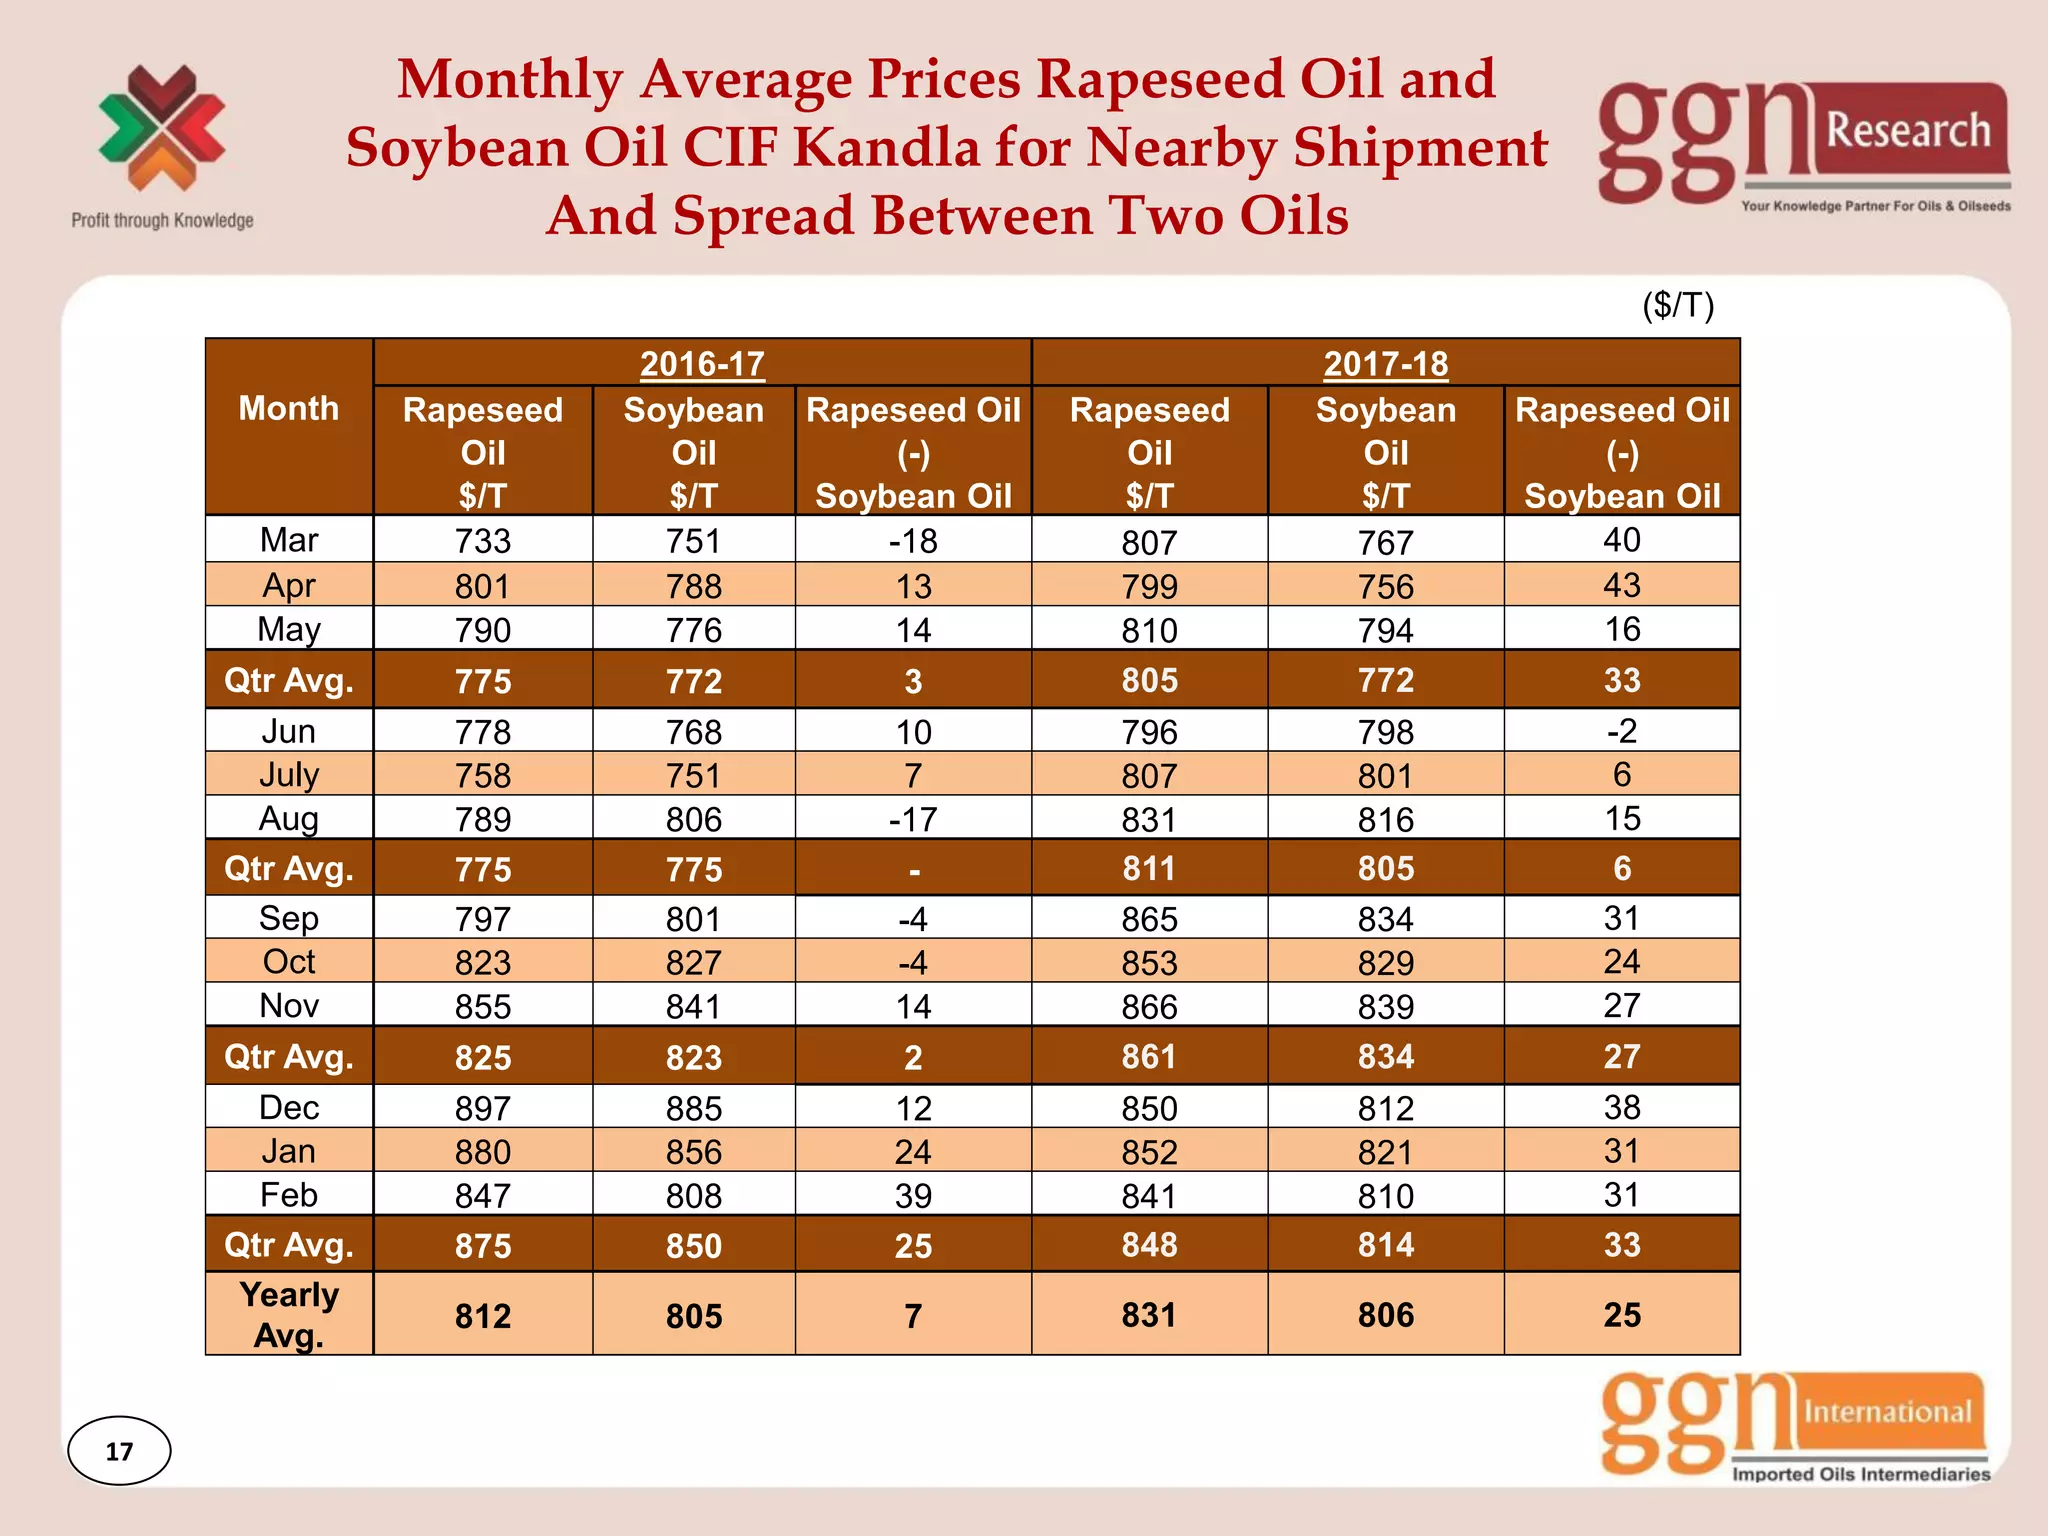
Monthly Average Prices Rapeseed Oil and
Soybean Oil CIF Kandla for Nearby Shipment
And Spread Between Two Oils
Month
2016-17 2017-18
Rapeseed Soybean Rapeseed Oil Rapeseed Soybean Rapeseed Oil
Oil Oil (-) Oil Oil (-)
$/T $/T Soybean Oil $/T $/T Soybean Oil
Mar 733 751 -18 807 767 40
Apr 801 788 13 799 756 43
May 790 776 14 810 794 16
Qtr Avg. 775 772 3 805 772 33
Jun 778 768 10 796 798 -2
July 758 751 7 807 801 6
Aug 789 806 -17 831 816 15
Qtr Avg. 775 775 - 811 805 6
Sep 797 801 -4 865 834 31
Oct 823 827 -4 853 829 24
Nov 855 841 14 866 839 27
Qtr Avg. 825 823 2 861 834 27
Dec 897 885 12 850 812 38
Jan 880 856 24 852 821 31
Feb 847 808 39 841 810 31
Qtr Avg. 875 850 25 848 814 33
Yearly
Avg.
812 805 7 831 806 25
($/T)
17
NAFED Procurement of Rapeseed
From Farmers During 2017/18 Rabi Season
(Upto 30 June 2018)
State
Qty
Lac MT
Rajasthan 4.70
Haryana 2.30
M.P. 1.20
Gujarat 0.50
U.P. 0.01
TOTAL 8.71
NAFED purchased Rapeseed from farmers on MSP of
Rs.3900 + Bonus Rs.100 = Rs.4000 per qtl.
Month-wise Purchase
Month
Qty
Lac MT
April 2.50
May 3.86
June 2.35
TOTAL 8.71
18
Rapeseed Arrival & Crush During
Current Season (Lac MT)
Month
Arrival
(Except
Nafed)
Crushing
16-28 Feb’18 2.25 2.25
Mar’18 12.60 6.20
Apr’18 11.00 9.00
May’18 8.35 8.00
Jun’18 5.60 7.00
TOTAL 39.80 32.45
Details Upto 30.06.18
(Lac MT)
Arrival (Except Nafed) 39.80
Less : Crush 32.45
Less : Direct Use/Export 1.20
Stock With Farmers,
Processors & Stockist
30.40
B/S for Remaining Period of the Season
(Lac MT)
Stock With Farmers, Processors
& Stockist
30.40
Stock with Nafed 8.71
Total Available as on 01.07.18 39.11
Less : Carry-forward for Next
Season
5.00
Available for Crushing 34.11
Average per month available for crushing
for remaining 8.5 months of the season
4.00 Lac MT/month (Last year 4.10 Lac
MT/month).
(Lac MT)
19
20
:: Rajkot Office ::
908, Alpha Plus, 150 Feet Ring Road, Near Raiya Telephone Exchange, Rajkot,
Gujarat - 360005, India,
Ph No.: +91 7069690020, Email : contact@ggnresearch.com
Mr. Govindbhai Patel : Mobile No. 98250 78462
:: Indore Office ::
401, Princess Empire, 12, Race Course Road, Indore, MP - 452001, India,
Ph No.: +91 731 4015010, Email : contact@ggnresearch.com
Mr. Nirav Desai : Mobile No. 99933 17000
Contact Us

More Related Content

What's hot

Bookuksteel 026940-Algorithm Investment Report
Bookuksteel 026940-Algorithm Investment ReportBookuksteel 026940-Algorithm Investment Report
Bookuksteel 026940-Algorithm Investment Report
알고리즘 기업분석 컨설팅-알기컨,algikeon
 
Commodity weekly report 10 14 july 2017
Commodity weekly report  10  14 july 2017Commodity weekly report  10  14 july 2017
Commodity weekly report 10 14 july 2017
tradenivesh investment
 
Equity Research Report 08 may 2018 Ways2Capital
Equity Research Report  08 may 2018 Ways2CapitalEquity Research Report  08 may 2018 Ways2Capital
Equity Research Report 08 may 2018 Ways2Capital
ways2capitalindore
 
#116F
#116F#116F
#116F
HardikT2
 
Value Call- Oil & Gas - May 29'2015
Value Call- Oil & Gas - May 29'2015Value Call- Oil & Gas - May 29'2015
Value Call- Oil & Gas - May 29'2015Usman Riaz
 
#116M
#116M#116M
#116M
HardikT2
 
Commodity weekly report 3 7 july 2017
Commodity weekly report  3  7 july 2017Commodity weekly report  3  7 july 2017
Commodity weekly report 3 7 july 2017
tradenivesh investment
 
12.12.09 presentation on_ftp-icai
12.12.09 presentation on_ftp-icai12.12.09 presentation on_ftp-icai
12.12.09 presentation on_ftp-icaiKusha Gupta
 
Daily agri news letter 26 july 2013
Daily agri news letter 26 july 2013Daily agri news letter 26 july 2013
Daily agri news letter 26 july 2013
Rakhi Tips Provider
 
Commodity Research Report 22 January 2018 Ways2Capital
Commodity Research Report 22 January 2018 Ways2CapitalCommodity Research Report 22 January 2018 Ways2Capital
Commodity Research Report 22 January 2018 Ways2Capital
Ways2Capital | Investment Advisor
 
SHINSEGAEFOOD-031440-Algorithm Investment Report
SHINSEGAEFOOD-031440-Algorithm Investment Report SHINSEGAEFOOD-031440-Algorithm Investment Report
SHINSEGAEFOOD-031440-Algorithm Investment Report
알고리즘 기업분석 컨설팅-알기컨,algikeon
 
Ccac 02.01.2019 (1)
Ccac 02.01.2019 (1)Ccac 02.01.2019 (1)
Ccac 02.01.2019 (1)
Dr-Khalid Abdullah
 
#116H
#116H#116H
#116H
HardikT2
 
FHC MARABO FORECAST BUDGETING 2019
FHC MARABO FORECAST BUDGETING 2019FHC MARABO FORECAST BUDGETING 2019
FHC MARABO FORECAST BUDGETING 2019
Fabrice CLAMAGIRAND
 
Bentleys: WA Economic Update November 2016
Bentleys: WA Economic Update November 2016Bentleys: WA Economic Update November 2016
Bentleys: WA Economic Update November 2016
Bentleys (WA) Pty Ltd
 

What's hot (15)

Bookuksteel 026940-Algorithm Investment Report
Bookuksteel 026940-Algorithm Investment ReportBookuksteel 026940-Algorithm Investment Report
Bookuksteel 026940-Algorithm Investment Report
 
Commodity weekly report 10 14 july 2017
Commodity weekly report  10  14 july 2017Commodity weekly report  10  14 july 2017
Commodity weekly report 10 14 july 2017
 
Equity Research Report 08 may 2018 Ways2Capital
Equity Research Report  08 may 2018 Ways2CapitalEquity Research Report  08 may 2018 Ways2Capital
Equity Research Report 08 may 2018 Ways2Capital
 
#116F
#116F#116F
#116F
 
Value Call- Oil & Gas - May 29'2015
Value Call- Oil & Gas - May 29'2015Value Call- Oil & Gas - May 29'2015
Value Call- Oil & Gas - May 29'2015
 
#116M
#116M#116M
#116M
 
Commodity weekly report 3 7 july 2017
Commodity weekly report  3  7 july 2017Commodity weekly report  3  7 july 2017
Commodity weekly report 3 7 july 2017
 
12.12.09 presentation on_ftp-icai
12.12.09 presentation on_ftp-icai12.12.09 presentation on_ftp-icai
12.12.09 presentation on_ftp-icai
 
Daily agri news letter 26 july 2013
Daily agri news letter 26 july 2013Daily agri news letter 26 july 2013
Daily agri news letter 26 july 2013
 
Commodity Research Report 22 January 2018 Ways2Capital
Commodity Research Report 22 January 2018 Ways2CapitalCommodity Research Report 22 January 2018 Ways2Capital
Commodity Research Report 22 January 2018 Ways2Capital
 
SHINSEGAEFOOD-031440-Algorithm Investment Report
SHINSEGAEFOOD-031440-Algorithm Investment Report SHINSEGAEFOOD-031440-Algorithm Investment Report
SHINSEGAEFOOD-031440-Algorithm Investment Report
 
Ccac 02.01.2019 (1)
Ccac 02.01.2019 (1)Ccac 02.01.2019 (1)
Ccac 02.01.2019 (1)
 
#116H
#116H#116H
#116H
 
FHC MARABO FORECAST BUDGETING 2019
FHC MARABO FORECAST BUDGETING 2019FHC MARABO FORECAST BUDGETING 2019
FHC MARABO FORECAST BUDGETING 2019
 
Bentleys: WA Economic Update November 2016
Bentleys: WA Economic Update November 2016Bentleys: WA Economic Update November 2016
Bentleys: WA Economic Update November 2016
 

Similar to #67B

#190 SEA Rabi Crop Estimate for 2016-17
#190 SEA Rabi Crop Estimate for 2016-17#190 SEA Rabi Crop Estimate for 2016-17
#190 SEA Rabi Crop Estimate for 2016-17
Solvent Extractors' Association of India
 
#40 Import of Vegetable Oil - November 2017 to May 2018
#40 Import of Vegetable Oil - November 2017 to May 2018#40 Import of Vegetable Oil - November 2017 to May 2018
#40 Import of Vegetable Oil - November 2017 to May 2018
Solvent Extractors' Association of India
 
#225 SEA Kharif Crop Estimate for 2017-18
#225 SEA Kharif Crop Estimate for 2017-18#225 SEA Kharif Crop Estimate for 2017-18
#225 SEA Kharif Crop Estimate for 2017-18
Solvent Extractors' Association of India
 
India's Trade Policy in respect of Edible Vegetable Oils
India's Trade Policy in respect of Edible Vegetable OilsIndia's Trade Policy in respect of Edible Vegetable Oils
India's Trade Policy in respect of Edible Vegetable Oils
Vijay Rajmohan
 
#124 Indian Castor Oil Scenario at Prague, Czech Republic - Dr. B V Mehta
#124 Indian Castor Oil Scenario at Prague, Czech Republic - Dr. B V Mehta#124 Indian Castor Oil Scenario at Prague, Czech Republic - Dr. B V Mehta
#124 Indian Castor Oil Scenario at Prague, Czech Republic - Dr. B V Mehta
Solvent Extractors' Association of India
 
UGA S&D balances Grain&OilSeeds, December 2018
UGA S&D balances Grain&OilSeeds, December 2018UGA S&D balances Grain&OilSeeds, December 2018
UGA S&D balances Grain&OilSeeds, December 2018
Ukrainian Grain Association
 
**JUNK** Upload
**JUNK** Upload**JUNK** Upload
**JUNK** Upload
pratap.koppal93
 
Export of castor oil 2017 18-website
Export of castor oil  2017 18-websiteExport of castor oil  2017 18-website
Export of castor oil 2017 18-website
Solvent Extractors' Association of India
 
1174
11741174
J. Thomas & Co. - PY GRP PPT
J. Thomas & Co. - PY GRP PPTJ. Thomas & Co. - PY GRP PPT
J. Thomas & Co. - PY GRP PPT
Koshy Panicker
 
Relevance of Futures for Indian Oil & Oilseed Industry
Relevance of Futures for Indian Oil & Oilseed IndustryRelevance of Futures for Indian Oil & Oilseed Industry
Relevance of Futures for Indian Oil & Oilseed Industry
GG Patel & Nikhil Research Company
 
JK Cement Q1FY15: Buy for a target of Rs520
 JK Cement Q1FY15: Buy for a target of Rs520 JK Cement Q1FY15: Buy for a target of Rs520
JK Cement Q1FY15: Buy for a target of Rs520
IndiaNotes.com
 
#90 Export of Oilmeal April to July 2015
#90 Export of Oilmeal April to July 2015#90 Export of Oilmeal April to July 2015
#90 Export of Oilmeal April to July 2015
Solvent Extractors' Association of India
 
E2 a02 unit_i_sectoral development in india
E2 a02 unit_i_sectoral development in indiaE2 a02 unit_i_sectoral development in india
E2 a02 unit_i_sectoral development in india
4512452
 
#233 COOIT Kharif Crop Estimate for 2013-14
#233 COOIT Kharif Crop Estimate for 2013-14#233 COOIT Kharif Crop Estimate for 2013-14
#233 COOIT Kharif Crop Estimate for 2013-14
Solvent Extractors' Association of India
 
FAISAL BASRI: Subsidi BBM Sudah Bewujud Kanker Ganas
FAISAL BASRI: Subsidi BBM Sudah Bewujud Kanker GanasFAISAL BASRI: Subsidi BBM Sudah Bewujud Kanker Ganas
FAISAL BASRI: Subsidi BBM Sudah Bewujud Kanker Ganas
Ruslan Chandra
 
#79 Export of Oilmeals - 1st Quarter April - June 2017 - Up by 64%
#79 Export of Oilmeals - 1st Quarter April - June 2017 - Up by 64%#79 Export of Oilmeals - 1st Quarter April - June 2017 - Up by 64%
#79 Export of Oilmeals - 1st Quarter April - June 2017 - Up by 64%
Solvent Extractors' Association of India
 
PFP RMA_RMC Presentation Kevin
PFP RMA_RMC Presentation KevinPFP RMA_RMC Presentation Kevin
PFP RMA_RMC Presentation KevinKevin McCutcheon
 
#227 SEA Kharif Crop Estimate for 2016-17
#227 SEA Kharif Crop Estimate for 2016-17#227 SEA Kharif Crop Estimate for 2016-17
#227 SEA Kharif Crop Estimate for 2016-17
Solvent Extractors' Association of India
 
#63 Dr B.V. MEHTA Paper Presentation on "Demand and Supply of Edible Oils in ...
#63 Dr B.V. MEHTA Paper Presentation on "Demand and Supply of Edible Oils in ...#63 Dr B.V. MEHTA Paper Presentation on "Demand and Supply of Edible Oils in ...
#63 Dr B.V. MEHTA Paper Presentation on "Demand and Supply of Edible Oils in ...
Solvent Extractors' Association of India
 

Similar to #67B (20)

#190 SEA Rabi Crop Estimate for 2016-17
#190 SEA Rabi Crop Estimate for 2016-17#190 SEA Rabi Crop Estimate for 2016-17
#190 SEA Rabi Crop Estimate for 2016-17
 
#40 Import of Vegetable Oil - November 2017 to May 2018
#40 Import of Vegetable Oil - November 2017 to May 2018#40 Import of Vegetable Oil - November 2017 to May 2018
#40 Import of Vegetable Oil - November 2017 to May 2018
 
#225 SEA Kharif Crop Estimate for 2017-18
#225 SEA Kharif Crop Estimate for 2017-18#225 SEA Kharif Crop Estimate for 2017-18
#225 SEA Kharif Crop Estimate for 2017-18
 
India's Trade Policy in respect of Edible Vegetable Oils
India's Trade Policy in respect of Edible Vegetable OilsIndia's Trade Policy in respect of Edible Vegetable Oils
India's Trade Policy in respect of Edible Vegetable Oils
 
#124 Indian Castor Oil Scenario at Prague, Czech Republic - Dr. B V Mehta
#124 Indian Castor Oil Scenario at Prague, Czech Republic - Dr. B V Mehta#124 Indian Castor Oil Scenario at Prague, Czech Republic - Dr. B V Mehta
#124 Indian Castor Oil Scenario at Prague, Czech Republic - Dr. B V Mehta
 
UGA S&D balances Grain&OilSeeds, December 2018
UGA S&D balances Grain&OilSeeds, December 2018UGA S&D balances Grain&OilSeeds, December 2018
UGA S&D balances Grain&OilSeeds, December 2018
 
**JUNK** Upload
**JUNK** Upload**JUNK** Upload
**JUNK** Upload
 
Export of castor oil 2017 18-website
Export of castor oil  2017 18-websiteExport of castor oil  2017 18-website
Export of castor oil 2017 18-website
 
1174
11741174
1174
 
J. Thomas & Co. - PY GRP PPT
J. Thomas & Co. - PY GRP PPTJ. Thomas & Co. - PY GRP PPT
J. Thomas & Co. - PY GRP PPT
 
Relevance of Futures for Indian Oil & Oilseed Industry
Relevance of Futures for Indian Oil & Oilseed IndustryRelevance of Futures for Indian Oil & Oilseed Industry
Relevance of Futures for Indian Oil & Oilseed Industry
 
JK Cement Q1FY15: Buy for a target of Rs520
 JK Cement Q1FY15: Buy for a target of Rs520 JK Cement Q1FY15: Buy for a target of Rs520
JK Cement Q1FY15: Buy for a target of Rs520
 
#90 Export of Oilmeal April to July 2015
#90 Export of Oilmeal April to July 2015#90 Export of Oilmeal April to July 2015
#90 Export of Oilmeal April to July 2015
 
E2 a02 unit_i_sectoral development in india
E2 a02 unit_i_sectoral development in indiaE2 a02 unit_i_sectoral development in india
E2 a02 unit_i_sectoral development in india
 
#233 COOIT Kharif Crop Estimate for 2013-14
#233 COOIT Kharif Crop Estimate for 2013-14#233 COOIT Kharif Crop Estimate for 2013-14
#233 COOIT Kharif Crop Estimate for 2013-14
 
FAISAL BASRI: Subsidi BBM Sudah Bewujud Kanker Ganas
FAISAL BASRI: Subsidi BBM Sudah Bewujud Kanker GanasFAISAL BASRI: Subsidi BBM Sudah Bewujud Kanker Ganas
FAISAL BASRI: Subsidi BBM Sudah Bewujud Kanker Ganas
 
#79 Export of Oilmeals - 1st Quarter April - June 2017 - Up by 64%
#79 Export of Oilmeals - 1st Quarter April - June 2017 - Up by 64%#79 Export of Oilmeals - 1st Quarter April - June 2017 - Up by 64%
#79 Export of Oilmeals - 1st Quarter April - June 2017 - Up by 64%
 
PFP RMA_RMC Presentation Kevin
PFP RMA_RMC Presentation KevinPFP RMA_RMC Presentation Kevin
PFP RMA_RMC Presentation Kevin
 
#227 SEA Kharif Crop Estimate for 2016-17
#227 SEA Kharif Crop Estimate for 2016-17#227 SEA Kharif Crop Estimate for 2016-17
#227 SEA Kharif Crop Estimate for 2016-17
 
#63 Dr B.V. MEHTA Paper Presentation on "Demand and Supply of Edible Oils in ...
#63 Dr B.V. MEHTA Paper Presentation on "Demand and Supply of Edible Oils in ...#63 Dr B.V. MEHTA Paper Presentation on "Demand and Supply of Edible Oils in ...
#63 Dr B.V. MEHTA Paper Presentation on "Demand and Supply of Edible Oils in ...
 

More from HardikT2

#116P
#116P#116P
#116P
HardikT2
 
#116Q
#116Q#116Q
#116Q
HardikT2
 
#61
#61#61
#61A
#61A#61A
#61A
HardikT2
 
#61B
#61B#61B
#61B
HardikT2
 
#61C
#61C#61C
#61C
HardikT2
 
#61D
#61D#61D
#61D
HardikT2
 
#61E
#61E#61E
#61E
HardikT2
 
#61F
#61F#61F
#61F
HardikT2
 
#61G
#61G#61G
#61G
HardikT2
 
#61H
#61H#61H
#61H
HardikT2
 
#61I
#61I#61I
#61I
HardikT2
 
#61J
#61J#61J
#61J
HardikT2
 
#61K
#61K#61K
#61K
HardikT2
 
#61L
#61L#61L
#61L
HardikT2
 
#61M
#61M#61M
#61M
HardikT2
 
#61N
#61N#61N
#61N
HardikT2
 
#61O
#61O#61O
#61O
HardikT2
 
#61P
#61P#61P
#61P
HardikT2
 
#61R
#61R#61R
#61R
HardikT2
 

More from HardikT2 (20)

#116P
#116P#116P
#116P
 
#116Q
#116Q#116Q
#116Q
 
#61
#61#61
#61
 
#61A
#61A#61A
#61A
 
#61B
#61B#61B
#61B
 
#61C
#61C#61C
#61C
 
#61D
#61D#61D
#61D
 
#61E
#61E#61E
#61E
 
#61F
#61F#61F
#61F
 
#61G
#61G#61G
#61G
 
#61H
#61H#61H
#61H
 
#61I
#61I#61I
#61I
 
#61J
#61J#61J
#61J
 
#61K
#61K#61K
#61K
 
#61L
#61L#61L
#61L
 
#61M
#61M#61M
#61M
 
#61N
#61N#61N
#61N
 
#61O
#61O#61O
#61O
 
#61P
#61P#61P
#61P
 
#61R
#61R#61R
#61R
 

Recently uploaded

一比一原版IC毕业证帝国理工大学毕业证成绩单如何办理
一比一原版IC毕业证帝国理工大学毕业证成绩单如何办理一比一原版IC毕业证帝国理工大学毕业证成绩单如何办理
一比一原版IC毕业证帝国理工大学毕业证成绩单如何办理
saseh1
 
Piccola cucina Best Restaurant in Brooklyn
Piccola cucina Best Restaurant in BrooklynPiccola cucina Best Restaurant in Brooklyn
Piccola cucina Best Restaurant in Brooklyn
Best italian Restaurant NYC
 
Best Chicken Mandi in Ghaziabad near me.
Best Chicken Mandi in Ghaziabad near me.Best Chicken Mandi in Ghaziabad near me.
Best Chicken Mandi in Ghaziabad near me.
tasteofmiddleeast07
 
Ang Chong Yi Navigating Singaporean Flavors: A Journey from Cultural Heritage...
Ang Chong Yi Navigating Singaporean Flavors: A Journey from Cultural Heritage...Ang Chong Yi Navigating Singaporean Flavors: A Journey from Cultural Heritage...
Ang Chong Yi Navigating Singaporean Flavors: A Journey from Cultural Heritage...
Ang Chong Yi
 
一比一原版UMN毕业证明尼苏达大学毕业证成绩单如何办理
一比一原版UMN毕业证明尼苏达大学毕业证成绩单如何办理一比一原版UMN毕业证明尼苏达大学毕业证成绩单如何办理
一比一原版UMN毕业证明尼苏达大学毕业证成绩单如何办理
zaquoa
 
Food and beverage service Restaurant Services notes V1.pptx
Food and beverage service Restaurant Services notes V1.pptxFood and beverage service Restaurant Services notes V1.pptx
Food and beverage service Restaurant Services notes V1.pptx
mangenatendaishe
 
一比一原版UVM毕业证佛蒙特大学毕业证成绩单如何办理
一比一原版UVM毕业证佛蒙特大学毕业证成绩单如何办理一比一原版UVM毕业证佛蒙特大学毕业证成绩单如何办理
一比一原版UVM毕业证佛蒙特大学毕业证成绩单如何办理
zaquoa
 
Key Features of The Italian Restaurants.pdf
Key Features of The Italian Restaurants.pdfKey Features of The Italian Restaurants.pdf
Key Features of The Italian Restaurants.pdf
menafilo317
 
Roti Bank Hyderabad: A Beacon of Hope and Nourishment
Roti Bank Hyderabad: A Beacon of Hope and NourishmentRoti Bank Hyderabad: A Beacon of Hope and Nourishment
Roti Bank Hyderabad: A Beacon of Hope and Nourishment
Roti Bank
 

Recently uploaded (9)

一比一原版IC毕业证帝国理工大学毕业证成绩单如何办理
一比一原版IC毕业证帝国理工大学毕业证成绩单如何办理一比一原版IC毕业证帝国理工大学毕业证成绩单如何办理
一比一原版IC毕业证帝国理工大学毕业证成绩单如何办理
 
Piccola cucina Best Restaurant in Brooklyn
Piccola cucina Best Restaurant in BrooklynPiccola cucina Best Restaurant in Brooklyn
Piccola cucina Best Restaurant in Brooklyn
 
Best Chicken Mandi in Ghaziabad near me.
Best Chicken Mandi in Ghaziabad near me.Best Chicken Mandi in Ghaziabad near me.
Best Chicken Mandi in Ghaziabad near me.
 
Ang Chong Yi Navigating Singaporean Flavors: A Journey from Cultural Heritage...
Ang Chong Yi Navigating Singaporean Flavors: A Journey from Cultural Heritage...Ang Chong Yi Navigating Singaporean Flavors: A Journey from Cultural Heritage...
Ang Chong Yi Navigating Singaporean Flavors: A Journey from Cultural Heritage...
 
一比一原版UMN毕业证明尼苏达大学毕业证成绩单如何办理
一比一原版UMN毕业证明尼苏达大学毕业证成绩单如何办理一比一原版UMN毕业证明尼苏达大学毕业证成绩单如何办理
一比一原版UMN毕业证明尼苏达大学毕业证成绩单如何办理
 
Food and beverage service Restaurant Services notes V1.pptx
Food and beverage service Restaurant Services notes V1.pptxFood and beverage service Restaurant Services notes V1.pptx
Food and beverage service Restaurant Services notes V1.pptx
 
一比一原版UVM毕业证佛蒙特大学毕业证成绩单如何办理
一比一原版UVM毕业证佛蒙特大学毕业证成绩单如何办理一比一原版UVM毕业证佛蒙特大学毕业证成绩单如何办理
一比一原版UVM毕业证佛蒙特大学毕业证成绩单如何办理
 
Key Features of The Italian Restaurants.pdf
Key Features of The Italian Restaurants.pdfKey Features of The Italian Restaurants.pdf
Key Features of The Italian Restaurants.pdf
 
Roti Bank Hyderabad: A Beacon of Hope and Nourishment
Roti Bank Hyderabad: A Beacon of Hope and NourishmentRoti Bank Hyderabad: A Beacon of Hope and Nourishment
Roti Bank Hyderabad: A Beacon of Hope and Nourishment
 

#67B

  • 1. Presentation on “Rapeseed Complex In India” “Production, Demand & Supply Scenario” By Govindbhai G. Patel Managing Partner GGN International G. G. Patel & Nikhil Research Company At SEA RAPESEED-MUSTARD CONCLAVE 2018 JAIPUR On 8th July, 20181
  • 2. Rapeseed Growing Area Map of India Main Rapeseed Producing States • Rajasthan • U.P. • M.P. & Chhattisgarh • Haryana • West Bengal •Gujarat 2
  • 3. Rapeseed Area & Production in India Above production include Rabi & Kharif (Toria) 3
  • 4. Rapeseed Crop Estimate for 2017-18 State Area (Lac Ha) Production (Lac MT) Yield (Kg/ Ha.) Uttar Pradesh 12.13 10.50 866 Rajasthan 20.89 24.00 1,149 Punjab/Haryana 6.29 7.50 1,192 Gujarat 2.22 3.05 1,374 M.P. 7.58 6.75 891 West Bengal 6.21 4.25 684 Eastern India & Others 11.56 8.25 714 Sub Total 66.88 64.30 961 Taramira Incl. in above 0.50 Sub Total 64.80 Kharif Toria Incl. in above 1.00 TOTAL 66.88 65.80 984 4
  • 5. World Rapeseed Production in 2016/17 & 2017/18 (in ml. T) World total production was 63.44ml T in 2016/17 and 66.54 ml T expected in 2017/18. India produces around 10 % of World Production. Source : Oil World (Except India Crop Figure)5
  • 6. World Rapeseed Yield From 2012/13 & 2016/17 (in T/Ha) Indian Rapeseed yield per Ha is only 28% of EU, 44% of Canada And 54% of China. Source : Oil World (Except India)6
  • 7. Country Jan Feb Mar Apr May Jun Jly Aug Sep Oct Nov Dec EU-28 Ukraine Canada China,PR India Australia World Rapeseed Harvesting Period • EU-28 & Ukraine crop is harvested during July-August. • Canada crop is harvested during August-October. • China crop is harvested during June-July. • India crop is harvested during February-April. • Australia crop is harvested during December-January. 7
  • 8. World Rapeseed Oil Production (ml T) Source : Oil World8
  • 9. World Rapeseed Oil Use for Biodiesel Production (Lac MT) Source : Oil World9
  • 10. Rapeseed Oil Domestic Production And Import in India (Nov-Oct) Year Domestic Production (Lac MT) Import (Lac MT) Total (Lac MT) 2012/13 20.50 0.28 20.78 2013/14 21.50 2.03 23.53 2014/15 16.80 3.55 20.35 2015/16 16.35 3.79 20.14 2016/17 19.00 2.90 21.90 2017/18 (E) 22.40 2.60 25.00 10
  • 11. Rapeseed Oil Consumption in India (Domestic + Imported) (Nov-Oct) Year Rapeseed Oil Consumption Lac MT % of TTL Consump. 2012/13 20.50 11.9% 2013/14 23.60 12.9% 2014/15 20.35 10.1% 2015/16 19.90 9.6% 2016/17 21.50 9.9% 2017/18 (E) 25.80 11.4% 11
  • 12. Zone-wise Rapeseed Oil Consumption Pattern of India in 2014/15 Total Consumption of Rapeseed oil in India was 20.35 Lac MT in 2014/15. Out of which Rapeseed oil consumption is highest in East India & North India with percentage of 46% & 38% respectively. 12
  • 13. Rapeseed Meal Export From India From 2012/13 to 2017/18 (Mar-Feb) (Lac MT) Export of Rapeseed Meal decreased by 2.35 Lac T in last six years i.e. average decrease 5% per year. In last six years Highest export was 10.98 Lac T in 2014/15 and lowest export was 2.14 Lac T in 2016/17 13
  • 14. Monthly Rapeseed Arrival During 2012-13 to 2017-18 Month 2012-13 2013-14 2014-15 2015-16 2016-17 2017-18 Average Monthly % Mar 11.15 7.93 10.00 7.47 12.10 12.00 17.7% Apr 8.00 14.10 14.15 10.07 11.45 10.40 19.9% May 6.15 7.95 7.80 6.04 6.30 6.65 11.9% Jun 3.75 5.00 5.25 3.84 3.90 4.50 7.6% Jul 3.19 2.95 4.30 2.90 2.70 3.85 5.8% Aug 2.75 2.60 2.80 2.67 2.00 3.80 4.8% Sep 2.80 3.07 3.00 3.10 2.05 3.60 5.1% Oct 2.30 4.65 3.10 2.72 2.30 3.15 5.3% Nov 2.71 3.50 3.75 2.27 2.95 4.25 5.7% Dec 2.70 3.05 3.40 2.17 2.85 4.15 5.3% Jan 2.50 2.63 2.70 1.52 2.15 2.75 4.2% Feb 4.00 4.77 4.00 3.10 2.80 4.25 6.7% Total Arrival 52.00 62.20 64.25 47.87 53.55 63.35 100.0% 50% 18% 16% 16% (Figures in Lac MT) 14
  • 15. Monthly Rapeseed Crush During 2012-13 to 2017-18 Month 2012-13 2013-14 2014-15 2015-16 2016-17 2017-18 Average Monthly % Mar 5.50 5.80 7.50 5.50 6.50 6.00 10.9% Apr 5.50 8.00 9.00 7.30 7.50 7.00 13.1% May 5.50 7.00 8.00 5.00 5.25 6.25 11.0% Jun 4.50 6.00 6.00 4.00 4.75 5.75 9.2% Jul 4.00 5.30 5.00 3.00 4.25 5.50 8.0% Aug 4.00 4.50 4.20 3.25 4.20 4.50 7.3% Sep 4.00 4.50 5.00 3.10 4.00 4.50 7.5% Oct 4.50 4.80 4.00 3.20 3.75 4.50 7.3% Nov 4.00 4.50 4.30 2.80 2.50 5.00 6.9% Dec 3.75 4.00 4.10 2.50 2.50 4.25 6.3% Jan 3.50 3.50 2.70 2.10 2.50 3.25 5.2% Feb 3.25 4.75 4.75 4.25 3.50 4.00 7.3% Total Crush 52.00 62.65 64.55 46.00 51.20 60.50 100.00% 35% 25% 22% 18% (Figures in Lac MT) 15
  • 16. Monthly Average Prices of Jaipur Kachi Ghani Rapeseed Oil and Indore Refined Soybean Oil And Spread Between Two Oils 2014-15 2015-16 2016-17 2017-18 Month Kachi SBOR K.Ghani Kachi SBOR K.Ghani Kachi SBOR K.Ghani Kachi SBOR K.Ghani Ghani Indore (-) Ghani Indore (-) Ghani Indore (-) Ghani Indore (-) Jaipur SBOR Jaipur SBOR Jaipur SBOR Jaipur SBOR Mar 697 688 9 704 598 106 755 615 140 739 658 81 Apr 670 685 -15 729 602 127 828 649 179 731 629 102 May 677 681 -4 817 606 211 827 635 192 716 626 90 Qtr Avg. 681 685 -3 750 602 148 803 633 170 729 638 91 Jun 678 659 19 877 611 266 854 637 217 702 627 75 July 718 654 64 884 595 289 925 598 327 749 637 112 Aug 727 619 108 882 581 301 942 635 307 783 646 137 Qtr Avg. 708 644 64 881 596 285 907 623 284 745 637 108 Sep 736 601 135 907 579 328 913 648 265 791 664 127 Oct 728 605 123 1054 627 427 876 656 220 781 665 116 Nov 735 585 150 1032 614 418 866 686 180 804 701 103 Qtr Avg. 733 597 136 998 607 391 885 663 222 792 677 115 Dec 785 598 187 947 630 317 859 726 133 809 715 94 Jan 799 662 137 844 613 231 826 728 98 788 735 53 Feb 740 621 119 793 616 177 774 689 85 790 738 52 Qtr Avg. 775 627 148 861 620 242 820 714 106 796 729 66 Yearly Avg. 724 638 86 873 606 267 854 655 199 765 670 95 (Rs/10 Kg.) 16
  • 17. Monthly Average Prices Rapeseed Oil and Soybean Oil CIF Kandla for Nearby Shipment And Spread Between Two Oils Month 2016-17 2017-18 Rapeseed Soybean Rapeseed Oil Rapeseed Soybean Rapeseed Oil Oil Oil (-) Oil Oil (-) $/T $/T Soybean Oil $/T $/T Soybean Oil Mar 733 751 -18 807 767 40 Apr 801 788 13 799 756 43 May 790 776 14 810 794 16 Qtr Avg. 775 772 3 805 772 33 Jun 778 768 10 796 798 -2 July 758 751 7 807 801 6 Aug 789 806 -17 831 816 15 Qtr Avg. 775 775 - 811 805 6 Sep 797 801 -4 865 834 31 Oct 823 827 -4 853 829 24 Nov 855 841 14 866 839 27 Qtr Avg. 825 823 2 861 834 27 Dec 897 885 12 850 812 38 Jan 880 856 24 852 821 31 Feb 847 808 39 841 810 31 Qtr Avg. 875 850 25 848 814 33 Yearly Avg. 812 805 7 831 806 25 ($/T) 17
  • 18. NAFED Procurement of Rapeseed From Farmers During 2017/18 Rabi Season (Upto 30 June 2018) State Qty Lac MT Rajasthan 4.70 Haryana 2.30 M.P. 1.20 Gujarat 0.50 U.P. 0.01 TOTAL 8.71 NAFED purchased Rapeseed from farmers on MSP of Rs.3900 + Bonus Rs.100 = Rs.4000 per qtl. Month-wise Purchase Month Qty Lac MT April 2.50 May 3.86 June 2.35 TOTAL 8.71 18
  • 19. Rapeseed Arrival & Crush During Current Season (Lac MT) Month Arrival (Except Nafed) Crushing 16-28 Feb’18 2.25 2.25 Mar’18 12.60 6.20 Apr’18 11.00 9.00 May’18 8.35 8.00 Jun’18 5.60 7.00 TOTAL 39.80 32.45 Details Upto 30.06.18 (Lac MT) Arrival (Except Nafed) 39.80 Less : Crush 32.45 Less : Direct Use/Export 1.20 Stock With Farmers, Processors & Stockist 30.40 B/S for Remaining Period of the Season (Lac MT) Stock With Farmers, Processors & Stockist 30.40 Stock with Nafed 8.71 Total Available as on 01.07.18 39.11 Less : Carry-forward for Next Season 5.00 Available for Crushing 34.11 Average per month available for crushing for remaining 8.5 months of the season 4.00 Lac MT/month (Last year 4.10 Lac MT/month). (Lac MT) 19
  • 20. 20 :: Rajkot Office :: 908, Alpha Plus, 150 Feet Ring Road, Near Raiya Telephone Exchange, Rajkot, Gujarat - 360005, India, Ph No.: +91 7069690020, Email : contact@ggnresearch.com Mr. Govindbhai Patel : Mobile No. 98250 78462 :: Indore Office :: 401, Princess Empire, 12, Race Course Road, Indore, MP - 452001, India, Ph No.: +91 731 4015010, Email : contact@ggnresearch.com Mr. Nirav Desai : Mobile No. 99933 17000 Contact Us