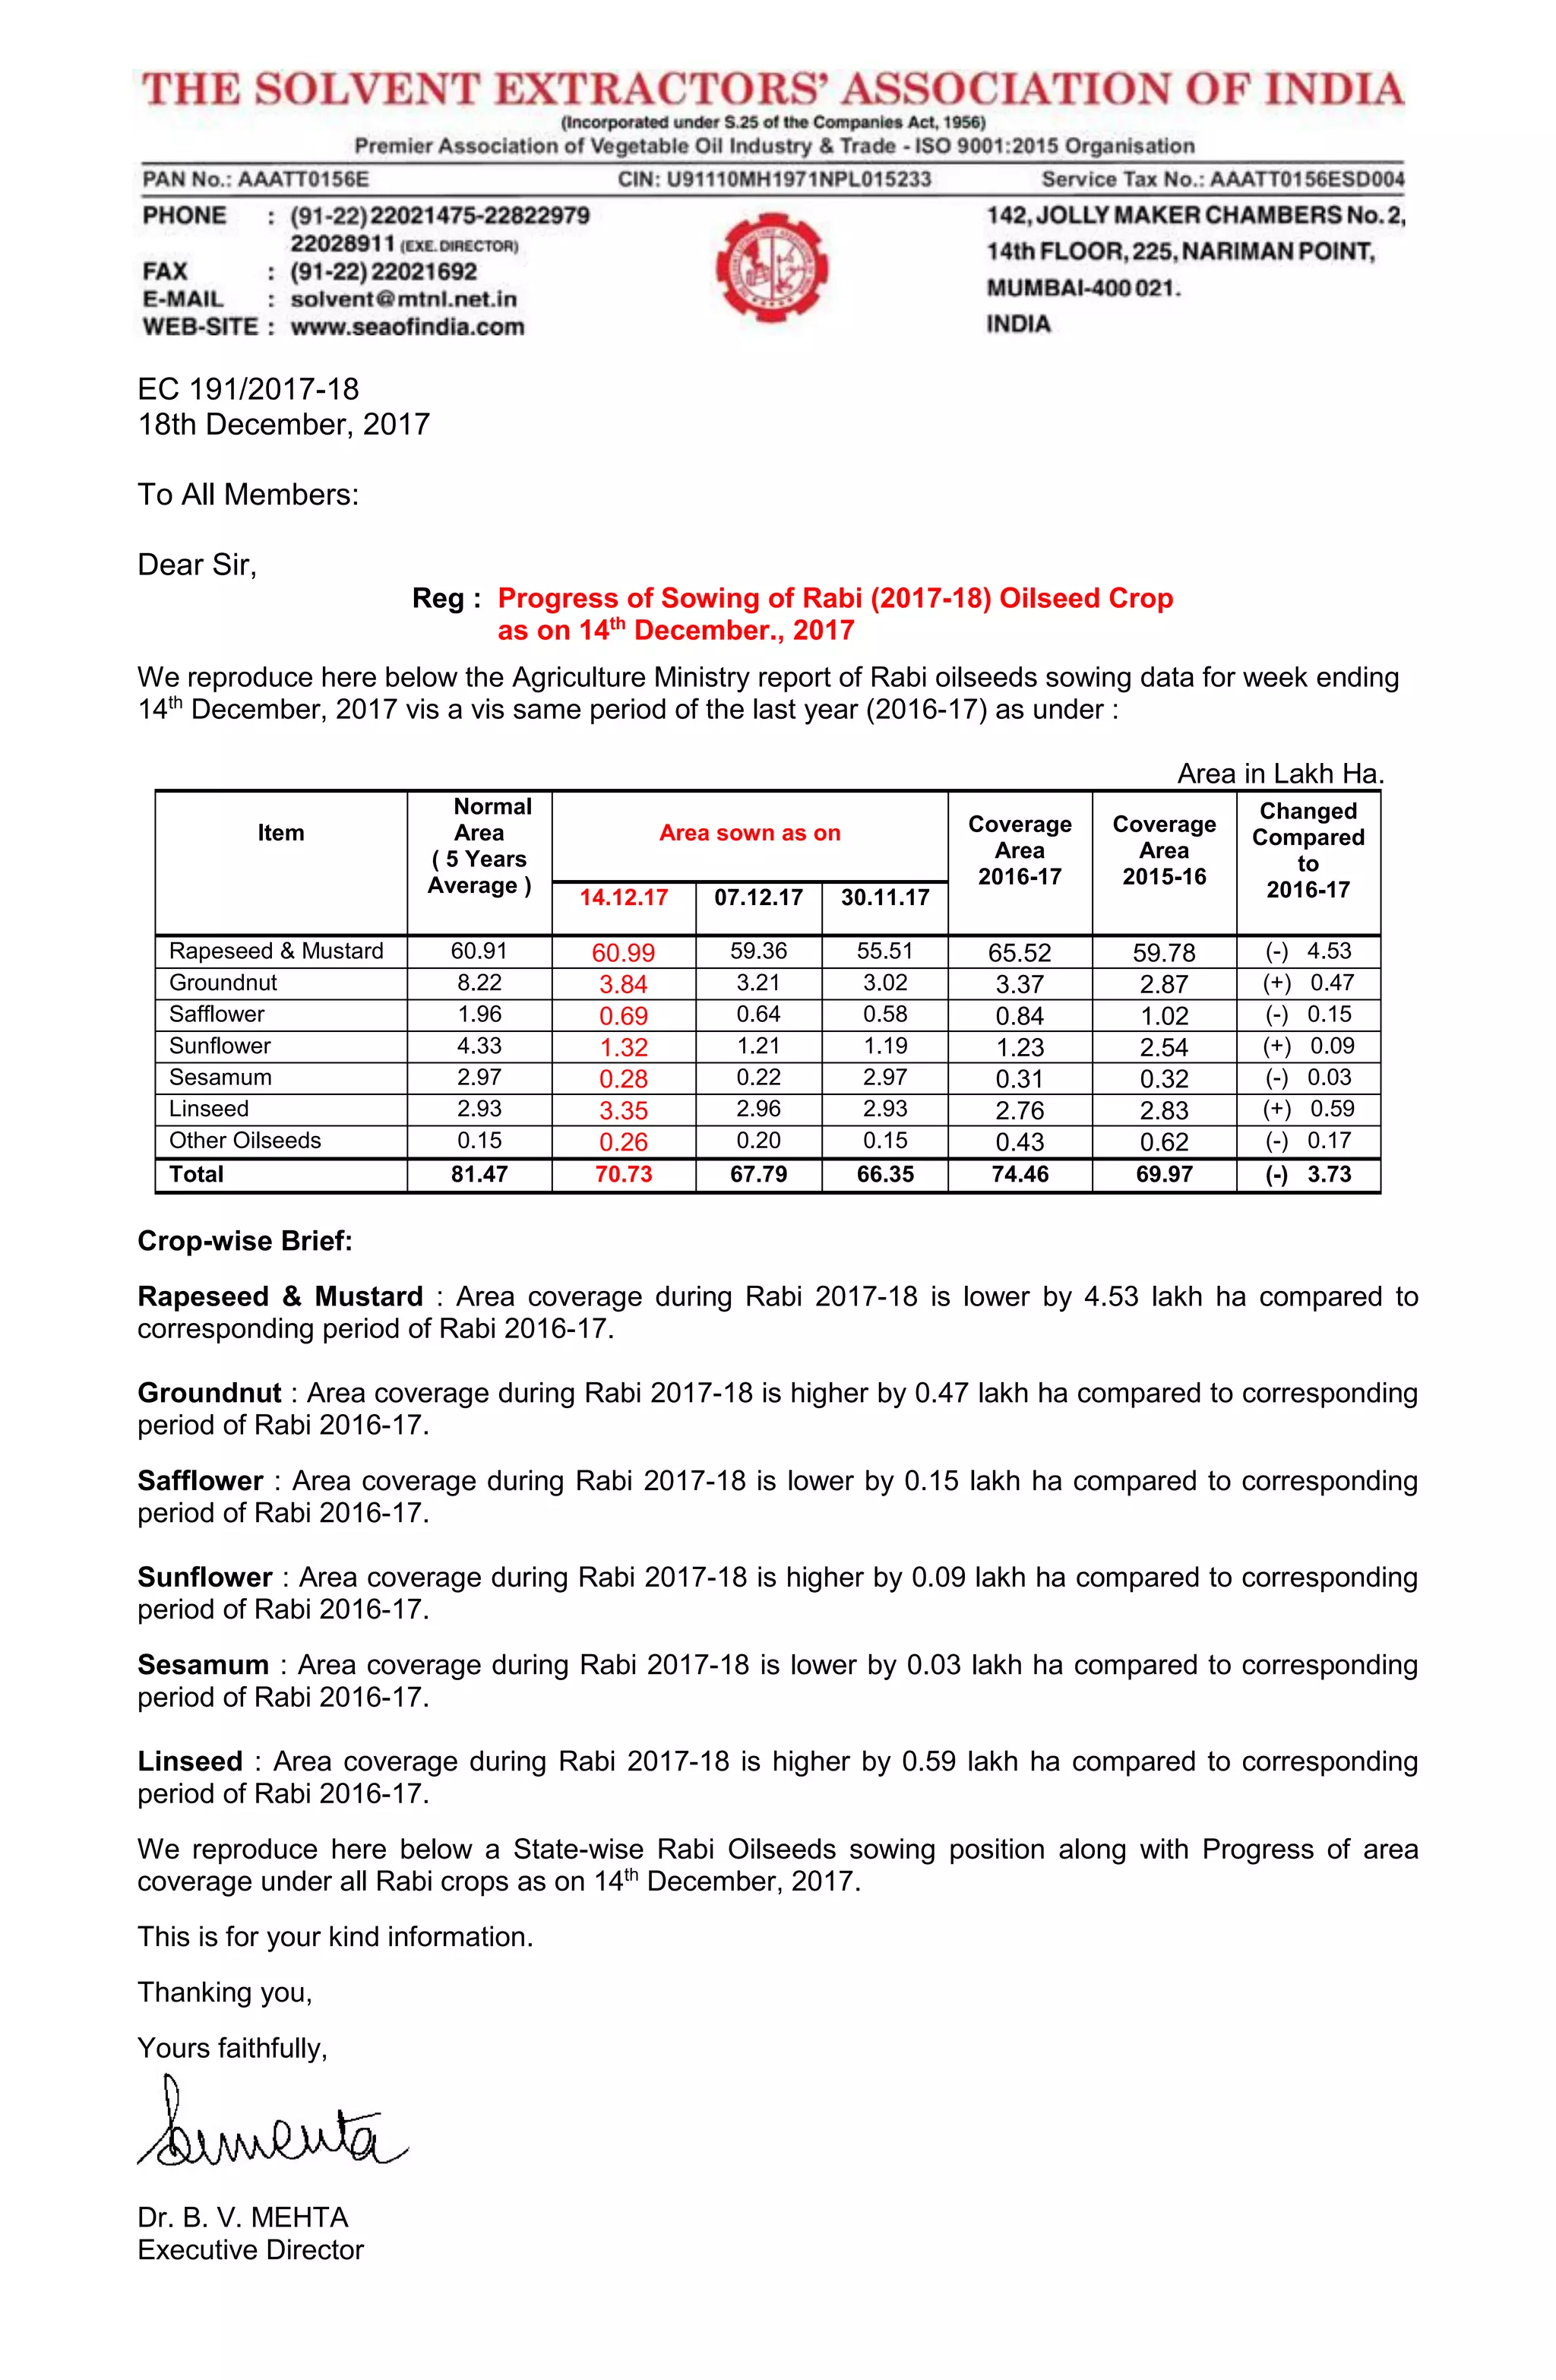
EC 191/2017-18
18th December, 2017
To All Members:
Dear Sir,
Reg : Progress of Sowing of Rabi (2017-18) Oilseed Crop
as on 14th
December., 2017
We reproduce here below the Agriculture Ministry report of Rabi oilseeds sowing data for week ending
14th
December, 2017 vis a vis same period of the last year (2016-17) as under :
Area in Lakh Ha.
Item
Normal
Area
( 5 Years
Average )
Area sown as on Coverage
Area
2016-17
Coverage
Area
2015-16
Changed
Compared
to
2016-1714.12.17 07.12.17 30.11.17
Rapeseed & Mustard 60.91 60.99 59.36 55.51 65.52 59.78 (-) 4.53
Groundnut 8.22 3.84 3.21 3.02 3.37 2.87 (+) 0.47
Safflower 1.96 0.69 0.64 0.58 0.84 1.02 (-) 0.15
Sunflower 4.33 1.32 1.21 1.19 1.23 2.54 (+) 0.09
Sesamum 2.97 0.28 0.22 2.97 0.31 0.32 (-) 0.03
Linseed 2.93 3.35 2.96 2.93 2.76 2.83 (+) 0.59
Other Oilseeds 0.15 0.26 0.20 0.15 0.43 0.62 (-) 0.17
Total 81.47 70.73 67.79 66.35 74.46 69.97 (-) 3.73
Crop-wise Brief:
Rapeseed & Mustard : Area coverage during Rabi 2017-18 is lower by 4.53 lakh ha compared to
corresponding period of Rabi 2016-17.
Groundnut : Area coverage during Rabi 2017-18 is higher by 0.47 lakh ha compared to corresponding
period of Rabi 2016-17.
Safflower : Area coverage during Rabi 2017-18 is lower by 0.15 lakh ha compared to corresponding
period of Rabi 2016-17.
Sunflower : Area coverage during Rabi 2017-18 is higher by 0.09 lakh ha compared to corresponding
period of Rabi 2016-17.
Sesamum : Area coverage during Rabi 2017-18 is lower by 0.03 lakh ha compared to corresponding
period of Rabi 2016-17.
Linseed : Area coverage during Rabi 2017-18 is higher by 0.59 lakh ha compared to corresponding
period of Rabi 2016-17.
We reproduce here below a State-wise Rabi Oilseeds sowing position along with Progress of area
coverage under all Rabi crops as on 14th
December, 2017.
This is for your kind information.
Thanking you,
Yours faithfully,
Dr. B. V. MEHTA
Executive Director
THE SOLVENT EXTRACTORS’ ASSOCIATION OF INDIA
STATEWISE AREA COVERED UNDER RABI OILSEEDS
FOR WEEK ENDING AS ON 14th
December, 2017
Area in Lakh Ha.
Sr.
No
State Rapeseed &
Mustard
Groundnut Safflower Sunflower Sesamum Linseed Other
Oilseeds
Total
2017-
18
2016-
17
2017-
18
2016-
17
2017-
18
2016
-17
2017-
18
2016-
17
2017-
18
2016
-17
2017
-18
2016-
17
2017-
18
2016
-17
2017-
18
2016-
17
1. Andhra Pradesh -- -- 0.43 0.23 -- -- 0.03 0.03 0.03 0.02 -- -- 0.05 0.06 0.54 0.35
2. Telangana -- -- 1.22 1.35 0.02 0.02 0.01 0.06 -- -- -- -- 0.02 -- 1.27 1.43
3. Arunachal Pradesh 0.07 0.29 -- -- -- -- -- -- -- -- -- -- -- -- 0.07 0.29
4. Assam 2.52 2.79 -- -- -- -- -- -- -- -- 0.06 0.04 0.05 -- 2.63 2.83
5. Bihar 1.22 1.19 -- -- -- -- 0.02 0.02 -- -- 0.30 0.31 -- -- 1.54 1.52
6. Chhattisgarh 1.12 0.96 0.02 0.01 0.02 0.02 -- -- 0.01 0.03 0.32 0.33 0.02 0.02 1.51 1.37
7. Gujarat 2.17 1.98 -- -- -- -- -- -- -- -- -- -- 0.02 0.21 2.19 2.19
8. Haryana 5.83 5.34 -- -- -- -- -- -- -- -- -- -- -- -- 5.83 5.34
9. Himachal Pradesh 0.06 0.08 -- -- -- -- -- -- -- -- 0.02 -- -- -- 0.08 0.08
10. Jammu & Kashmir 0.17 0.19 -- -- -- -- -- -- -- -- -- -- -- -- 0.17 0.19
11. Jharkhand 2.03 0.33 -- -- 0.01 -- 0.01 -- -- -- 0.29 -- -- -- 2.34 0.33
12. Karnataka -- -- 1.11 1.04 0.34 0.30 1.14 0.94 -- -- 0.04 0.03 -- -- 2.64 2.31
13. Kerala -- -- -- -- -- -- -- -- -- -- -- -- -- -- -- --
14. Madhya Pradesh 7.29 6.84 -- -- -- -- -- -- -- -- 1.57 1.39 -- -- 8.86 8.23
15. Maharashtra -- -- -- -- 0.30 0.50 0.03 0.08 0.01 0.01 0.08 0.12 0.03 0.06 0.45 0.76
16. Odisha 0.69 0.79 0.40 0.49 -- -- 0.02 0.01 0.14 0.16 0.06 0.08 0.04 0.05 1.34 1.58
17. Punjab 0.39 0.43 -- -- -- -- 0.01 -- -- -- -- -- -- -- 0.39 0.43
18. Rajasthan 20.55 27.67 -- -- -- -- -- -- -- -- 0.24 0.01 -- -- 20.79 27.68
19. Tamil Nadu -- -- 0.59 0.18 -- -- 0.03 0.04 0.09 0.09 -- -- 0.01 0.01 0.71 0.31
20. Uttar Pradesh 11.99 11.76 -- -- -- -- -- -- -- -- 0.29 0.37 -- -- 12.28 12.13
21. Uttarakhand 0.17 0.17 -- -- -- -- -- -- -- -- 0.01 -- -- -- 0.17 0.17
22. West Bengal 4.50 4.40 0.07 0.07 -- -- 0.02 0.04 -- -- 0.03 0.04 0.02 0.02 4.64 4.58
23. Others 0.23 0.31 -- -- -- -- 0.02 0.01 -- -- 0.04 0.04 -- -- 0.28 0.36
Total – All India 60.99 65.52 3.84 3.37 0.69 0.84 1.32 1.23 0.28 0.31 3.35 2.76 0.26 0.43 70.73 74.46.
Source: Ministry of Agriculture, GOI
File : Rabi Crop Wise Summary 2017-18
#198 Progress of Rabi Sowing data as on 18th December 2017

#198 Progress of Rabi Sowing data as on 18th December 2017

  • 1.
    EC 191/2017-18 18th December,2017 To All Members: Dear Sir, Reg : Progress of Sowing of Rabi (2017-18) Oilseed Crop as on 14th December., 2017 We reproduce here below the Agriculture Ministry report of Rabi oilseeds sowing data for week ending 14th December, 2017 vis a vis same period of the last year (2016-17) as under : Area in Lakh Ha. Item Normal Area ( 5 Years Average ) Area sown as on Coverage Area 2016-17 Coverage Area 2015-16 Changed Compared to 2016-1714.12.17 07.12.17 30.11.17 Rapeseed & Mustard 60.91 60.99 59.36 55.51 65.52 59.78 (-) 4.53 Groundnut 8.22 3.84 3.21 3.02 3.37 2.87 (+) 0.47 Safflower 1.96 0.69 0.64 0.58 0.84 1.02 (-) 0.15 Sunflower 4.33 1.32 1.21 1.19 1.23 2.54 (+) 0.09 Sesamum 2.97 0.28 0.22 2.97 0.31 0.32 (-) 0.03 Linseed 2.93 3.35 2.96 2.93 2.76 2.83 (+) 0.59 Other Oilseeds 0.15 0.26 0.20 0.15 0.43 0.62 (-) 0.17 Total 81.47 70.73 67.79 66.35 74.46 69.97 (-) 3.73 Crop-wise Brief: Rapeseed & Mustard : Area coverage during Rabi 2017-18 is lower by 4.53 lakh ha compared to corresponding period of Rabi 2016-17. Groundnut : Area coverage during Rabi 2017-18 is higher by 0.47 lakh ha compared to corresponding period of Rabi 2016-17. Safflower : Area coverage during Rabi 2017-18 is lower by 0.15 lakh ha compared to corresponding period of Rabi 2016-17. Sunflower : Area coverage during Rabi 2017-18 is higher by 0.09 lakh ha compared to corresponding period of Rabi 2016-17. Sesamum : Area coverage during Rabi 2017-18 is lower by 0.03 lakh ha compared to corresponding period of Rabi 2016-17. Linseed : Area coverage during Rabi 2017-18 is higher by 0.59 lakh ha compared to corresponding period of Rabi 2016-17. We reproduce here below a State-wise Rabi Oilseeds sowing position along with Progress of area coverage under all Rabi crops as on 14th December, 2017. This is for your kind information. Thanking you, Yours faithfully, Dr. B. V. MEHTA Executive Director
  • 2.
    THE SOLVENT EXTRACTORS’ASSOCIATION OF INDIA STATEWISE AREA COVERED UNDER RABI OILSEEDS FOR WEEK ENDING AS ON 14th December, 2017 Area in Lakh Ha. Sr. No State Rapeseed & Mustard Groundnut Safflower Sunflower Sesamum Linseed Other Oilseeds Total 2017- 18 2016- 17 2017- 18 2016- 17 2017- 18 2016 -17 2017- 18 2016- 17 2017- 18 2016 -17 2017 -18 2016- 17 2017- 18 2016 -17 2017- 18 2016- 17 1. Andhra Pradesh -- -- 0.43 0.23 -- -- 0.03 0.03 0.03 0.02 -- -- 0.05 0.06 0.54 0.35 2. Telangana -- -- 1.22 1.35 0.02 0.02 0.01 0.06 -- -- -- -- 0.02 -- 1.27 1.43 3. Arunachal Pradesh 0.07 0.29 -- -- -- -- -- -- -- -- -- -- -- -- 0.07 0.29 4. Assam 2.52 2.79 -- -- -- -- -- -- -- -- 0.06 0.04 0.05 -- 2.63 2.83 5. Bihar 1.22 1.19 -- -- -- -- 0.02 0.02 -- -- 0.30 0.31 -- -- 1.54 1.52 6. Chhattisgarh 1.12 0.96 0.02 0.01 0.02 0.02 -- -- 0.01 0.03 0.32 0.33 0.02 0.02 1.51 1.37 7. Gujarat 2.17 1.98 -- -- -- -- -- -- -- -- -- -- 0.02 0.21 2.19 2.19 8. Haryana 5.83 5.34 -- -- -- -- -- -- -- -- -- -- -- -- 5.83 5.34 9. Himachal Pradesh 0.06 0.08 -- -- -- -- -- -- -- -- 0.02 -- -- -- 0.08 0.08 10. Jammu & Kashmir 0.17 0.19 -- -- -- -- -- -- -- -- -- -- -- -- 0.17 0.19 11. Jharkhand 2.03 0.33 -- -- 0.01 -- 0.01 -- -- -- 0.29 -- -- -- 2.34 0.33 12. Karnataka -- -- 1.11 1.04 0.34 0.30 1.14 0.94 -- -- 0.04 0.03 -- -- 2.64 2.31 13. Kerala -- -- -- -- -- -- -- -- -- -- -- -- -- -- -- -- 14. Madhya Pradesh 7.29 6.84 -- -- -- -- -- -- -- -- 1.57 1.39 -- -- 8.86 8.23 15. Maharashtra -- -- -- -- 0.30 0.50 0.03 0.08 0.01 0.01 0.08 0.12 0.03 0.06 0.45 0.76 16. Odisha 0.69 0.79 0.40 0.49 -- -- 0.02 0.01 0.14 0.16 0.06 0.08 0.04 0.05 1.34 1.58 17. Punjab 0.39 0.43 -- -- -- -- 0.01 -- -- -- -- -- -- -- 0.39 0.43 18. Rajasthan 20.55 27.67 -- -- -- -- -- -- -- -- 0.24 0.01 -- -- 20.79 27.68 19. Tamil Nadu -- -- 0.59 0.18 -- -- 0.03 0.04 0.09 0.09 -- -- 0.01 0.01 0.71 0.31 20. Uttar Pradesh 11.99 11.76 -- -- -- -- -- -- -- -- 0.29 0.37 -- -- 12.28 12.13 21. Uttarakhand 0.17 0.17 -- -- -- -- -- -- -- -- 0.01 -- -- -- 0.17 0.17 22. West Bengal 4.50 4.40 0.07 0.07 -- -- 0.02 0.04 -- -- 0.03 0.04 0.02 0.02 4.64 4.58 23. Others 0.23 0.31 -- -- -- -- 0.02 0.01 -- -- 0.04 0.04 -- -- 0.28 0.36 Total – All India 60.99 65.52 3.84 3.37 0.69 0.84 1.32 1.23 0.28 0.31 3.35 2.76 0.26 0.43 70.73 74.46. Source: Ministry of Agriculture, GOI File : Rabi Crop Wise Summary 2017-18