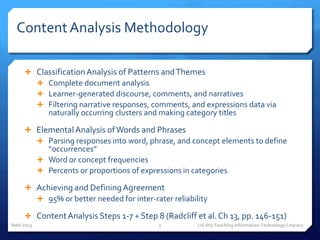
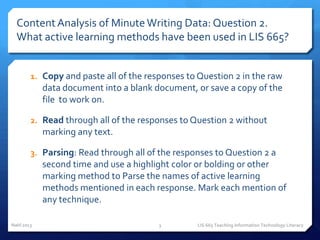
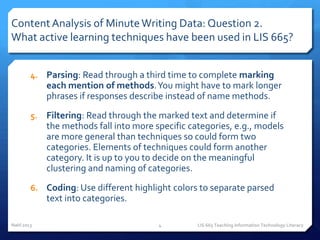
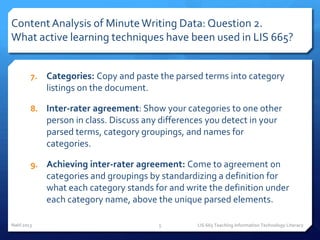
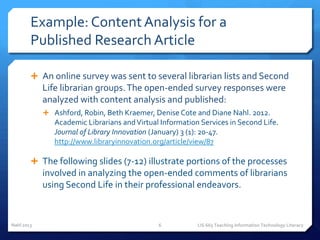
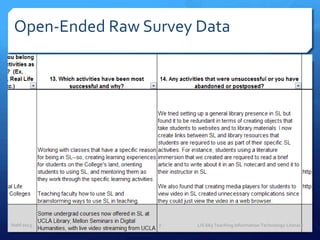
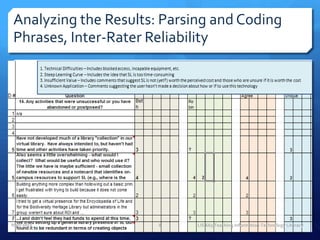
THE IMPACT OF USING VISUAL PROGRAMMING ENVIRONMENT TOWARDS COLLEGE STUDENTS’ ...ijma
ABSTRACT
This study aimed to identify the impact of using a visual programming environment on college students’ achievement and understanding when learning computer programming. In this quasi-experimental study, 91 students were divided systematically into an experimental group (53 students) and a control group (38 students). The experimental group were exposed with a visual programming environment while the control group were using an ordinary text-based programming environment. Data was collected using pre-test and post-test, then analysed using paired t-test, independent sample t-test and thematic content analysis. A significant increase in the students’ achievement was recorded during the paired t-test for both groups. However, there is no significant difference in the students’ achievement between the groups. Surprisingly, the thematic analysis showed that students’ understanding in the experimental group were improved relatively better than in the control group. Thus, we conclude that visual programming environment have better impact to the students’ understanding.
This is an updated version of my presentation at LAK12 that includes related research on TEL RecSys and the new LinkedUp project that will address the current challenges we are facing like the lack of datasets, common evaluation framework and real world examples for LA and data supported education.
The role of data in the provision of feedback at scaleAbelardo Pardo
Technology mediation allows to capture comprehensive data sets about interactions occurring in learning experiences. Although these data sets have the potential of increasing the insight on how learning occurs, their use strongly depends on two aspects: the data has to be properly situated in the learning design, and the insights derived need to be translated into actions. In this talk we will explore how to establish this connection for the case of the provision of feedback. We will approach the problem from the point of view of intelligence amplification, that is, how data can support instructors to provide better support to learners through feedback. The talk will discuss some preliminary results from the Ontasklearning.org project.
Articulating the connection between Learning Design and Learning AnalyticsAbelardo Pardo
Learning analytics is a discipline that uses data captured by technology during a learning experience to increase our level of understanding, increase its quality, and improve the environment in which it occurs. But these experiences need to be designed first. In this talk we start from the statement that there is no such thing as a neutral design. In the era of increasing technology mediation Learning experiences need to be designed considering the capacity to capture data, the possibility of making sense and derive knowledge from the data, and the need to act on that knowledge. In this talk we will explore some initiatives to make these connections explicit in a learning design. Using a flipped learning experience, we will explore how to embed data and data analysis as part of the design tasks.
The role of data in the provision of feedback at scaleAbelardo Pardo
The abundance of data in learning environments poses both a potential and a challenge. Improvements in the student experience need a strong connection between data, learning design and the delivery platform. In this talk we explore some ideas on how to establish this connection with respect to feedback.
Supporting Online Learning with Distributed Teaching Presence indicatorsgrintie
Bustos, A., Coll, C., & Engel A. (2011). Supporting Online Learning with Distributed Teaching Presence Indicators. Paper presented at the Symposium Informing CSCL participants about their collaboration to promote collective and individual learning: Awareness tools to support collaboration, 14th EARLI Biennial Conference, Exeter, UK, August 29-September 3rd.
Provision of personalized feedback at scale using learning analyticsAbelardo Pardo
The increasing presence of technology mediation offers an unprecedented opportunity to use detailed data sets about the interactions that occur while a learning experience is being enacted. Areas such as Learning Analytics or Educational Data Mining have explored numerous algorithms and techniques to process these data sets. Additionally, technology now offers the opportunity to increase the immediacy of interventions. However, not much emphasis has been placed on how to extract truly actionable knowledge and how to bring it effectively as part of a learning experience. In this talk, we will use the concept of feedback as the focus to establish a specific connection between the knowledge derived from data-analysis procedures and the actions that can be immediately deployed in a learning environment. We will discuss how there is a trade-off between low-level automatic feedback and high-level complex feedback and how technology can provide efficient solutions for the case of large or highly diverse cohorts.
Designing Engaging Learning Experiences in Digital EnvironmentsAbelardo Pardo
Talk about how to address the design of learning experiences in the current digital environments and how to take into account the student perspective, motivation, feedback, and other various aspects.
The role of institutional data in Learning AnalyticsAbelardo Pardo
Learning analytics has the potential of improving how higher education institutions operate. A significant portion of this potential derives from the use of institutional data. In this talk we review the role of these units in achieving institutional capacity and show some examples of the type of solutions possible at the level of instructors.
Confidence in Learning Analytics aka. The Pulse of Learning AnalyticsHendrik Drachsler
Presentation of the paper by Drachsler & Greller on Confidence in Learning Analytics given at LAK12 conference, April 30th 2012, Vancouver, Canada
Data and survey available at:
http://bit.ly/la_survey
Introducing the i pad in a norwegian high schoolFrode Kyrkjebø
Report written by Henrik Valstad about introducing the iPad as a pedagogic device in school. The project was initiated and managed by Sør-Trønedalg fylkeskommune - futuristic classrooms, the report was written as a graduation thesis at NTNU.
A powerful feature of online instruction is the ability to embed assessment throughout and capture data on how students are learning. The TAACCCT program calls on institutions to use such data to “continuously assess the effectiveness of their strategies in order to improve their program… and build evidence about effective practice.” In this interactive session, we will share the OLI approach to data driven continuous improvement. Together we will discuss strategies for using learning data to refine course materials by examining examples from our project. We will also present an overview of the learning data and tools available to co-development and Platform+ participants.
Designing instruction for Knowledge Management Processes using a wiki.
The Annual International Conference on Management and Technology in Knowledge, Service, Tourism & Hospitality 2013 (SERVE 2013)
Model Attribute Check Company Auto PropertyCeline George
In Odoo, the multi-company feature allows you to manage multiple companies within a single Odoo database instance. Each company can have its own configurations while still sharing common resources such as products, customers, and suppliers.
Biological screening of herbal drugs: Introduction and Need for
Phyto-Pharmacological Screening, New Strategies for evaluating
Natural Products, In vitro evaluation techniques for Antioxidants, Antimicrobial and Anticancer drugs. In vivo evaluation techniques
for Anti-inflammatory, Antiulcer, Anticancer, Wound healing, Antidiabetic, Hepatoprotective, Cardio protective, Diuretics and
Antifertility, Toxicity studies as per OECD guidelines
How to Make a Field invisible in Odoo 17Celine George
It is possible to hide or invisible some fields in odoo. Commonly using “invisible” attribute in the field definition to invisible the fields. This slide will show how to make a field invisible in odoo 17.
Synthetic Fiber Construction in lab .pptxPavel ( NSTU)
Synthetic fiber production is a fascinating and complex field that blends chemistry, engineering, and environmental science. By understanding these aspects, students can gain a comprehensive view of synthetic fiber production, its impact on society and the environment, and the potential for future innovations. Synthetic fibers play a crucial role in modern society, impacting various aspects of daily life, industry, and the environment. ynthetic fibers are integral to modern life, offering a range of benefits from cost-effectiveness and versatility to innovative applications and performance characteristics. While they pose environmental challenges, ongoing research and development aim to create more sustainable and eco-friendly alternatives. Understanding the importance of synthetic fibers helps in appreciating their role in the economy, industry, and daily life, while also emphasizing the need for sustainable practices and innovation.
Francesca Gottschalk - How can education support child empowerment.pptxEduSkills OECD
Francesca Gottschalk from the OECD’s Centre for Educational Research and Innovation presents at the Ask an Expert Webinar: How can education support child empowerment?
Instructions for Submissions thorugh G- Classroom.pptxJheel Barad
This presentation provides a briefing on how to upload submissions and documents in Google Classroom. It was prepared as part of an orientation for new Sainik School in-service teacher trainees. As a training officer, my goal is to ensure that you are comfortable and proficient with this essential tool for managing assignments and fostering student engagement.
How libraries can support authors with open access requirements for UKRI fund...
665 Session10-content analysis-s13
1. Content Analysis of
Open-Ended Responses
LIS 665 Teaching Information Technology Literacy * Dr. Diane Nahl
University of Hawaii * LIS Program * Spring 2013
2. Content Analysis Methodology
Classification Analysis of Patterns and Themes
Complete document analysis
Learner-generated discourse, comments, and narratives
Filtering narrative responses, comments, and expressions data via
naturally occurring clusters and making category titles
Elemental Analysis of Words and Phrases
Parsing responses into word, phrase, and concept elements to define
“occurrences”
Word or concept frequencies
Percents or proportions of expressions in categories
Achieving and Defining Agreement
95% or better needed for inter-rater reliability
Content Analysis Steps 1-7 + Step 8 (Radcliff et al. Ch 13, pp. 146-151)
Nahl 2013 2 LIS 665 Teaching Information Technology Literacy
3. Content Analysis of Minute Writing Data: Question 2.
What active learning methods have been used in LIS 665?
1. Copy and paste all of the responses to Question 2 in the raw
data document into a blank document, or save a copy of the
file to work on.
2. Read through all of the responses to Question 2 without
marking any text.
3. Parsing: Read through all of the responses to Question 2 a
second time and use a highlight color or bolding or other
marking method to Parse the names of active learning
methods mentioned in each response. Mark each mention of
any technique.
Nahl 2013 3 LIS 665 Teaching Information Technology Literacy
4. Content Analysis of Minute Writing Data: Question 2.
What active learning techniques have been used in LIS 665?
4. Parsing: Read through a third time to complete marking
each mention of methods. You might have to mark longer
phrases if responses describe instead of name methods.
5. Filtering: Read through the marked text and determine if
the methods fall into more specific categories, e.g., models
are more general than techniques so could form two
categories. Elements of techniques could form another
category. It is up to you to decide on the meaningful
clustering and naming of categories.
6. Coding: Use different highlight colors to separate parsed
text into categories.
Nahl 2013 4 LIS 665 Teaching Information Technology Literacy
5. Content Analysis of Minute Writing Data: Question 2.
What active learning techniques have been used in LIS 665?
7. Categories: Copy and paste the parsed terms into category
listings on the document.
8. Inter-rater agreement: Show your categories to one other
person in class. Discuss any differences you detect in your
parsed terms, category groupings, and names for
categories.
9. Achieving inter-rater agreement: Come to agreement on
categories and groupings by standardizing a definition for
what each category stands for and write the definition under
each category name, above the unique parsed elements.
Nahl 2013 5 LIS 665 Teaching Information Technology Literacy
6. Example: Content Analysis for a
Published Research Article
An online survey was sent to several librarian lists and Second
Life librarian groups. The open-ended survey responses were
analyzed with content analysis and published:
Ashford, Robin, Beth Kraemer, Denise Cote and Diane Nahl. 2012.
Academic Librarians and Virtual Information Services in Second Life.
Journal of Library Innovation (January) 3 (1): 20-47.
http://www.libraryinnovation.org/article/view/87
The following slides (7-12) illustrate portions of the processes
involved in analyzing the open-ended comments of librarians
using Second Life in their professional endeavors.
Nahl 2013 6 LIS 665 Teaching Information Technology Literacy
7. Open-Ended Raw Survey Data
Nahl 2013 7 LIS 665 Teaching Information Technology Literacy
8. Analyzing the Results: Parsing and Coding
Phrases, Inter-Rater Reliability
Nahl 2013 8 LIS 665 Teaching Information Technology Literacy
9. Analyzing the Results:
Categorizing the Comments
1. Successes
o Collaboration & Connecting
o Professional Development
o Reference & Instruction Opportunities
o Socializing
o Content Creation
2. Obstacles
o Technical Difficulties
o Steep Learning Curve
o Insufficient Value
o Unknown Application
Nahl 2013 9 LIS 665 Teaching Information Technology Literacy
12. Table 1: Academic Librarians in Second Life:
Five Major Role Categories and Four Areas of Difficulty
N comments made in Successes Categories % Total %
each category
35 Collaboration & Connecting 29 %
42 Professional Development 31 %
54 Reference & Instruction 36 %
2 Socializing 1%
19 Content Creation 13 %
152 TOTAL 100 % 152 77%
Challenges Categories
6 Technical Difficulties 13 %
12 Steep Learning Curve 26 %
16 Insufficient Value 35 %
12 Unknown Application 26 %
46 TOTAL 100 % 46 23 %
Grand Total All Comments 198 100 %
Ashford, Robin, Beth Kraemer, Denise Cote and Diane Nahl. 2012. Academic Librarians and Virtual Information Services in Second Life.
Journal of Library Innovation (January) 3 (1): 20-47. http://www.libraryinnovation.org/article/view/87
13. Next Week
Radcliff et al. Ch 14; ACRL 2003, 2007; IL IQ
Bring your content analysis results to class for an exercise in
summarizing textual/comment data
Graphing numerical results
Bring your numerical data to class in a spreadsheet for an exercise
in making and discussing figures and tables
Instruction Unit due April 4
Part I: Individual report on all elements
Part II: All Team member names on cover page.
Includes all materials used in session, instructional sequence, keys to
worksheet scoring; and all activities, worksheets, and evaluations keyed
to outcomes (ACRL SPIOs and ACS codes).
Nahl 2013 13 LIS 665 Teaching Information Technology Literacy