Download as PDF, PPTX

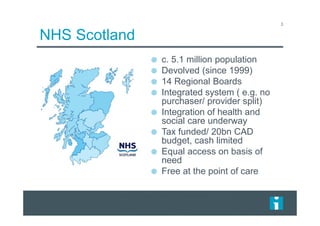
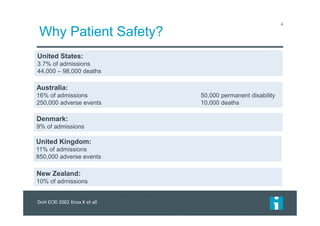
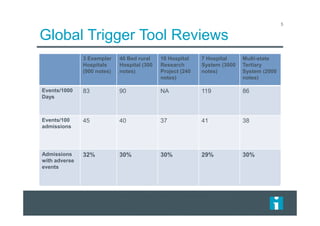


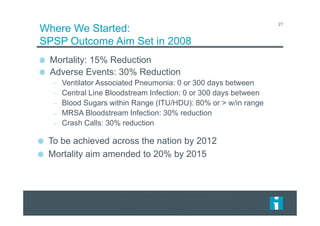
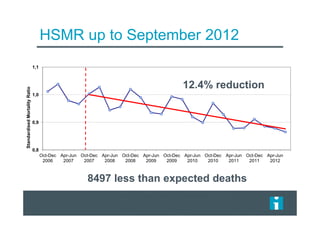
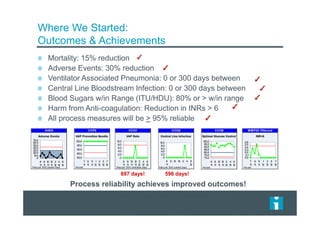
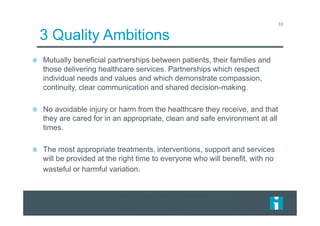
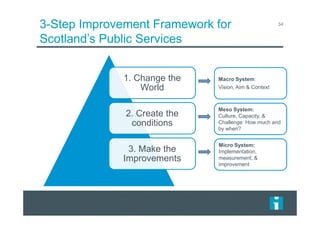
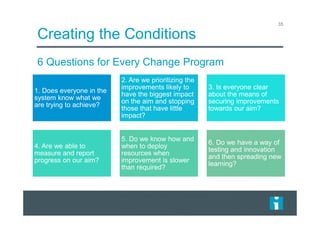


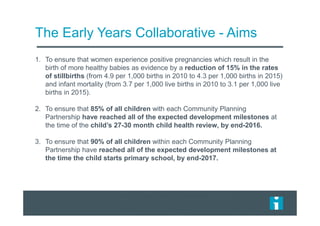
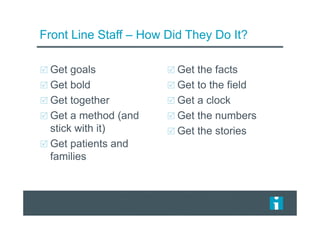


This document summarizes a presentation on implementing and scaling patient safety programs nationally in Scotland. It discusses how Scotland implemented a national patient safety program across all hospitals to reduce mortality and adverse events. Key points included establishing clear aims to reduce mortality by 15% and adverse events by 30%, implementing improvement programs in five areas, achieving significant reductions in outcomes like ventilator-associated pneumonia and central line infections, and creating the conditions for large-scale change through establishing aims, priorities, measurement, resources, and testing and spreading new learning.


