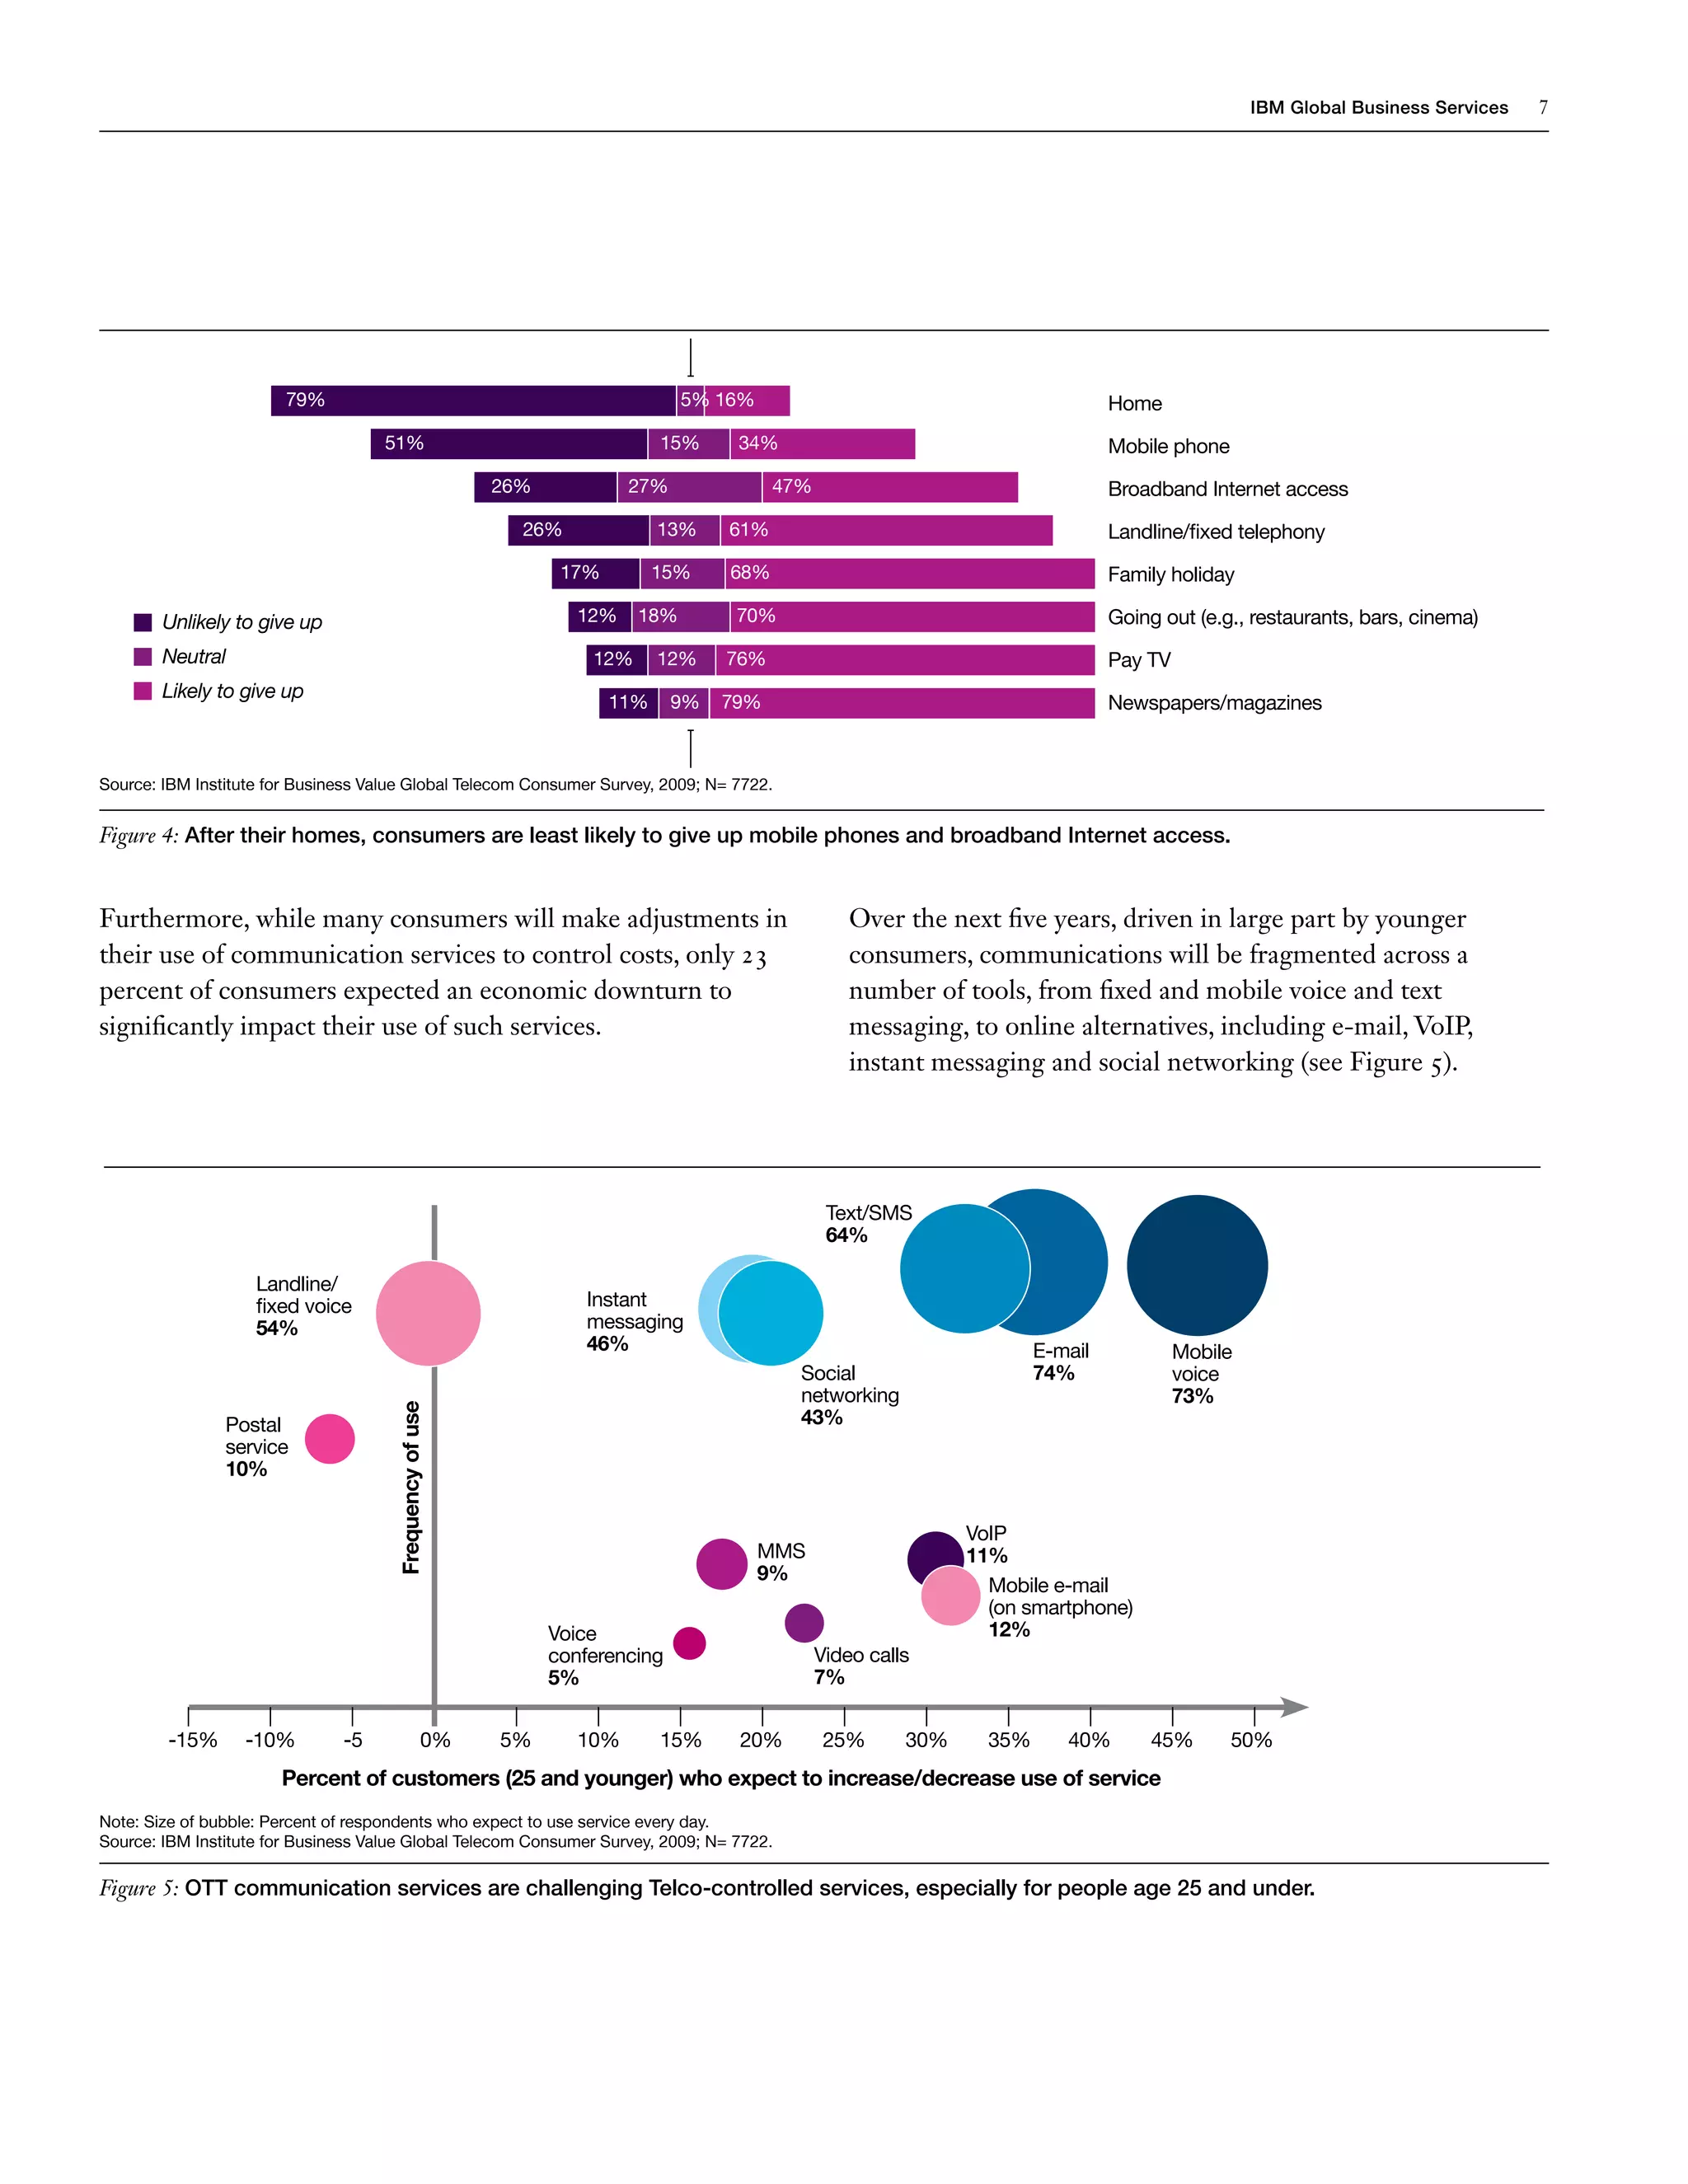
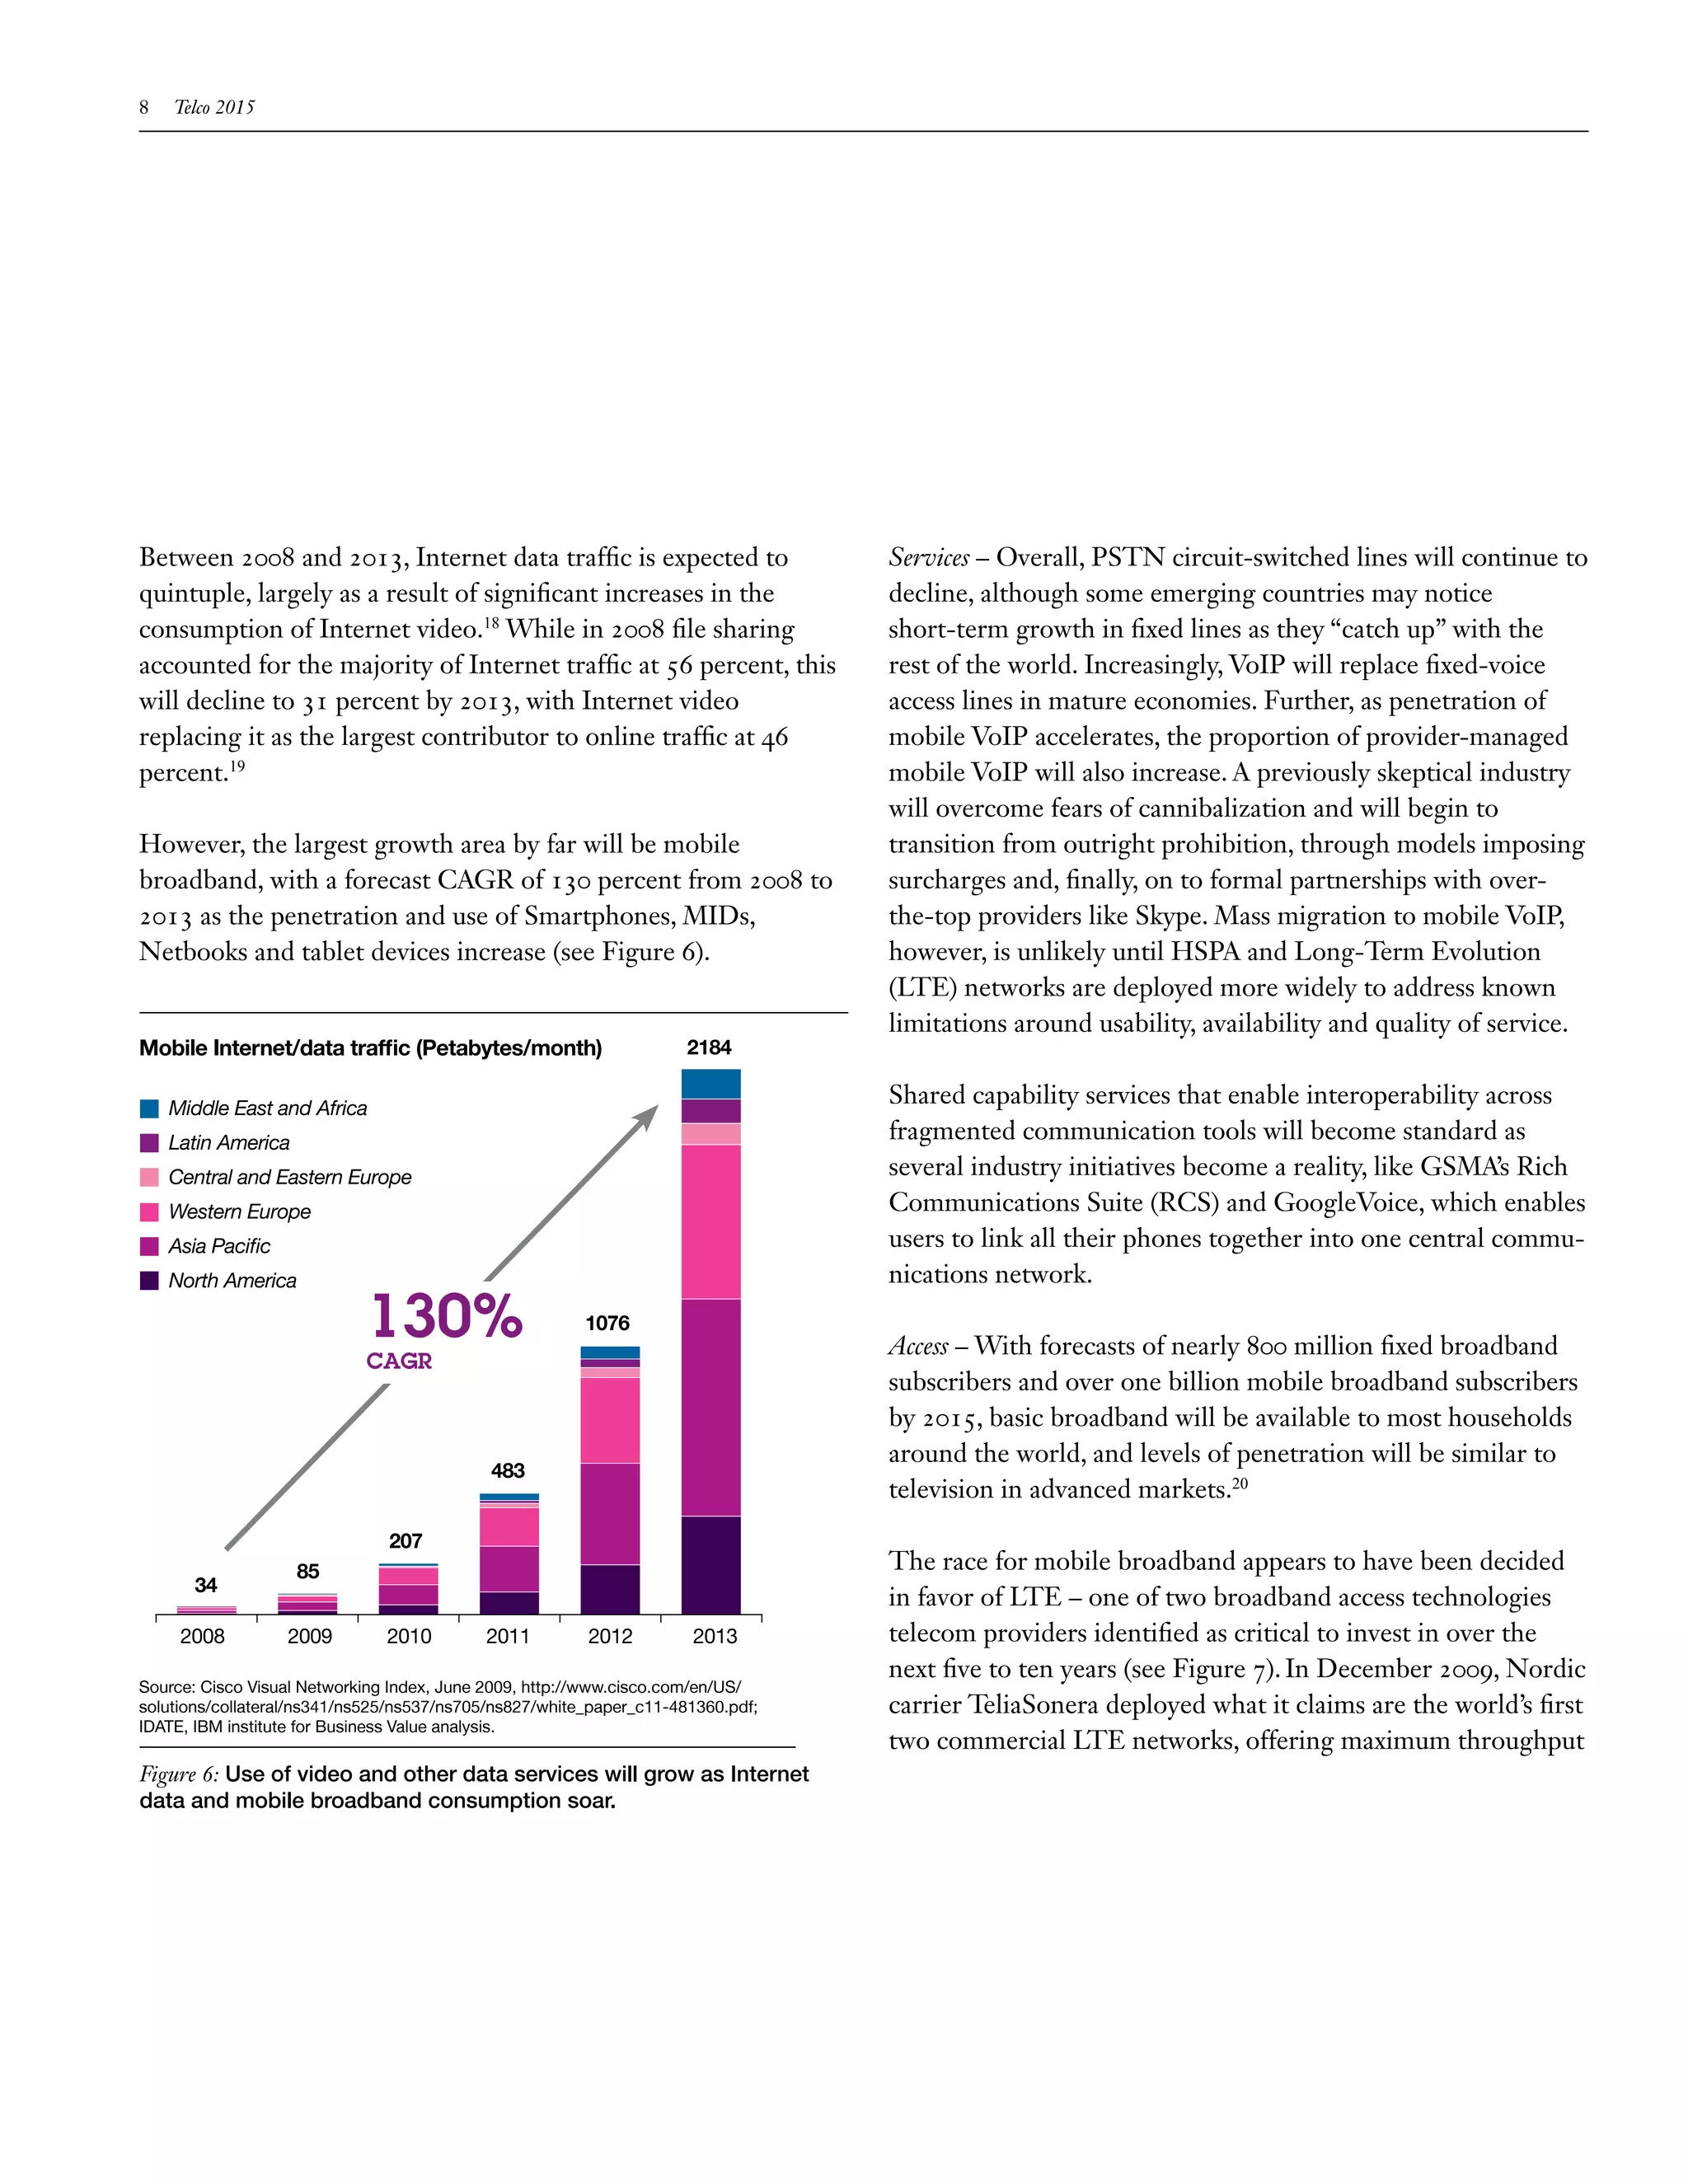
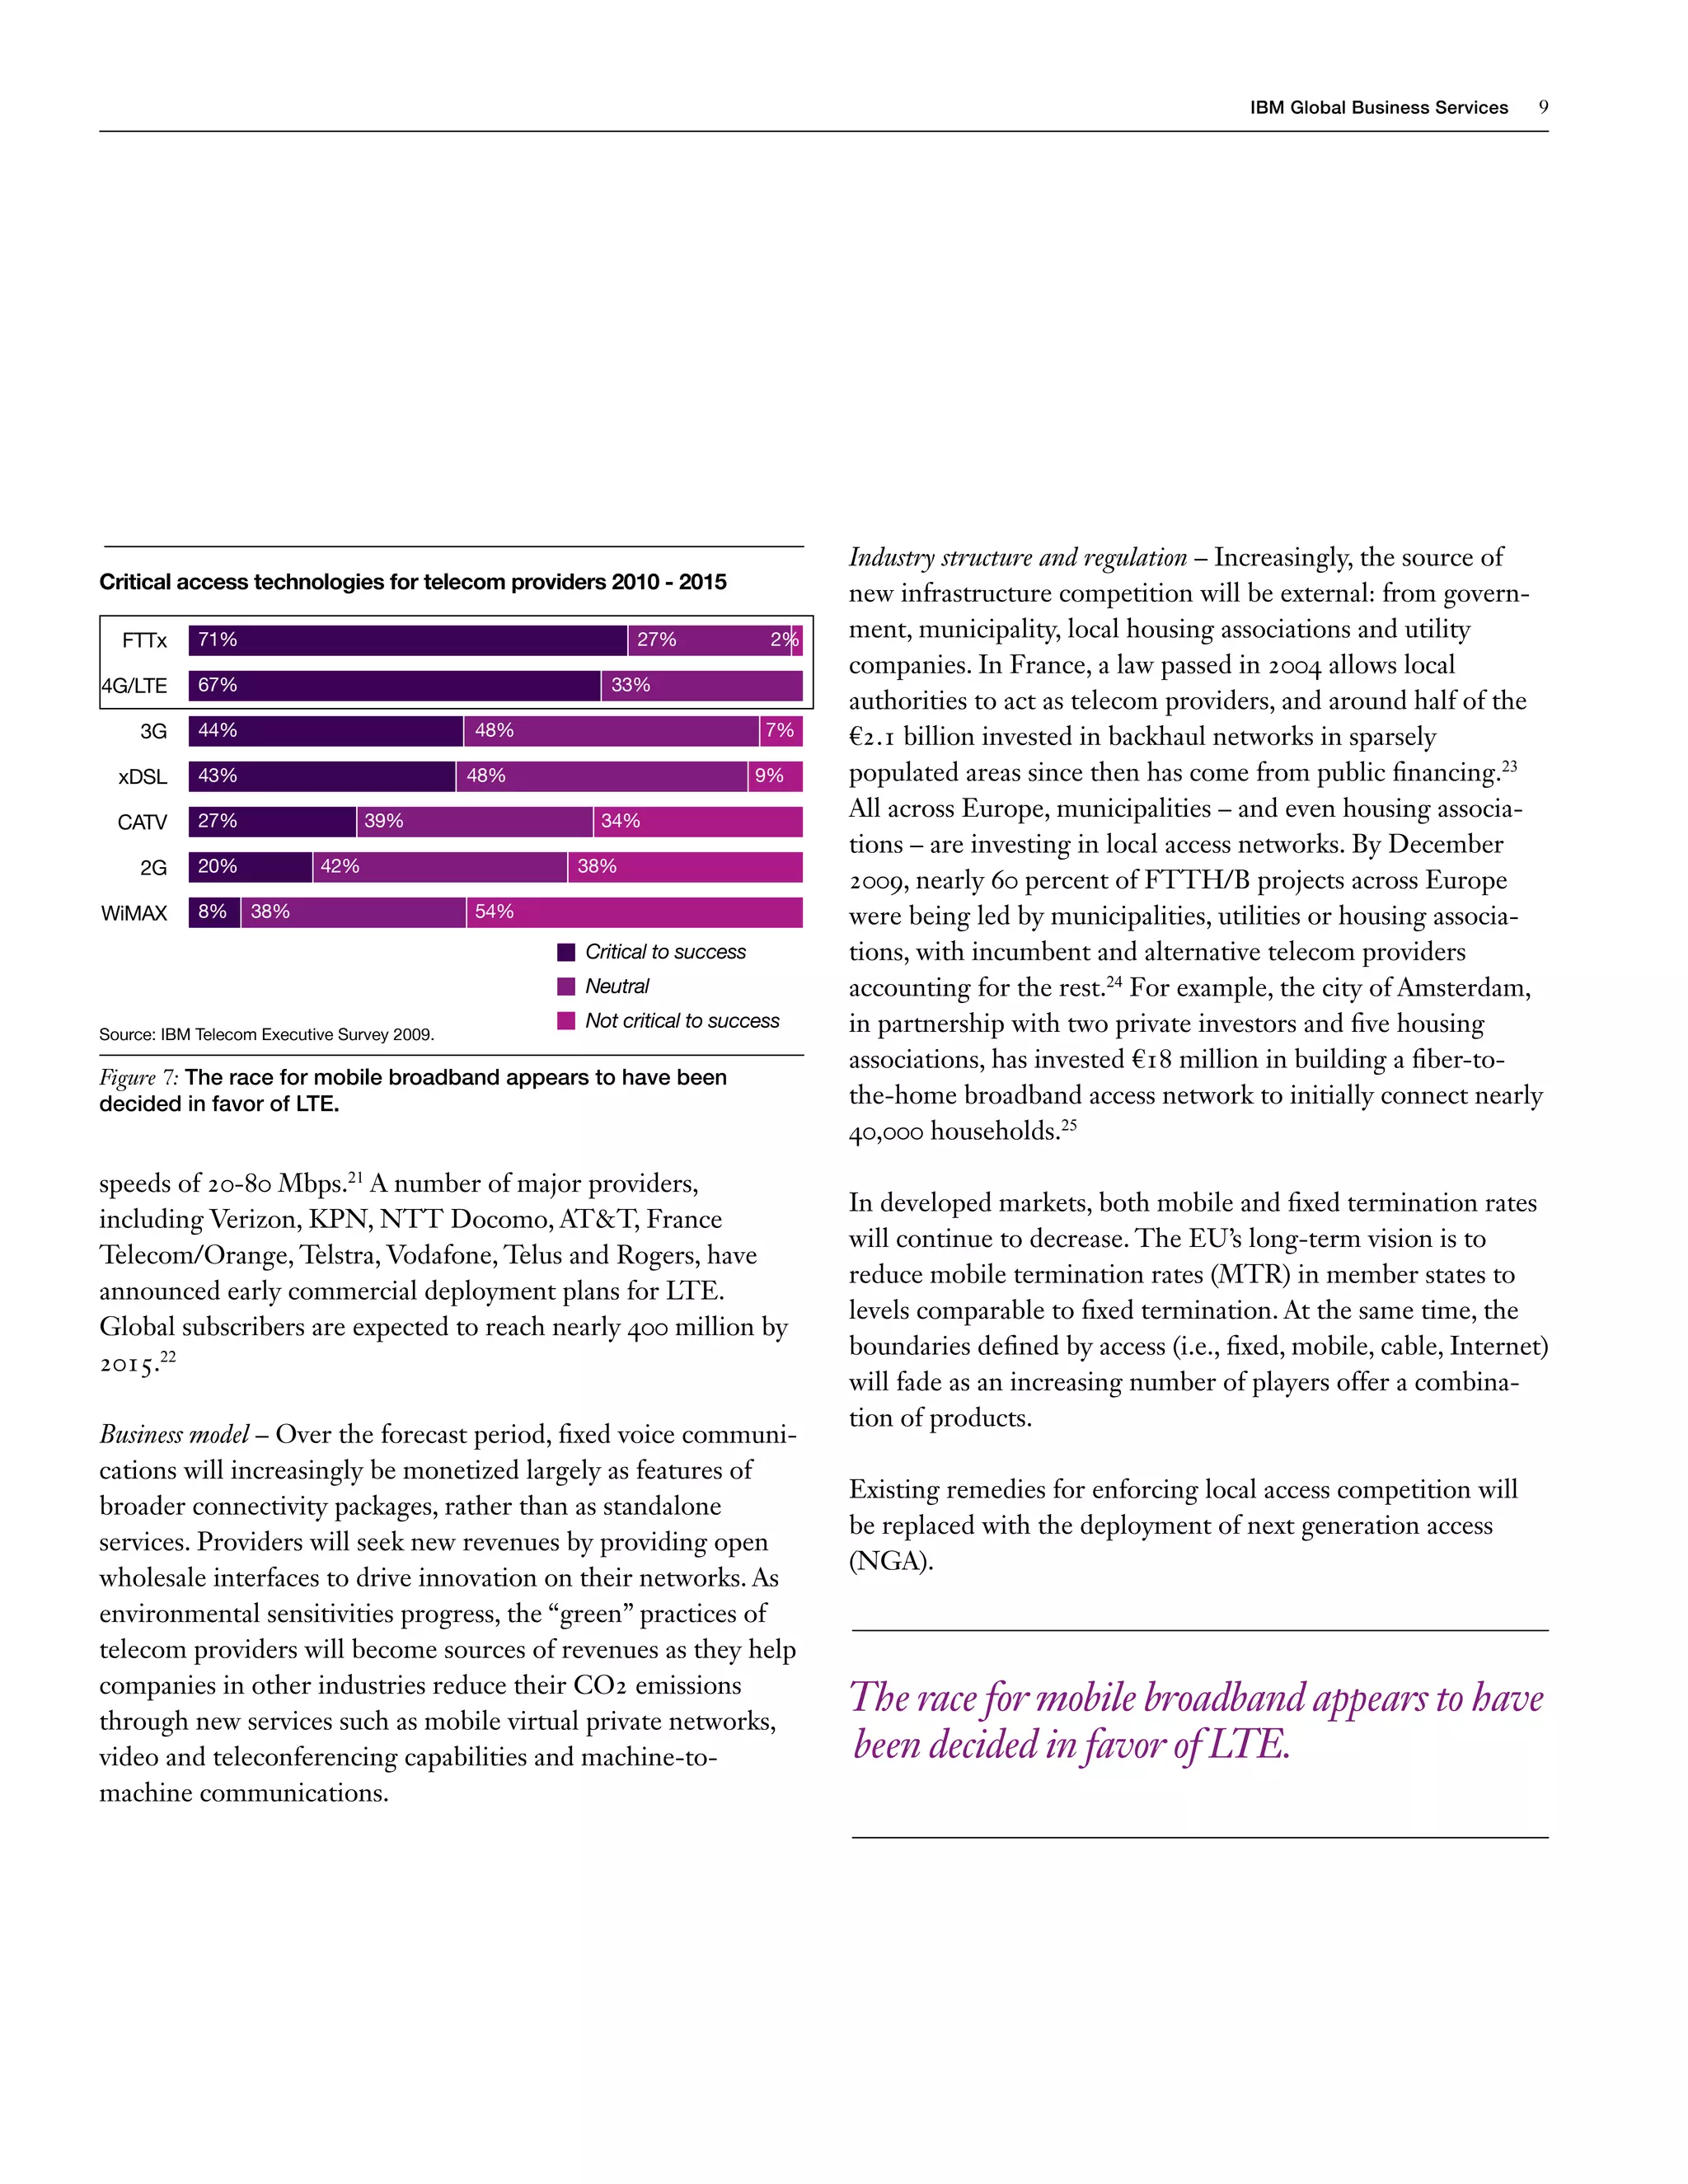
IBM Global Business Services                Telecommunications
Executive Report


IBM Institute for Business Value


Telco 2015
Five telling years, four future scenarios
IBM Institute for Business Value
IBM Global Business Services, through the IBM Institute for Business Value, develops
fact-based strategic insights for senior executives around critical public and private
sector issues. This executive report is based on an in-depth study by the Institute’s
research team. It is part of an ongoing commitment by IBM Global Business Services to
provide analysis and viewpoints that help companies realize business value. You may
contact the authors or send an e-mail to iibv@us.ibm.com for more information.
Additional studies from the IBM Institute for Business Value can be found at
ibm.com/iibv
Introduction


By Ekow Nelson and Rob van den Dam


Despite the run-up in mobile revenues over the last few years,
communications revenue growth is beginning to falter as voice markets in developing
countries saturate. While the global digital renaissance has yielded pockets of success and
opportunity for telecom providers, content and connectivity revenues have not offset the
declines. How will the industry evolve over the next five years? Will provider strategies be
proactive or protective? Our research suggests four plausible scenarios and the events that
would signal their unfolding. More important, we outline the characteristics of companies
most likely to succeed in each of these possible futures.


The telecommunications industry has experienced more              IBM research suggests that the outcomes for several important
change in the last decade than in its entire history. In 1999,    industry trends are highly predictable.1 Conversely, we have
only 15 percent of the world’s population had access to a         identified 13 significant variables from a larger pool of
telephone; by 2009, nearly 70 percent had mobile phones. In       unknowns that will also have significant impact on the industry.
addition to this phenomenal growth in mobile communica-           The outcomes of the 13 variables are far from certain and fall
tions, the past decade also brought steep declines in public      into two main categories: potential areas of growth and the
switched telephone network (PSTN) voice revenues, an              competitive structure of the industry. Mapping the extremes of
explosion of over-the-top (OTT) communication services and        the possible outcomes related to these uncertainties reveals
global industry consolidation (see page 27 for a glossary of      four contrasting scenarios depicting what the industry could
common telecommunications terms and abbreviations). There         look like five years from now.
were even ground-breaking decisions by some Telcos to
outsource functions as core to their business as their physical   Four future scenarios
networks.                                                         Survivor Consolidation: Reduced consumer spending leads to
                                                                  revenue stagnation or decline. Service providers in developed
Fueled by rapid growth in developing countries, mobile            markets have not significantly changed their voice communica-
communications have propped up the industry’s top line. But       tions/closed-connectivity service portfolio and have not
now with these markets saturating, communications revenue         expanded horizontally or into new verticals. Investors’ loss of
growth is stalling. Expected content and connectivity-related     confidence in the sector produces a cash crisis and elicits
revenues have not risen quickly enough to compensate.             industry consolidation.
Although increases in mobile Internet usage offer a glimmer of
hope – along with a host of operational challenges – the
telecom industry faces some serious questions: Where will
future growth come from? How will the industry evolve?
2   Telco 2015


Market Shakeout: Under a prolonged economic downturn or                Our modeling of the four scenarios suggests Generative Bazaar
a weak and inconsistent recovery, investors force providers to         as the most attractive outcome in terms of revenue, profit-
disaggregate assets into separate businesses with different            ability and cash flow projections, followed by Clash of Giants.
return profiles. Retail brands emerge to collect and package           Survivor Consolidation and Market Shakeout are clearly less
services from disaggregated units. The market is further               attractive scenarios, both of which imply a contracting and
fragmented by government, municipality and alternative                 challenged industry. If the current growth model, based on an
providers (e.g., local housing associations or utilities) that         ever-expanding customer base, persists, the industry is likely to
extend ultra-fast broadband to gray areas, while private               experience flat or declining revenues. In such a case, Survivor
infrastructure investments are limited to densely populated            Consolidation or Market Shakeout would be the most
areas. Service providers look for growth through horizontal            plausible outcomes.
expansion and premium connectivity services sold to applica-
tion and content providers, as well as businesses and                  To return to strong growth, the telecom industry needs to act
consumers.                                                             collectively to create the conditions necessary for the more
                                                                       dynamic and profitable scenarios of Clash of Giants or
Clash of Giants: Providers consolidate, cooperate and create           Generative Bazaar. They can begin to accomplish this through
alliances to compete with OTT players and device/network               greater global industry cooperation on common capabilities
manufacturers that are extending their communication                   and platforms to improve competitiveness with global OTT
footprints. Mega-carriers expand their markets through                 providers. The role of service providers can be enhanced in
selective verticals (e.g., smart electricity grids and e-health) for   adjacent vertical markets, enabling new business models in
which they provide packaged end-to-end connectivity                    health, smart grids, transport, retail, banking and more.
solutions. Telcos develop a portfolio of premium network               Further growth can be achieved through pervasive, open
services and better-integrated digital content capabilities to         connectivity for any person, object and a multitude of
deliver new experiences.                                               connected devices by stimulating third-party innovation and
                                                                       leveraging customer and network insights to deliver new
Generative Bazaar: Barriers between OTT and network                    experiences that help to accelerate the evolving digital
providers blur as regulation, technology and competition drive         economy.
open access. Infrastructure providers integrate horizontally to
form a limited number of network co-operatives that provide
pervasive, affordable and unrestricted open connectivity to any
person, device or object, including a rapidly expanding class of
                                                                       As growth and revenues from traditional
innovative, asset-light service providers.
                                                                       services stall and data and content struggle to
                                                                       compensate for declines, the industry faces a
                                                                       range of uncertainties and must prepare for a
                                                                       number of alternative scenarios.
IBM Global Business Services   3


More change in the last 10 years than the                                                        During the same period, fixed telephony (PSTN) lines
previous 100                                                                                     and voice revenues continued their long-term decline in
The way in which the world communicates has changed more                                         advanced markets where the volume of mobile
in the last decade than in all previous history. In this section,                                telephony voice minutes increased at the expense of
we explore the following critical changes and challenges:                                        fixed telephony. In 2008, for example, outgoing fixed
                                                                                                 voice traffic in the EU-5 markets – France, Germany,
•	   The mobile migration                                                                        Italy, Spain and the United Kingdom – amounted to
•	   The changing face of communication                                                          560 billion minutes or 53 percent of total minutes of
•	   The challenge to monetize content                                                           use (MOU), down from 645 billion minutes and 72
•	   The decoupling of traffic and revenue                                                       percent MOU in 2003.3 In 2010, mobile is expected for
•	   The flight from the network.                                                                the first time to carry more outgoing voice traffic than
                                                                                                 fixed telephony.4
The mobile migration
In 1999, more than a century after its invention, less than one                                  After a decade of meteoric increases, global mobile
in six people in the world had access to a telephone of any kind.                                growth has begun to stall. In 2008, revenue growth fell
By 2009, mobile telephony was accessible for seven out of ten                                    below double-digits for the first time.5 In some
people worldwide (see Figure 1).2                                                                advanced countries, overall mobile revenues are
                                                                                                 expected to decline for the first time during 2009-2010.6
                                                                                                 Average revenue per user (ARPU) has actually been
per 100
                                                                                                 declining for some time. For example, ARPU for Italian
inhabitants                                                                                      telecommuniations companies declined from almost
     80               Mobile cellular telephone subscriptions                                    €30 per month in 2004 to just over €20 per month in
     70
                      Internet users                                                             2008.7
                      Fixed telephone lines
     60               Fixed broadband subscribers
                                                                                                 Over the decade, emerging markets demonstrated their
     50                                                                                          ability to make profits from low ARPU users, as
                                                                                                 telephony was for the first time extended to many new
     40
                                                                                                 consumers. In 2008, average EBITDA (earnings before
     30                                                                                          interest tax, depreciation and amortization) levels for
     20                                                                                          the mobile telecom industry in South Asia ranged from
                                                                                                 45-65 percent, with ARPU levels below US$5.8 This
     10
                                                                                                 was driven, in part, by significant increases in MOU and
      0                                                                                          innovative cost-management models. From Q2 2008 to
          ‘99   ‘00      ‘01    ‘02     ‘03     ‘04     ‘05      ‘06    ‘07      ‘08     ‘09
                                                                                                 Q4 2009, for example, Bharti Airtel roughly doubled
Source: International Telecommunications Union (ITU) ICT Statistics Database, http://www.itu.
                                                                                                 the total volume of traffic on its network, from over 64
int/ITU-D/icteye/Indicators/Indicators.aspx. (2009 figures are estimated); “The world in 2009:
ICT Facts and Figures,” ITU Geneva 2009, http://www.itu.int/ITU-D/ict/material/Telecom09_
                                                                                                 billion minutes per quarter to 130 billion minutes.9
flyer.pdf


Figure 1: Mobile cellular telephony has exhibited strong growth over
the past decade.
4   Telco 2015


Emerging market expansion has also begun to falter. From          revenues, 1 percent of fixed telecom revenues and 1.5 percent
2005-2009, revenue growth from telecom services declined 14       of broadband revenues. Our most optimistic view forecasts
percent in the Middle East and Africa, 11 percent in Latin        IPTV revenues at US$17 billion and 6 percent of the pay-
America, 8 percent in Brazil, Russia, India and China (BRIC), 4   television market in 2012.
percent in North America and 1 percent in Europe (excluding
Russia).10                                                        In emerging markets, adoption of mobile messaging-based
                                                                  applications that leverage two-way/premium SMS is growing,
The changing face of communication                                as well as Unstructured Supplementary Service Data (USSD),
Over the past decade, Internet access and connectivity shifted    to deliver public information and advisory services to rural
from dial-up to broadband. Higher data speeds through Digital     communities. These applications also allow mobile payments
Subscriber Line (DSL), cable modem and fiber access tech-         and money transfer services. They can also provide basic
nologies enable users to communicate in more innovative ways.     banking services in countries where such services are relatively
Today, communications are fragmented across online services       under-developed or unavailable.
(VoIP, peer-to-peer, social networking, e-mail, instant
messaging, blogs, forums, wikis and more) and telecom services    The decoupling of traffic and revenue
(fixed and mobile voice, SMS, MMS). While non-traditional         One of the brightest spots in the industry toward the end of
communication services in advanced markets have grown             the decade was the phenomenal growth of mobile broadband,
overall, outgoing call minutes from traditional telecoms have     facilitated by the rollout of High Speed Packet Access (HSPA)
remained relatively flat. In France, for example, the volume of   networks. This growth helped mitigate declines in overall
call minutes across fixed and mobile will increase by only 9      revenues in 2009, particularly in Europe and North America.
percent from 2005 to 2010 – from nearly 190 billion minutes       Driven in part by the increased penetration of smartphone
to 207 billion. However, OTT communications over the same         devices like the 3G Apple iPhone, High Speed Downlink
period, including VoIP, peer-to-peer and instant messaging,       Packet Access (HSDPA)-enabled USB keys or dongles for
will increase by 211 percent, from 303 billion to 942 billion     laptops/Netbooks, and other mobile Internet devices (MIDs),
minutes.11 A challenge for the industry is to devise a way to     mobile broadband growth is paving the way for a second wave
better monetize this massive growth in over-the top services.     of fixed-mobile substitution, but this time in data connectivity
                                                                  services.
The challenge to monetize content
Revenues from digital content services, such as Internet
Protocol TV (IPTV) and mobile content (mobile video, mobile
music, wireless games and mobile advertising) have not yet        Much of the growth in overall communication
compensated for the decline in traditional services. Our
analysis shows that IPTV generated close to US$4 billion in
                                                                  volumes has come from OTT innovations, but
2008 revenues, representing only 0.5 percent of total mobile      providers are struggling to monetize these
                                                                  using traditional models.
IBM Global Business Services           5


Aggressive pricing and attractive packages, including “all-you-                                                                              Traffic
can-eat” bundles and simple pre-pay (or pay-as-you-go)                                                                                       Network cost
                                                                                                                                             (existing technologies)
options – generally unavailable with fixed broadband – have
                                                                    Traffic                                                                  Revenues
helped accelerate consumer adoption and increase mobile             volume/                                                                  Network cost
broadband traffic.                                                  revenue                                                                  (future technologies)
                                                                                  Voice dominant
                                                                                                                                        Revenue and
                                                                                                                                        traffic decoupled
The dramatic increase in application stores, following the
success of Apple’s App Store, has reinvigorated the market for
mobile applications. Just 18 months after its launch in July
2008, the number of App Store applications had surpassed
                                                                                                                                        Profitability
100,000 – with more than 3 billion downloads.12 At an average
price per application of around US$2.50, the App Store model                                               Data dominant
is far from a significant source of revenue. But it is a powerful                                                                            Time
complement to drive Apple’s hardware revenues.13                    Source: Nokia-Siemens; IBM Institute for Business Value analysis.


Overall, global mobile data traffic has more than doubled since     Figure 2: Revenue and traffic are disassociated in an increasingly
2008.14 With future growth forecast at 130 percent year-to-         data-dominant world.
year, capacity on current 3G networks is likely to be exhausted
by 2013, increasing pressure on providers for additional            The flight from the network
investment in radio access and backhaul networks.                   As part of the effort to reduce capital costs, many telecom
                                                                    providers are turning to network outsourcing and infrastruc-
Furthermore, with flat tariffs, costs no longer match revenues      ture sharing, which are becoming mainstream even among
for delivering an ever-increasing amount of data over a             Tier-1 providers such as Vodafone. In early 2009, Vodafone
network designed to support narrowband voice and light-             UK signed a seven-year agreement for Ericsson to take over
weight download, Web browsing and e-mail. Essentially,              the maintenance and operational support of its second- and
revenue and traffic volumes are disconnected as telecom             third-generation radio access networks.15 France Telecom
becomes more data/connectivity-centric. While the boom in           Orange has outsourced the management of its networks in the
demand for mobile broadband is welcome for an industry              United Kingdom and Spain to Nokia Siemens Networks.16
looking for new sources of growth, based on the current             Indeed the number of outsourcing deals in the industry rose
revenue model of “all-you-can-eat” data plans, it is unsustain-     from six in 2004 to nearly 90 in 2008.17
able long-term. Historically, traffic and revenue tracked along
the same path. In the past ten years, however, they have            After the unprecedented change that has swept through and
diverged. The disassociation of these two is at the heart of the    across the telecommunications industry in recent years, what
Telco revenue model challenge (see Figure 2).                       evolution will transpire over the next five years?
6    Telco 2015


Scenario envisioning for                                                                    Forces driving telecommunications through 2015
telecommunications                                                                          There are a number of forces and underlying trends in the
Traditional approaches to predicting the future based on                                    evolution of the communications industry for which there is a
prefabricated world visions of economic and geopolitical trends                             high degree of consensus about their certainty (see Figure 3).
are unsuitable for an industry changing as quickly as telecom-                              These provide a common backdrop for future scenario
munications, the evolution of which has taken many unprec-                                  envisioning. We’ve grouped these forces and trends into five
edented turns over the past decade. Given the ongoing                                       categories:
uncertainties, a scenario-envisioning approach – one that
enables industry executives to assess alternative contrasting                               1. Usage – changes to user consumption patterns
futures for the industry that are distinctly different from the                             2. Services – changes in services composition
present – is more appropriate. Our scenario envisioning                                     3. Access – device and network access technology evolution
consists of an analysis of the following:                                                   4. Business model – future revenue structure and sources
                                                                                            5. Industry structure and regulation – future of industry structure
•	   Forces driving telecommunications through 2015                                            and regulation.
•	   Critical (uncertain) variables – nascent technology, possible
     consumer responses to offerings not yet invented, potential                            Usage – Mobile and broadband have emerged as key staples,
     regulatory structure and possible competitive initiatives                              and consumers are unwilling to make drastic changes in their
•	   Scenario realization triggers – economic, technology,                                  use of communication and connectivity services, even in a time
     regulatory, market                                                                     of economic uncertainty. Asked what they are least likely to
•	   Scenario revenue and profitability outlooks.                                           give up if the economy worsened, after their homes, respon-
                                                                                            dents listed their mobile phones and broadband Internet
                                                                                            access. The items ranked considerably ahead of family holidays,
                                                                                            PayTV and going out (see Figure 4).


             • Ubiquitous, seamless open access becomes the norm
             • Communications fragmented across multiple tools                                                   • PSTN decline accelerates
                                                                               Usage                Services     • VOIP migration accelerates
             • Mobile and broadband are basic household staples
             • Increased use of data – both fixed and mobile.                                                    • Growth in shared communication capabilities.


• Commitment to net neutrality remains                                                    Forces                              • Basic broadband pervasive as TV
                                                                  Industry                                                    • Battle for mobile broadband favors LTE
• New local access competition rules with Next                                         shaping the
                                                               structure and                                      Access      • Proliferation in high-end devices (e.g.,
  Generation Access                                                                     future of
                                                                 regulation                                                     Smartphone, Netbook)
• New broadband infrastructure competition will                                          telecom
  emerge from industry (e.g., utilities, municipalities)                                                                      • Market for ultra-low-cost handsets grows.
• Fixed/mobile termination rates converge as
  barriers fade.


                                                                                                        • Revenue from environmental mitigation programs grow
                                                                                         Business
                                                                                                        • Share of revenues from third-party connectivity grows
                                                                                          model
                                                                                                        • Voice is monetized as a feature of connectivity.


Source: IBM Institute for Business Value and IDATE analysis.


Figure 3: A number of forces are shaping the future of the telecommunications industry.
IBM Global Business Services   7


                        79%                                                    5% 16%                                           Home
                                    51%                                     15%     34%                                         Mobile phone
                                                         26%            27%              47%                                    Broadband Internet access
                                                           26%              13%    61%                                          Landline/fixed telephony
                                                                17%         15%    68%                                          Family holiday

        Unlikely to give up                                       12%    18%        70%                                         Going out (e.g., restaurants, bars, cinema)
        Neutral                                                    12%      12%    76%                                          Pay TV
        Likely to give up
                                                                      11%     9%   79%                                          Newspapers/magazines


Source: IBM Institute for Business Value Global Telecom Consumer Survey, 2009; N= 7722.


Figure 4: After their homes, consumers are least likely to give up mobile phones and broadband Internet access.


Furthermore, while many consumers will make adjustments in                                         Over the next five years, driven in large part by younger
their use of communication services to control costs, only 23                                      consumers, communications will be fragmented across a
percent of consumers expected an economic downturn to                                              number of tools, from fixed and mobile voice and text
significantly impact their use of such services.                                                   messaging, to online alternatives, including e-mail, VoIP,
                                                                                                   instant messaging and social networking (see Figure 5).


                                                                                                Text/SMS
                                                                                                64%

                    Landline/
                    fixed voice                                    Instant
                    54%                                            messaging
                                                                   46%                                                 E-mail            Mobile
                                                                                           Social                      74%               voice
                                                                                           networking                                    73%
                                      Frequency of use


                Postal                                                                     43%
                service
                10%


                                                                                                               VoIP
                                                                                        MMS                    11%
                                                                                        9%
                                                                                                                 Mobile e-mail
                                                                                                                 (on smartphone)
                                                               Voice                                             12%
                                                               conferencing                    Video calls
                                                               5%                              7%


        -15%      -10%         -5                   0%   5%       10%       15%     20%         25%      30%     35%      40%       45%        50%
                       Percent of customers (25 and younger) who expect to increase/decrease use of service
Note: Size of bubble: Percent of respondents who expect to use service every day.
Source: IBM Institute for Business Value Global Telecom Consumer Survey, 2009; N= 7722.

Figure 5: OTT communication services are challenging Telco-controlled services, especially for people age 25 and under.
8   Telco 2015


Between 2008 and 2013, Internet data traffic is expected to                      Services – Overall, PSTN circuit-switched lines will continue to
quintuple, largely as a result of significant increases in the                   decline, although some emerging countries may notice
consumption of Internet video.18 While in 2008 file sharing                      short-term growth in fixed lines as they “catch up” with the
accounted for the majority of Internet traffic at 56 percent, this               rest of the world. Increasingly, VoIP will replace fixed-voice
will decline to 31 percent by 2013, with Internet video                          access lines in mature economies. Further, as penetration of
replacing it as the largest contributor to online traffic at 46                  mobile VoIP accelerates, the proportion of provider-managed
percent.19                                                                       mobile VoIP will also increase. A previously skeptical industry
                                                                                 will overcome fears of cannibalization and will begin to
However, the largest growth area by far will be mobile                           transition from outright prohibition, through models imposing
broadband, with a forecast CAGR of 130 percent from 2008 to                      surcharges and, finally, on to formal partnerships with over-
2013 as the penetration and use of Smartphones, MIDs,                            the-top providers like Skype. Mass migration to mobile VoIP,
Netbooks and tablet devices increase (see Figure 6).                             however, is unlikely until HSPA and Long-Term Evolution
                                                                                 (LTE) networks are deployed more widely to address known
                                                                                 limitations around usability, availability and quality of service.
Mobile Internet/data traffic (Petabytes/month)                       2184

    Middle East and Africa
                                                                                 Shared capability services that enable interoperability across
    Latin America
                                                                                 fragmented communication tools will become standard as
    Central and Eastern Europe                                                   several industry initiatives become a reality, like GSMA’s Rich
    Western Europe                                                               Communications Suite (RCS) and GoogleVoice, which enables
    Asia Pacific                                                                 users to link all their phones together into one central commu-
    North America                                                                nications network.

                            130%                        1076
                                                                                 Access – With forecasts of nearly 800 million fixed broadband
                            CAGR
                                                                                 subscribers and over one billion mobile broadband subscribers
                                                                                 by 2015, basic broadband will be available to most households
                                                                                 around the world, and levels of penetration will be similar to
                                            483
                                                                                 television in advanced markets.20
                               207
                    85                                                           The race for mobile broadband appears to have been decided
       34
                                                                                 in favor of LTE – one of two broadband access technologies
     2008          2009        2010        2011         2012         2013        telecom providers identified as critical to invest in over the
                                                                                 next five to ten years (see Figure 7). In December 2009, Nordic
Source: Cisco Visual Networking Index, June 2009, http://www.cisco.com/en/US/
solutions/collateral/ns341/ns525/ns537/ns705/ns827/white_paper_c11-481360.pdf;   carrier TeliaSonera deployed what it claims are the world’s first
IDATE, IBM institute for Business Value analysis.
                                                                                 two commercial LTE networks, offering maximum throughput
Figure 6: Use of video and other data services will grow as Internet
data and mobile broadband consumption soar.
IBM Global Business Services   9


                                                                               Industry structure and regulation – Increasingly, the source of
Critical access technologies for telecom providers 2010 - 2015
                                                                               new infrastructure competition will be external: from govern-
  FTTx      71%                                          27%              2%   ment, municipality, local housing associations and utility
                                                                               companies. In France, a law passed in 2004 allows local
4G/LTE      67%                                       33%
                                                                               authorities to act as telecom providers, and around half of the
     3G     44%                              48%                         7%    €2.1 billion invested in backhaul networks in sparsely
  xDSL      43%                              48%                         9%    populated areas since then has come from public financing.23
  CATV      27%                  39%                34%
                                                                               All across Europe, municipalities – and even housing associa-
                                                                               tions – are investing in local access networks. By December
     2G     20%            42%                     38%
                                                                               2009, nearly 60 percent of FTTH/B projects across Europe
WiMAX       8%    38%                        54%
                                                   11%    9%    23%            were being led by municipalities, utilities or housing associa-
                                                   Critical to success         tions, with incumbent and alternative telecom providers
                                                   Neutral                     accounting for the rest.24 For example, the city of Amsterdam,
Source: IBM Telecom Executive Survey 2009.
                                                   Not critical to success     in partnership with two private investors and five housing
                                                                               associations, has invested €18 million in building a fiber-to-
Figure 7: The race for mobile broadband appears to have been
decided in favor of LTE.                                                       the-home broadband access network to initially connect nearly
                                                                               40,000 households.25

speeds of 20-80 Mbps.21 A number of major providers,
                                                                               In developed markets, both mobile and fixed termination rates
including Verizon, KPN, NTT Docomo, AT&T, France
                                                                               will continue to decrease. The EU’s long-term vision is to
Telecom/Orange, Telstra, Vodafone, Telus and Rogers, have
                                                                               reduce mobile termination rates (MTR) in member states to
announced early commercial deployment plans for LTE.
                                                                               levels comparable to fixed termination. At the same time, the
Global subscribers are expected to reach nearly 400 million by
                                                                               boundaries defined by access (i.e., fixed, mobile, cable, Internet)
2015.22
                                                                               will fade as an increasing number of players offer a combina-
                                                                               tion of products.
Business model – Over the forecast period, fixed voice communi-
cations will increasingly be monetized largely as features of
                                                                               Existing remedies for enforcing local access competition will
broader connectivity packages, rather than as standalone
                                                                               be replaced with the deployment of next generation access
services. Providers will seek new revenues by providing open
                                                                               (NGA).
wholesale interfaces to drive innovation on their networks. As
environmental sensitivities progress, the “green” practices of
telecom providers will become sources of revenues as they help
companies in other industries reduce their CO2 emissions
through new services such as mobile virtual private networks,
                                                                               The race for mobile broadband appears to have
video and teleconferencing capabilities and machine-to-                        been decided in favor of LTE.
machine communications.
10    Telco 2015


Critical (uncertain) variables                                            •	   Premium connectivity: What is the opportunity for premium
In addition to the trends we’ve outlined, a number of poten-                   connectivity features (e.g., guaranteed low latency, security, or
tially high-impact variables exist with outcomes that are, as yet,             a more robust content delivery network)? Will increased
uncertain. From these, we have selected 13 whose contrasting                   available bandwidth to third-party solution providers reduce
outcomes signal distinctly different scenarios for the future.                 the need for premium features?
These variables are placed in context with the industry trends
previously described:                                                     Access
                                                                          •	   Ultra-fast broadband availability: Deployment of ultra-fast
Usage:                                                                         broadband networks requires high levels of investment.
•	   The future of voice: Will voice communication volumes                     Taking into account their commercial viability and the
     continue to decline, substituted by asynchronous and/or                   regulatory environment, how much coverage can be
     online data communications (e.g., SMS, social networking,                 effectively achieved over the next five to ten years?
     instant messaging, IP voice), or will drastic price cuts, superior   •	   Open versus closed devices: Will providers continue to subsidize
     convenience, and new voice usage applications (e.g., human-               handsets, or will unlocked and open devices prevail? Will a
     to-machine voice communications, high-definition voice)                   standard open device platform emerge, or will the industry
     trigger a voice “rebirth?”                                                continue to support competing device platforms, including
•	   OTT versus network-optimized content: How will the battle be              Apple, Symbian, Google Android, Windows and Palm OS.
     waged with over-the-top providers? Can telecom providers
     deliver and monetize unrivalled user experiences through             Business model
     network-optimized features (e.g., multi-sensorial, 3-D,              •	   User-funded versus third-party funded: Will user-funded
     immersive reality) to derive value alongside over-the-top                 (subscription) revenues continue to dominate, or will Telco be
     (OTT) providers?                                                          able to gain significant revenues from third parties, such as
•	   Siloed versus unified communications: Will consumers finally              advertisers, in a two-sided business model? Can providers
     make the leap to embrace unified communications across                    adequately and legally monetize subscriber information (e.g.,
     fixed, mobile and online, or will shared capabilities across              socio-demographic, presence, preferences)?
     stand-alone fragmented communication tools be a sufficient           •	   Service pricing models – voice and connectivity: What will be the
     trade-off between simplicity and freedom of choice?                       predominant service pricing models? Single-service metered?
                                                                               Monolithic bundles structured for key subscriber segments?
Services                                                                       Abundant (all-you-can-eat) pricing for connectivity and voice?
•	   New verticals: What is the opportunity for telecom in industry            Differentiated tiered pricing based on quality/speed? Will
     verticals such as healthcare, smart grids and financial services          providers be able to generate premium prices for ultra-fast
     beyond basic connectivity? What form is this likely to take,              broadband (FTTH and LTE) compared to current broadband
     and can Telcos beneficially enhance the vision of an                      services?
     increasingly instrumented, interconnected and intelligent
     world to create value?
IBM Global Business Services   11


•	   Machine-to-machine (M2M): Will provider revenues continue         Four industry scenarios for Telco 2015
     to be based primarily on maintaining high ARPU across a           These variables can be grouped into two industry dimensions
     finite number of accesses, or on ramping up M2M services          – addressable market growth and competition/integration
     based on an infinite number of connected objects?                 structure – as shown in Figure 8.

Industry structure and regulation                                      Addressable market growth: This covers all the variables related
•	   ServCo/NetCo versus vertical integration: Will the industry be    to future sources of revenue growth. Will there be a rebirth of
     organized by separate service companies and network               the blockbuster revenue generator of voice, or is this destined
     companies, or will vertically integrated providers prove to be    to be replaced by content, broadband connectivity and new
     the only viable model to generate sufficient shareholder value?   service areas in selected industry verticals? Will communica-
•	   Network sharing versus outsourcing: Will passive infrastructure   tions fragmentation dissipate value, or create new opportuni-
     sharing become the norm? Will providers go beyond passive         ties with increased demand for shared capabilities?
     infrastructure sharing and share the active network, too? Will
     network outsourcing become the norm?
•	   Regulation: What will be regulators’ goals over the next
     five-to-ten years, and how will they impact the industry’s                                                                       Competition/
                                                                                                                                      integration
     business models? After two decades of liberalization of              Addressable                                                 structure
     telecom markets around the world, is competition self-               market growth                                               Open versus
     sustaining, making ex-ante provisions dispensable? Or will new                                                                   closed devices
                                                                           The future of
     networks, market consolidation and new business models                voice
                                                                                                            Premium                   Network sharing
     require the (re-)introduction of a number of ex-ante remedies.
                                                                                                            connectivity              versus
     What is the future of net neutrality? The industry appears            Silo versus                                                outsourcing
                                                                           unified
     divided over its long-term future. Nearly half of our                 communications                   Service pricing           Vertical versus
     respondents expect regulators to sustain the commitment to                                             model                     horizontal
                                                                           OTT versus                                                 integration
     neutrality over the next five-to-ten years. But over 40 percent       network-
     anticipate the commitment will be abandoned or relaxed to             optimized content                Machine-to-               User versus
                                                                                                            machine (M2M)             third-party/
     stimulate investment that improves customer experience/               Expansion into                   communications            ad-funded
     quality of service.26                                                 adjacent
                                                                           verticals                                                  Regulation
                                                                           Ultra-fast
                                                                           broadband
                                                                           availability


                                                                       Source: IBM Institute for Business Value and IDATE analysis.


                                                                       Figure 8: Variables that may shape the future of telecommunications
                                                                       can be grouped within two industry dimensions.
12                           Telco 2015


Competition/integration structure encompasses uncertainties                                                                    The interplay between the dimensions of addressable market
around industry integration and open versus closed connec-                                                                     growth and competition/integration structure produces four
tivity models. As regulatory change and technology develop-                                                                    equally likely but contrasting future scenarios (see Figure 9).
ments lower entry barriers for new entrants to deliver innova-
tive services, will the service structure be based predominantly                                                               It is important to note that these scenarios are potential
on packaged end-to-end delivery or open access platforms with                                                                  outcomes for markets at national or regional levels and not a
multiple service providers? Will the vertically integrated model                                                               set of strategic choices to be made by individual telecom
survive as providers increasingly share infrastructure and                                                                     providers. The purpose of the scenario-envisioning process is
outsource significant parts of their business, including                                                                       not to rank the probability of individual scenarios or attempt to
networks, to external providers? Will demand for new service                                                                   make predictions, but to provide a framework to enable
combinations impel infrastructure providers to open up their                                                                   executives to assess what it would be like to operate in each
networks and enable third-party providers to leverage capabili-                                                                potential scenario and to build capabilities for success for
ties to deliver new experiences? Is the fragmentation of the                                                                   whichever scenario prevails over the next five to ten years.
industry – with independent national and regional providers –
sustainable when the main competitive threats are expected to                                                                  Table 1 (see page 14) describes contrasting outcomes for
be from global over-the-top communications providers?                                                                          uncertain variables and sets out plausible consumer behaviors
How will future regulation impact industry structure and                                                                       and industry/market dynamics for each scenario.
competition?
                             Expanding


                                                   Clash of Giants                                                               Generative Bazaar
 Addressable market growth


                                                   Results from carrier cooperation and alliances (such as RCS) that pave        Pervasive, affordable, open connectivity is enabled for a person,
                                                   the way for global consolidation in response to increased competitive         device or object, unleashing a wave of generative innovation. A
                                                   threats from over-the-top providers. Mega carriers expand markets             co-operative of horizontally integrated network infrastructure providers
                                                   through selected verticals such as smart grid and e-health for which          (Net Co-op) emerges, based on catering to the needs of a multitude of
                                                   they provide packaged end-to-end solutions.                                   asset-light service providers that package connectivity with completely
                                                                                                                                 new services and revenue models.


                                                   Survivor Consolidation                                                        Market Shakeout
                             Declining/stagnant


                                                   Occurs as a result of reduced consumer spending, leading to revenue           Likely when CSPs expand horizontally in search of growth through
                                                   stagnation or decline. Investor loss of confidence in the telecoms sector     premium connectivity services sold to application and content providers,
                                                   produces a cash crisis and triggers survival consolidation.                   and device OEMs. The vertical integration model is disaggregated and
                                                                                                                                 the industry fragments as governments, municipalities, etc., expand
                                                                                                                                 ultra-fast broadband to under-invested areas.


                                                  Concentrated/vertical                                   Competition/integration structure                                          Fragmented/horizontal

Source: IBM Institute for Business Value analysis.


Figure 9: Four contrasting scenarios are possible, depending upon the interplay of trends and variables.
IBM Global Business Services   13


Scenario realization triggers – economic, technology,
regulatory, market
Each of the four scenarios described is triggered by a distinct    Each scenario is triggered by a combination of
combination of factors across several dimensions: economic/        factors across several dimensions.
financial, technological/investment, regulatory/competition
and marketplace/customer-related.

Survivor Consolidation is likely to be triggered by a prolonged
global or local economic downturn that causes consumers to         Clash of Giants is triggered by the determination of telecom
cut back spending, leading to intense price competition.           providers to take on Internet communication providers,
Constrained access to and high cost of capital leads to reduced    identified by 76 percent of telecom executives as the greatest
investment.                                                        competitive threat to their businesses over the next five to ten
                                                                   years – well ahead of traditional cable and content providers. In
Alternatively, a prolonged economic downturn may invoke a          an industry essentially fragmented by geography and national
different response from telecom providers, investors and           regulations, the ability of Telcos to engage global OTT
governments that leads to a different outcome – the Market         providers that are relatively unencumbered in their reach will
Shakeout. Private equity investors may acquire ailing telecom      require global alliances, cooperation and standardization of the
providers and break them up. A shakeout may also be triggered      kind the GSMA is leading for rich communication services
by increased fragmentation resulting from greater involvement      (RCS), the OneAPI global applications platform and Voice
and investment by governments, municipalities and infrastruc-      over LTE (VoLTE), among others.
ture players like utilities.
                                                                   The GSMA’s RCS initiative, for example, will enable
Smaller or emerging providers may be compelled by circum-          subscribers of telecom providers to exchange rich multimedia,
stances to outsource more of their networks, and the industry      such as video and photos, during a call, and will facilitate
may end up with the majority of its network infrastructure run     shared capabilities, including a common personal address book
by equipment suppliers. Telecom providers may further              augmented with real-time presence across providers, devices
outsource other assets, including their business process support   and networks.27
infrastructure, and divest others, like their retail store
networks. The business of telecommunications could be driven       In response to the success of mobile application stores driven
by established retail brands with first-class sourcing, supply     by the likes of Apple, 24 of the world’s largest mobile providers
chain and customer management capabilities.                        teamed together in February 2010 to announce an initiative to
                                                                   collaborate on a wholesale platform for mobile applications
                                                                   with a single point of entry for developers.28 Forty organiza-
                                                                   tions in total within the telecom industry are supporting the
                                                                   One Voice initiative.29 Based on current open standards, this
                                                                   initiative defines the minimum mandatory functionality for
                                                                   interoperable IMS-based voice and SMS over LTE, which is
                                                                   needed to drive the global mobile industry toward a standard
                                                                   for delivering voice (and messaging) services for LTE (VoLTE).
14    Telco 2015


                         Survivor Consolidation                                                         Market Shakeout
  Usage                  	Communications are“siloed” and fragmented                                    	Communications are “siloed” and fragmented from a wide range of
                         	Connectivity is personal and asymmetric, with more download than               suppliers and aggregators. Consumers opt for over-the-top and user-
                           upload                                                                         generated content
                         	Passive content consumption remains strong. In emerging economies            	 emerging markets, mobile money paves the way for other simple
                                                                                                          In
                           communication remains voice-centric on mobile; Internet and data usage         data applications catering to specific local market needs.
                           is limited to large cities with sufficient data networks, but deployment
                           of basic mobile data services, (e.g., mobile money, information advisory
                           services) meets with success.

  Services               	Services remain as today as Telcos fail to enter new industry verticals      	There is greater focus on wholesale backbone business as well as
                           and/or expand horizontally                                                     Information, Communication and Technology (ICT) services
                         	Packaged connectivity and communications services prevail.                   	Telcos expand horizontally to offer premium connectivity services that
                                                                                                          enable content/application providers to offer OTT content services
                                                                                                          with adequate quality of service (QoS) and service level agreements
                                                                                                          (SLAs)
                                                                                                        	Emerging market providers focus on growing mobile data usage.


  Access                 	Ultra broadband availability is limited to 10-15 percent of households,      	Government, municipality and alternative provider (e.g., local housing
                           primarily in economically profitable, densely populated areas                  associations, utilities) initiatives increase ultra-fast broadband
                         	 smaller providers, active network outsourcing to NEPs and passive
                           For                                                                            household coverage to 20-25 percent in advanced markets
                           sharing with one another is sustained for FTTx and LTE                       	Passive infrastructure sharing becomes the norm for most providers
                         	Handset subsidies remain and telecom networks remain closed to                 for FTTx deployment and for 2G/3G mobile infrastructure optimization
                           unapproved devices, third-party providers or applications/services.          	Low-end, SIM-only, open devices co-exist with high-end devices,
                                                                                                          based on exclusivity periods and strategic partnerships with OEMs.

  Business               	User-funded subscription revenues dominate and still rely upon               	Multiple tariff packages, including metered and bundled, that appeal
  model                    maintaining high ARPU across limited number of accesses                        to different segments are supplied under a variety of market brands
                         	Retail-driven with multiple tariff packages, including metered and bundled   	Predominantly subscription-based but driven in part by wholesale,
                           for different segments with an emphasis on cost control                        as devices, application and content providers leverage premium
                         	Content market of limited value. Service providers absorb network costs        connectivity
                           from increased OTT content consumption or pass connectivity costs to         	Ultra-fast broadband (FTTH and LTE) offers are priced at levels
                           users.                                                                         comparable to broadband connectivity, encouraging rapid migration
                                                                                                        	Open access models financed by government/municipalities in gray/
                                                                                                          sparsely populated areas.


  Industry               	Consolidation of declining private-sector players in advanced markets;       	Some Tier-2 providers divest network and assets to focus on
  structure                competition typically revolves around a limited number of large integrated     customers and brand
                           players as fixed and mobile pure-plays disappear                             	Multiple service provider brands emerge to package low-cost, no frills
                         	 emerging markets, a duopoly of mobile service providers is the norm
                           In                                                                             services targeted at specific consumer segments
                         	Large mobile-centric providers from BRIC successfully gain footholds         	Major device manufacturers provide communications services as
                           across emerging regions (e.g., Africa), replicating their low-cost models.     MVNOs in major markets
                                                                                                        	 handful of NEPs manage networks for a significant percentage
                                                                                                          A
                                                                                                          (more than half) of global telecom providers.
  Regulation             	 is, with ongoing uncertainty
                           As                                                                           	Strong access obligations on infrastructure and strong net neutrality
                         	NGA investment is stifled by very restrictive regulation or uncertainty        stance undermine investment incentives
                         	Providers reduce rollout speed and geographic coverage of NGA.               	Local not-for profit network initiatives and governments/municipalities
                                                                                                          provide open access.


Source: IBM Institute for Business Value analysis.


Table 1: Characteristics of each of the four possible telecommunications scenarios.
IBM Global Business Services        15


Clash of Giants                                                                      Generative Bazaar
	Users adopt shared capabilities (e.g., presence, contact list) and enhanced rich   	Advanced users mix and match communication tools; most adopt open shared
  multimedia communication booms                                                       capabilities (e.g., presence, contact list) across voice and online communication.
	 significant portion of consumers purchase packaged digital content and
  A                                                                                    Enhanced, rich multi-media communication is the norm in advanced markets
  lifestyle services (e.g., healthcare, payments, security, energy management)       	Usage extended to any object for personal and professional use by individuals and
  from providers                                                                       third parties
	Voice services dominate in emerging markets and extend to the remaining            	Seamless and ubiquitous access across devices and networks.
  population at the base of the pyramid.


	Providers gain sizeable commercial traction for packaged end-to-end solutions      	Open approach triggers new connectivity needs for OTT providers delivering
  for strategic verticals. Some premium network-optimized entertainment                industry-specific solutions (e.g., wellness and smart grid services) but no end-to-end
  services (e.g., multi-sensorial, 3-D, immersive reality) gain commercial success     packaged Telco “vertical” offering
	Shared communications capability (e.g., RCS) becomes standard feature              	Premium connectivity (e.g., guaranteed low latency, security, CDN) for OTT providers
  offering.                                                                          	Local applications that meet emerging market specificities boom
                                                                                     	 Voice
                                                                                       HD
                                                                                     	Shared communications capabilities
                                                                                     	Large-scale machine-to-machine communications.
	Next generation access infrastructure sharing extends coverage to 40-50            	Widespread fixed and/or mobile ultra-broadband availability, with coverage of 50 - 60
  percent of households                                                                percent of households
	Providers enter strategic partnerships with selected device manufacturers for      	Open devices (e.g., unlocked phones, Netbooks) dominate market as providers
  customized devices with support for proprietary service, network and platform        retreat from handset subsidization
  features.                                                                          	Open and standardized device platforms supported by Net Co-ops and device
                                                                                       manufacturers.


	Voice communication services are free for users who pay for shared                 	Voice services continue to be paid-for on mobile, but fixed communications become
  capabilities                                                                         an embedded feature of connectivity
	Retail dominated, based on customer ownership and delivery of end-to-end           	Wholesale-driven with premium connectivity a key feature for revenue generation.
  targeted services and experiences based on network and customer insights             Providers are able to generate premium prices for ultra broadband (FTTx, LTE)
	New revenues from packaged end-to-end digital content and lifestyle services       	OTTs collaborate with network providers and pay carriage fees or share revenues in
	Emerging market providers focus on optimizing their asset utilization by             return for network-optimized delivery to enhance end-user experience
  growing voice revenues through more users at the base of the pyramid.              	Providers ramp up M2M to generate low ARPU for an infinite number of connected
                                                                                       objects
                                                                                     	 Co-ops supply analytics to service providers for platform advertising and
                                                                                       Net
                                                                                       improved customer experience.
	Active global industry alliances and standards, some of which pave the way for     	 co-operative of infrastructure providers support a myriad of asset-light service
                                                                                       A
  global provider consolidation                                                        providers such as VNOs, OTTs, banks, utilities, governments, etc.
	European and North American providers consolidate at regional level (e.g., two     	Vertically integrated models replaced by horizontal model with NetCo/ServCo
  or three pan-European providers)                                                     separation
	OTT players integrate backwards and build out own fixed networks in selected       	Passive infrastructure sharing, but no network outsourcing.
  geographies. Others are successful in bidding and acquiring spectrum for
  mobile
	Some emerging market providers enter mature markets.

	Light-touch regulation on infrastructure to encourage infrastructure competition   	Evolution to Internet-style model with light-touch regulation for Telcos
	 endorsement by regulator of strong net neutrality positions
  No                                                                                 	Abolition of the majority of sector-specific services regulations, creating a level
	Telcos develop a portfolio of premium services (e.g., 3-D TV) but have to carry      playing field in services for Internet and Telco players
  competing OTT services.                                                            	Structural separation of access networks with wholesale open access to best-in-
                                                                                       class services and applications from any provider
                                                                                     	Open access is the norm.
16   Telco 2015


Other events that may trigger a Clash of Giants scenario          Scenario revenue and profitability outlooks
include integration of OTT players into the network. Eric         The 2015 scenarios each have different revenue profiles and
Schmidt, CEO of Google, announced in February 2010 that           include varying levels of contributions to the overall mix from
Google will be building an ultra-high speed optical network       communications (voice and basic data), connectivity
with speeds of 1 Gbps to connect up to 500,000 consumers in       (broadband, legacy and enterprise) and digital media/content.
the United States, enabling them to download a high-defini-       We have designed a revenue and profitability model for each
tion movie in less than five minutes, or watch live 3-D video     scenario based on assumptions of penetration and ARPU
services.30                                                       growth for fixed voice, mobile voice and data (SMS), VoIP/
                                                                  VoBB, fixed broadband (including dial-up), mobile Internet
Generative Bazaar is predicated on the break-up of the vertical   and broadband, machine–to-machine connectivity, IPTV and
integration model, resulting in some form of structural           mobile content services.
separation of Telcos into distinct network (NetCo) and services
(ServCo) businesses. It is unlikely that there will be many       In a Survivor Consolidation scenario, fixed-mobile substitution
competing NetCos in any one country, but rather a handful of      accelerates, mobile penetration slows and ARPU declines as
providers that will form a co-operative (Net Co-op). This         consumers move to control spending on telecom services and/
co-operative will be based on a viable funding model to           or turn to VoIP/VoBB alternatives. Despite the downturn, fixed
support open access infrastructure (see Appendix 2 for            and mobile broadband penetration increases modestly as
examples of emerging net co-op models).                           providers offer competitive “all-you-can-eat” bundles and users
                                                                  opt for free OTT services. Paid content services, however,
The Net Co-op may also emerge through the deliberate              decline.
intervention of national governments, as currently exemplified
in Australia and Singapore, or through voluntary cooperation      As governments and municipalities participate more actively in
of infrastructure providers such as in the Netherlands (see       extending ultra-fast broadband capabilities and fixed connec-
Appendix 2, page 22). Generative Bazaar depends on wide-          tivity penetration, this potentially triggers a Market Shakeout
spread deployment of ultra-fast broadband and the availability    scenario. Overall ARPU declines sharply, but premium
of connectivity with pervasive and ubiquitous access supporting   connectivity services enable OEMs and content providers to
the proliferation of Smartphones, Netbooks, MIDs and large        bundle content or device-centric applications with connec-
volumes of other connected devices. This would serve to           tivity.
accelerate the explosion of new services and applications
emerging to support the increasingly digital economy and          In Clash of Giants, while fixed voice penetration continues to
personal lifestyles.                                              decline, overall voice revenue erosion is contained as
                                                                  consumers increasingly adopt and pay for end-to-end packaged
                                                                  services and enhanced rich communication capabilities.
                                                                  Consumers come to accept network-optimized vertical
                                                                  industry applications and digital lifestyle services from telecom
                                                                  providers. Providers in emerging markets are successful in
                                                                  extending communications to many more people as ultra-low-
                                                                  cost handset penetration increases.
IBM Global Business Services          17


PSTN line losses accelerate sharply, along with significant
decreases in ARPU as providers migrate consumers to                           Global GDP versus telecom growth scenarios
managed VoIP offerings in a Generative Bazaar scenario. VoIP/
                                                                             7%
VoBB use is widespread as connectivity becomes part of the                               Global telecom
fabric of society and is bundled with all broadband/connec-                  6%
                                                                                                                                Generative Bazaar 5.3%
tivity packages. Users pay only for communications aggrega-                  5%                                                                      4.5%
tion and shared capability services across multiple tools.


                                                                    Growth
Phenomenal growth in mobile broadband continues, and                         4%
                                                                                                                                     Clash of Giants 3.3%
nearly all mobile users in advanced markets have data connec-                3%               Global GDP
tivity plans across multiple devices. In emerging markets,                                                                       Market Shakeout 1.8%
                                                                             2%
mobile broadband is the de facto Internet platform as mobile
devices become the users’ portable digital identity. OTT video,              1%

applications, services and digital content services boom as a                                                                Survivor Consolidation 0.2%
                                                                             0%
result of open access infrastructure. There is also a significant                 ‘05   ‘06      ‘07   ‘08     ‘09     ‘10     ‘11      ‘12    ‘13     ‘14

ramp-up in the penetration of M2M services as low tariff
                                                                     Source: International Monetary Fund (IMF), World Economic Outlook Database, October 2009,
packages enable profitable network connectivity of objects and       http://imf.org/external/pubs/ft/weo/2009/01/weodata/index.aspx; IBM Institute for Business
                                                                     Value and IDATE analysis; 2004 - 2009 growth forecasts are based on IDATE “World Telecom
sensors.                                                             Service Market,” 2008 Edition, January 2009, revision in July 2009; forecasts for. 2010 -2015
                                                                     are IBM Telecom 2015 scenario forecasts.

Regardless of which scenario dominates, PSTN revenues                Figure 10: Generative Bazaar represents the most optimistic growth
decline. Likewise, fixed and mobile connectivity/broadband           outlook.
revenues increase in all scenarios. Overall, the financial model
suggests Generative Bazaar is potentially the most profitable,       A critical potential industry shift is the overall composition of
with the highest revenue and growth prospects. However, it is        the telecom revenue mix as the once-dominant PSTN voice
also the most challenging scenario because of the dramatic           business disappears and mobile revenue growth stalls. In 2008,
degree of change it will demand from the industry. Clash of          the proportion of total industry revenue in advanced markets
Giants may, indeed, be more a plausible and natural evolution        attributed to communications (PSTN Voice, VoIP/VoBB,
in a recovering/slower-growing economy, even if revenue and          Mobile Voice and SMS) was approximately 75 percent, versus
profitability potential is less than in Generative Bazaar (see       24 percent for connectivity (fixed broadband, dial-up Internet,
Figure 10).                                                          legacy corporate data services, mobile broadband and machine-
                                                                     to-machine revenues) and 1 percent for content.31 With the
                                                                     growth in broadband and the slowdown of communications
                                                                     revenues, this split is likely to shift, with a greater share going
                                                                     to connectivity.
The most promising scenario will require a
fundamental change in industry structure
and result in a shift in revenue mix, with
connectivity supplanting communication
services as the dominant contributor.
18    Telco 2015


The four scenarios show contrasting revenue composition                                   Critical success attributes and imperatives
outcomes (see Figure 11). Survivor Consolidation and Clash of                             The scenarios should not be treated as strategic aspirations or
Giants retain the current revenue mix structure, even as their                            choices by any specific provider. They are significantly influ-
share of connectivity increases. In Market Shakeout, parity                               enced by a number of highly dynamic external factors,
exists between communications and connectivity in the overall                             including government policy, regulation, technology evolution,
revenue composition. However, Generative Bazaar reflects a                                industry dynamics and the state of the local/global economy.
model that is opposite the dominant model of today. Connec-                               Collectively, industry players in specific markets or regions can
tivity revenue becomes most prevalent in the mix. PSTN voice                              shape and influence these outcomes, but the imperative is for
declines, and fixed voice communication is offered virtually for                          telecom providers to focus on the attributes for success for the
free as a standard service in mobile and fixed broadband                                  scenario most likely to emerge, and to begin to take action now
packages. The demand for access grows, fueled by the prolif-                              to best position themselves for the future.
eration of smart devices, including machine-to-machine
connectivity supporting growth in sensing and automated
response capabilities.


                                                                                           69%                49%               64%                 35%

                                                               75%
               Communications                                                                                                                       60%
               PSTN voice, VoIP/ VoBB, mobile                                                                 49%
               voice, SMS revenues
                                                                         2015              30%                                  31%
               Connectivity                                         Developed
               Fixed broadband, dial-up                               markets
               Internet, legacy corporate data                                             1%                 2%                5%                  5%
               service, 3G/mobile broadband
               and machine-to-machine                                           Survivor           Market            Clash of          Generative
               revenues                                                         Consolidation      Shakeout          Giants            Bazaar

               Content                                                                     85%                80%               81%                 63%
               IPTV and mobile content (music,                 24%
               video, mobile TV, games,
               advertising)

                                                               1%
                                                        2008             2015                                                                       34%
                                                                     Emerging              14%
                                                                                                              20%               18%
                                                                      markets                                                                       3%
                                                                                           1%                 0%                1%

Source: IBM Institute for Business Value and IDATE analysis.


Figure 11: Although revenues shift from communications to connectivity in all four scenarios, the substitution is highest by far in the
Generative Bazaar.
IBM Global Business Services   19


To be successful in a Survivor Consolidation scenario, telecom      Summary and conclusions
providers will have to achieve scale, reduce cost-to-serve,         After a decade of unprecedented change, where the phenom-
contain voice ARPU erosion, secure a significant proportion of      enal growth of mobile telephony has given rise to an era in
the ultra-fast broadband market and increase share of high-         which anyone who wants – and can afford – telephony has it,
value customers.                                                    the industry is at an inflection point as it postures itself for
                                                                    future growth . . . or survival. Unless the telecom industry is
In a Market Shakeout scenario, successful telecom providers         able to reinvent itself as it did with mobile telecommunications
will be those that have clear and distinctive roles in a frag-      in the 1990s, the next few years could usher in a period of flat/
mented and horizontally integrated industry; a powerful brand/      declining growth as opportunities for industry growth based on
reputation; viable premium connectivity propositions for            increasing customer penetration gradually diminish.
third-party application providers; agile, flexible and reconfigu-   Continuing along this path favors the emergence of a Survivor
rable processes and infrastructure; and the ability to provide      Consolidation or Market Shakeout scenario, both of which are
ubiquitous and cost-effective ultra-fast broadband access.          likely to yield very low levels of growth.

The providers likely to be successful in the Clash of Giants        A return to strong growth requires the telecom industry to act
scenario will include those with the ability to effect collabora-   collectively to create the necessary conditions for the
tive inter- and intra-industry alliances; deliver innovative and    emergence of the more profitable scenarios, Clash of Giants or
differentiated network-optimized experiences based on               Generative Bazaar. They can do so by focusing their strategic
end-to-end packages; and enhance the role of service providers      priorities on those capabilities required to deliver on the
in adjacent vertical markets to achieve competitive cost            critical success attributes for these growth scenarios, including:
structures and scale.
                                                                    •	   Global industry collaboration on common capabilities,
Success in the Generative Bazaar scenario will be dependent              enablers and platforms to facilitate innovation and improve
on the provider’s ability to achieve structural industry separa-         competitiveness with global OTT providers
tion; a pervasive open network access infrastructure; support       •	   Enhancing the role of the service provider to enable new
for third-party application/services innovation; a dynamic               business models in adjacent vertical markets such as e-health,
business design; and the ability to leverage advanced customer           smart grids, transportation, retail and banking
and network analytics.                                              •	   Pervasive and open access connectivity for any person, object
                                                                         and a multitude of devices, optimized to deliver large data
For a more detailed view on the capabilities required to                 volumes cost-effectively
successfully achieve the attributes for each scenario, please
reference Appendix 3 on page 23.
20    Telco 2015


•	   Value propositions for third-party application and asset-light     To be ready, providers will need to watch for the key scenario
     service providers with a range of coarse to granular wholesale     triggers we’ve described, understand the requirements for
     connectivity offers, open interfaces to network capabilities and   success in each of these contrasting environments, begin to
     services enablers, and infrastructure support for common           address execution gaps and nurture critical capabilities that are
     business process services (e.g., billing, CRM), along with a       common across all four scenarios. These include a cost-effec-
     viable commercial model                                            tive ultra-fast broadband deployment strategy, business
•	   Harnessing information and business insights to reduce             optimization based on more advanced network and customer
     complexity and costs and to deliver new customer experiences       insights, more effective cost management and embracing a
     that enable new business models.                                   highly collaborative culture.
IBM Global Business Services        21


Appendix 1
Scenario realization: Major prerequisite economic, regulatory and market triggers for each scenario


                       Economic and financial           Investment and technology           Competition and regulation                     Customers and markets

 Survivor                Prolonged economic
                        	                               Constrained access to, or
                                                        	                                   Increased price competition
                                                                                            	                                              Stagnating penetration at or near
                                                                                                                                           	
 Consolidation           downturn                        increased cost of, capital          High wholesale and interconnect
                                                                                            	                                              current levels
                         Declining/flat revenues/
                        	                               Reduced/flat capex
                                                        	                                   charges                                        Inability to monetize value-added
                                                                                                                                           	
                         margins                         Reduced investment in service
                                                        	                                   Governments foster favorable M&A
                                                                                            	                                              services
                         Investor loss of
                        	                               innovation and research.            climate                                        Consumers reduce spending
                                                                                                                                           	
                         confidence.                                                         Some under-performing providers
                                                                                            	                                              Consumers switch to lower cost
                                                                                                                                           	
                                                                                             hand back licenses.                            alternatives.

 Market                  Prolonged economic
                        	                               Governments/municipalities
                                                        	                                   Increased network outsourcing and
                                                                                            	                                              Proliferation of brands emerge to
                                                                                                                                           	
 Shakeout                downturn                        increase network infrastructure     infrastructure sharing                         target specific segments/services
                         Declining/flat revenues
                        	                               investments                         Voluntary/forced separation
                                                                                            	                                              Stagnating penetration at or near
                                                                                                                                           	
                         Industry EBITDA
                        	                               Private sector capex constrained
                                                        	                                   Viable B2B market for premium
                                                                                            	                                              current levels
                         consistently performs           Private equity enters and
                                                        	                                   connectivity services emerges                  Consumers reduce spending
                                                                                                                                           	
                         below historic levels.          acquires under-performers and       Telcos outsource other parts of
                                                                                            	                                              Consumers switch to lower-cost
                                                                                                                                           	
                                                         breaks them apart.                  business – e.g., support, retail , IT, etc.    alternatives.
                                                                                             Governments take over infrastructure
                                                                                            	
                                                                                             of ailing incumbents.

 Clash of                Growing, vibrant global
                        	                               Unencumbered access to and
                                                        	                                   Global telecom consolidation
                                                                                            	                                              Greater willingness of
                                                                                                                                           	
 Giants                  economy                         lower cost of capital               OTT provider consolidation with a
                                                                                            	                                              customers to purchase digital
                         Increased consumer
                        	                               Increased capital expenditure
                                                        	                                   small number of significant global             lifestyle services (e.g., energy
                         confidence and spending         Global telecom technology
                                                        	                                   players                                        management, e-health) from
                         on communications               alliances and standardization       Some emerging market providers
                                                                                            	                                              Telcos
                         Vertically integrated Telcos
                        	                               OTTs integrate backwards into
                                                        	                                   enter advanced markets                         End-to-end customer experience
                                                                                                                                           	
                         deliver superior returns        the network with their own          OTT actions pose significant
                                                                                            	                                              and QoS are a key differentiator
                         and shareholder value.          spectrum and infrastructure         competitive threat to Telcos.                  Customers expect ubiquitous,
                                                                                                                                           	
                                                         Providers invest in selected
                                                        	                                                                                  seamless access and rich
                                                         verticals.                                                                         multimedia communication
                                                                                                                                            interactions.

 Generative              Increased investor
                        	                               Unencumbered access to and
                                                        	                                   Providers devise funding model for
                                                                                            	                                              Increasingly, organizations
                                                                                                                                           	
 Bazaar                  confidence in Telco two-        lower cost of capital               open access infrastructure market              package connectivity with their
                         sided business model            Increased capex
                                                        	                                   National governments fund open
                                                                                            	                                              own services
                         Growing, vibrant global
                        	                               Widespread deployment of ultra-
                                                        	                                   infrastructure for economic growth             Proliferation of MIDs
                                                                                                                                           	
                         economy                         fast broadband                      Infrastructure to services-based
                                                                                            	                                              Smartphones, Netbooks and
                         Increased consumer
                        	                               Investment in developer
                                                        	                                   competition and regulation                     connected devices
                         confidence and spending         platforms, tools, communities.      Asset-light providers emerge to
                                                                                            	                                              Consumers demand access to
                                                                                                                                           	
                         on communications.                                                  innovate on open infrastructure.               services from multiple providers.

Source: IBM Institute for Business Value analysis.


Table 2: Major prerequisite economic, regulatory and market triggers for each scenario.
22   Telco 2015


Appendix 2
Emerging net co-op models


Open access net co-ops
Creation of Net Co-ops, aimed at providing national or local   owned by the state (51 percent) and the private sector (49
open access network infrastructures, are already under         percent) – in order to build and operate a fiber-to-the-home
way.                                                           network that provides broadband to 90 percent of urban
                                                               and regional towns at speeds of 100 Mbps.34 Next genera-
In the Netherlands, KPN has announced a plan to “roll out      tion wireless and satellite will be employed to cover the re-
its next generation network based on an open access            maining 10 percent. NBN will operate the network on a
model, using a joint venture to spread the risk and sepa-      wholesale only basis, with no role in retail services direct to
rate the functions of wholesale access for providers from      consumers, and will provide rights of access to all service
retail sales direct to consumers.”32 The other members of      providers on non-discriminatory terms and conditions.
the consortium are Tele2-Versatel, BBned and Orange NL
(now Online.NL).33 KPN has memoranda of understanding          In Singapore, the government is rolling out the open access
in place with each company on the terms of next genera-        Next Generation National Broadband Network (Next Gen
tion roll out and sharing of facilities.                       NBN) that will offer pervasive ultra-high speed connectivity
                                                               by 2015, supporting a range of new and exciting Next Gen
Australia and Singapore offer an alternative government-led    Services such as high-definition video conferencing, tele-
model. In April 2009, the Australian government launched a     medicine, Grid Computing-on-Demand, security and im-
National Broadband Network (NBN) company – jointly             mersive learning applications.35
IBM Global Business Services     23


Appendix 3
Critical success attributes and capability implications

A-3.1 Survivor Consolidation

 Critical success attributes   IBM recommendations
 Achieve scale                  	Deploy standardized processes and technology platforms for rapid and seamless M&A integration
                                	Leverage dynamic infrastructures, global resources, “centers of excellence,” and standardized and automated
                                  processes for scale
                                	Institutionalize processes to identify acquisition targets, conduct due diligence and close M&A transactions.
 Reduce cost-to-serve           	Explore selective use of network outsourcing and infrastructure sharing
                                	Accelerate migration to converged/single core IP-based NGN
                                	Optimize and consolidate IT infrastructure
                                	Leverage global resources, “centers of excellence” and business process outsourcing (BPO) as necessary
                                	Simplify and automate business processes and transition to self-service.
 Contain voice ARPU             	Bundle basic communication services with access/value-added services
 erosion                        	Enable access to widest range of communication tools/channels and facilitate integration of lower-cost/free
                                  alternatives with subscribed services
                                	Acquire/partner with mobile, OTT communications, fixed or broadband provider to plug capability gap in
                                  communications portfolio
                                	Leverage customer insights for cross-/up-sells.
 Secure significant share       	Acquire/partner with incumbent local network infrastructure organizations to accelerate the deployment of ultra-
 of ultra-fast broadband in       fast broadband access in densely populated areas
 densely populated areas        	Passive infrastructure sharing, including underground ducts.
 Increased share of high        	Leverage network insight into customer experience to deliver personalized experiences and services
 value customers                	Apply social network analytics to enable automated identification of group leaders for focused retention and
                                  attraction (churn management) actions
                                	Develop end-to-end visibility of high value customers for focused retention and attraction (churn management)
                                  actions.
24   Telco 2015


Appendix 3
Critical success attributes and capability implications

A-3.2 Market Shakeout

 Critical success attributes     IBM recommendations
 Clear and distinctive role(s)   	Identify strategic areas of focus in fragmented/disaggregated industry value chain aligned with core capabilities
 in disaggregated value          	Build collaborative relationships with key external partners for open innovation
 chain and ability to partner    	Define and implement common standards, processes and platforms to support external collaboration.
 externally
 Powerful brand/reputation       	Leverage insights across the customer lifecycle to enhance the end-to-end customer experience
                                 	Deliver differentiated and personalized experiences
                                 	Proactively monitor and track actual experience delivered with the capability to adjust in realtime.
 Viable premium                  	Enable open and standardized access to premium connectivity (e.g., device management, CDNs) and service
 connectivity propositions         enablers (e.g., presence, location)
 for third-party application     	Integrate partner services/offerings with providers’ retail channel and application stores
 providers                       	Develop platforms and tools for information sharing with partners (e.g., device OEMs and application and content
                                   providers).
 Agile, flexible and             	Implement standardized processes based on dynamic infrastructures to optimize business flexibility
 reconfigurable processes        	Leverage global resources and “centers of excellence” to optimize capability
 and infrastructure              	Leverage dynamic architectures and cloud-based infrastructure to optimize costs.
 Ubiquitous and cost-            	Deploy standardized processes and technology platforms for rapid and seamless M&A integration
 effective ultra-fast            	Leverage dynamic infrastructures, global resources, “centers of excellence,” and standardized and automated
 broadband access                  processes for scale
                                 	Institutionalize processes to identify acquisition targets, conduct due diligence and close M&A transactions.
IBM Global Business Services      25


Appendix 3
Critical success attributes

A-3.3 Clash of Giants

 Critical success attribute   IBM recommendations
 Collaborative inter/intra-   	Adopt and implement global standards for service interoperability across fixed and mobile Internet
 industry alliances           	Develop and implement global standards for application/service roaming
                              	Global collaboration in service innovation and development.
 Innovative and               	Invest in service innovations based on tightly coupled intelligent network capabilities and content services to
 differentiated network-        deliver new, unrivalled experiences
 optimized experiences        	Speed time-to-market through greater experimentation and collaboration
                              	Leverage insights across the customer lifecycle to enhance and deliver differentiated end-to-end customer
                                experience.
 Enhanced service provider    	Clarify role in selected verticals and develop capabilities and domain expertise through acquisition, or partner to
 roles in vertical markets      deliver solutions
                              	Deliver customer experience consistent with service level expectations along with requisite sales support
                                organization/infrastructure for verticals
                              	Collaborate with partners in the ecosystem in defining new and common standards for telecom-enabled vertical
                                services (e.g., mobile payments).

 Efficient and competitive    	Unified support infrastructure for end-to-end service management across all platforms and devices
 cost structure               	Explore use of network outsourcing and infrastructure sharing as necessary
                              	Optimize and consolidate IT infrastructure
                              	Simplify and automate business processes and transition to self-service.
 Achieve scale                	Deploy standardized processes and technology platforms for rapid and seamless M&A integration
                              	Leverage dynamic infrastructures, global resources, “centers of excellence,” and standardized and automated
                                processes for scale
                              	Institutionalize processes to identify acquisition targets, conduct due diligence and close M&A transactions.
26   Telco 2015


Appendix 3
Critical success attributes and capability implications

A-3.4 Generative Bazaar


 Critical success attributes    IBM recommendations
 Structural separation of       	Negotiate appropriate point of separation to preserve the integrity of the NetCo and ServCo businesses and align
 network and services             skills with business outcomes.
 operations                     	Define and implement target operating model for separation along with processes, systems and organizational
                                  design
                                	Build capability to support dynamic wholesale pricing for different levels of service.
 Pervasive open network         	Devise shared/co-operative funding model for open network access with risk sharing
 access infrastructure          	Anticipate and plan for growth in data and build/optimize network to deliver large volumes cost-effectively
                                	Secure regulatory incentives for open and non-discriminatory access.
 Third-party applications/      	Establish value proposition for third-party providers, including interfaces to network capabilities, service enablers
 services innovation              based on open standards, access to ecosystem of partners, a commercial model and infrastructure support for
                                  common business process services, e.g., self-service, e-commerce, billing
                                	Provide test infrastructure for experimentation and stimulate developer community to ramp-up application/service
                                  innovation.

 Dynamic business design        	Enable infrastructure/processes to support connectivity of a multitude of objects, sensors, devices and
                                  applications
                                	Enable real-time data collection and analytics for dynamic decision support
                                	Leverage dynamic architectures and cloud-based infrastructures to reduce cost, and for business flexibility.
 Leverage advanced              	Leverage insights into network and usage data to optimize core and access networks; reduce costs; and
 customer and network             improve customer experience
 analytics                      	Proactively monitor, track and effect actual experience in real-time
                                	Leverage insights across the customer lifecycle to enhance and deliver differentiated end-to-end customer
                                  experience.
IBM Global Business Services   27


Glossary36


2G – Short for second generation of mobile telephony                Dongle – Portable mobile broadband adapter connected to a
systems.                                                            laptop or PC via a USB port.
2.5G – An extension of 2G systems to support packet-                xDSL (Digital Subscriber Line) – A family of technologies
switched data communications.                                       capable of transforming ordinary phone lines into high-speed
3G – Third generation of mobile systems that supports               digital lines for Internet access. ADSL (asymmetric digital
conventional voice along with high-speed data transmission          subscriber line) allows higher speeds in one direction (toward
for multimedia (including video) communications over a mobile       the customer) than the other. HDSL (high data rate digital
network.                                                            subscriber line) and VDSL (very high data rate digital
                                                                    subscriber line) are all variants of xDSL).
3.5G – (see HSPA)
                                                                    FTTC (Fiber-to-the-cabinet) – Access network consisting of
Access network – Connection of end-user premises to a               optical fiber from the exchange to the cabinet or node at the
service provider. It is sometimes referred to as the “local loop”   end of the road (in a residential area) and a traditional copper
or “last mile.”                                                     pair augmented with high-speed DSL technology (e.g., VDSL)
ARPU (Average revenue per user) – earned from a subscriber,         to the customer’s premises.
typically over a month.                                             FTTH (Fiber-to-the-home) – Optical fiber is extended all the
Blog – Short for Weblog. A Weblog is a journal (or newsletter)      way to the customer’s home.
that is frequently updated.                                         FTTB (Fiber-to-the-building) – Similar to FTTH but building is
Broadband – “Always on” high-speed Internet access with             typically a multi-dwelling unit (MDU) e.g., a block of flats.
speeds in excess of 256 Kbps.                                       FTTx – Variants of optical fiber access networks – e.g., FTTC,
CAGR (Compound Annual Growth Rate) – The average                    FTTH, FTTB.
annual growth rate over a specified period of time.                 GSM (Global System for Mobile Communications) – A global
CDN (Content Delivery Network) – A network of computers             standard for mobile telephony.
that cache data at various points in a network to enhance           GSMA (GSM Association) – The trade body for the world’s
delivery and user experience.                                       mobile operators.
CSP (Communication Service Providers) – An umbrella term            HDTV (High-definition television) – A technology that provides
used to describe both traditional providers of communication        viewers with better quality, high resolution pictures.
services (i.e., telecom) and alternative providers such as cable
TV companies and other-the-top providers.                           HD Voice – A technology that provides better audio quality by
                                                                    delivering at least twice the sound range (wideband) of a
                                                                    traditional (narrowband) telephone call.
28   Telco 2015


HSPA (High Speed Packet Access) – Often referred to as            Microblogging – Short-form blogging. The term is commonly
3.5G, this is an extension to the original 3G standard            associated with the Twitter service, on which messages are
providing significantly higher data rates. HSDPA (downlink)       no longer than 140 characters.
can provide theoretical maximum downlink speeds of 14.4           MMS (Multimedia Messaging Service) – The next generation
Mbps. HSUPA (uplink) supports maximum uplink speeds of            of mobile messaging services, adding photos, pictures and
5.76 Mbps.                                                        audio to text messages.
IMS (IP Multimedia Subsystem) – Part of 3G Architecture           Mobile broadband – Various types of wireless high-speed
designed to provide ubiquitous cellular access to all Internet    Internet access through a portable modem, telephone or
services.                                                         other device.
IP (Internet Protocol) – The packet data protocol used for        Narrowband – A service or connection providing data
routing and carrying messages across the Internet and similar     speeds up to 128 Kbps, such as via an analog telephone line.
networks.
                                                                  NEP (Network Equipment Providers) – Companies that supply
IPTV (Internet Protocol Television) – Television and/or video     communications equipment to service providers/operators.
signals that are delivered to subscribers or viewers using
Internet Protocol (IP), the technology that is also used to       NGN (Next Generation Networks) – Internet Protocol-based
access the Internet. We use the term to mean delivery over a      core networks that can support a variety of existing and new
“closed intranet”, typically operated by ISPs and local-loop      services, typically replacing multiple, single service legacy
unbundlers, rather than over the public Internet. IPTV services   networks.
are hosted on servers placed in the exchange, which means         NGA (Next Generation Access) networks – Broadband
they can be delivered with assured QoS since the ISP has          access networks that connect the end-user to the core
more control over the network.                                    network capable of a bandwidth quantity and quality signifi-
Local Loop –The access network connection between the             cantly in excess of current levels (a benchmark of 20 Mbps or
customer’s premises and the local PSTN exchange, usually a        more is often used).
loop comprised of two copper wires.                               PSTN (Public switched telephone network) – The network
LTE (Long Term Evolution) – The next iteration of 3G mobile       that manages circuit-switched fixed line telephone systems.
communications network, which optimizes the 3GPP’s (3rd           SIM (Subscriber Identify Module) – A SIM or SIM card is a
Generation Partnership Project) radio access architecture to      small flat electronic chip that identifies a mobile customer and
deliver mobile broadband speeds similar to those available on     the mobile operator. A mobile phone must have a SIM card
high-speed fixed broadband networks. It is based on a             inserted before it can be used.
high-speed, IP-only radio interface, promising downlink peak
rates of 100 Mbps, with uplink rates of 50 Mbps. It promises
higher spectral efficiency than normal 3G and will benefit from
much-needed new spectrum resources to support mobile
data growth.
IBM Global Business Services   29


SIM-only – A mobile contract that is sold without a handset.
SMS (Short messaging service) – Also known as “text
messaging,” this is a mechanism that facilitates the delivery of
short text messages over mobile networks.
Social networking sites – A Website that allows users to
join communities and interact with friends or to others that
share common interests.
VoBB (Voice over Broadband) – VoIP (see separate entry)
delivered over broadband networks.
VoD (Video-on-demand) – A service or technology that
enables TV viewers to watch programs or films whenever they
choose to, not restricted by a linear schedule.
VoIP (Voice over Internet Protocol) – Voice communications
transmitted over public Internet or private IP networks.
VNO (Virtual Network Operator) – A telecom service provider
that does not have allocation of spectrum or its own network
and uses those of another operator to deliver services to its
customers. MVNO is Mobile Virtual Network Operator.
WiMAX (Worldwide Interoperability for Microwave Access) – A
wireless MAN (metropolitan area network) technology, based
on the 802.16 standard. Available for both fixed and mobile
data applications, the technology was approved as a 3G
standard by the International Telecommunications Union (ITU)
in 2007.
30   Telco 2015


About the authors                                                Executive sponsors
Ekow Nelson leads strategic thought leadership and research      Chris Pearson, Senior Client Partner, Telecom Industry, IBM
in telecommunications at IBM’s Institute of Business Value and   Global Business Services
is a contributor to IBM‘s global telecom strategy. A manage-     Nick Gurney, Partner and Global Telecom Leader, IBM
ment consultant for over 20 years, Ekow has worked in a range    Global Business Services
of advisory and implementation roles, from strategy and
market/product development to systems integration and            Scott T. Stainken, General Manager, Telecommunications
project management for major telecommunications and media        Industry, IBM Corporation
organizations. He is author of numerous papers on Telecom-       Eric Riddleberger, Partner and Communications Sector
munications including “The changing face of communication:       Strategy & Transformation Lead, IBM Global Business
Social networking’s growing influence on telecom providers,”     Services
the Telecom editions of IBM’s CEO and CIO studies, “A
                                                                 Joseph Ziskin, Vice President, Corporate Strategy, IBM
Future in Content(ion)” and “The Innovation Paradox in the
                                                                 Corporation
Telecom Industry.” He contributes to The Annual Review of
Communications and the Journal of Telecommunications Manage-     Judith A. List, Partner and North American Telecom Lead,
ment. He can be contacted at ekow.nelson@uk.ibm.com.             IBM Global Business Services
                                                                 Mario Cavestany, Vice President Southwest Europe Telecom
Rob van den Dam is the telecommunications leader at the          and Media Lead, IBM Corporation
IBM Institute for Business Value. In this role he develops
industry outlooks and business value realization studies for     Contributors
telecom. He has 20 years experience of working in telecommu-     IDATE Consulting and Research
nications. Rob periodically presents or participates in panel
                                                                 Thomas F. Ross, Partner, Telecom Solutions Lead Northeast
sessions at major industry conferences, and has written or
                                                                 Europe, IBM Global Business Services
co-written numerous papers and articles on telecommunica-
tions and media, including “The changing face of communica-      Rob Wilmot, Partner, Telecom and Media, IBM Global
tions: Social networking’s growing influence on telecom          Business Services, UK and Ireland
providers,” Social Media: where broadcast and broadband          Zygmunt Lozinksi, Telecom Industry Technical Lead
come together,” “Fighting for Viewers - IPTV versus Internet     Northeast Europe and Master Inventor, IBM Corporation
TV,” “A Future in Content(ion),” “Cash, Credit, or Phone” and
                                                                 Gary Langley, Telecom Value Creation Lead, Northeast
“Mobile Advertising, Ads on the Move.” He can be contacted
                                                                 Europe, IBM Corporation
at rob_vandendam@nl.ibm.com.
                                                                 Dr. Hagen Wenzek, Corporate Strategy, IBM Corporation
                                                                 Matthew Stankey, Global Telecom Marketing Lead, IBM
                                                                 Global Business Services
                                                                 Andreas Erler, Associate Partner, IBM Global Business Services
                                                                 Eduardo Argueso Lopez, Telecom and Media Manager, IBM
                                                                 Corporation
                                                                 Soufian Ameziane, IBM Corporation, Germany
IBM Global Business Services   31


The right partner for a changing world
At IBM, we collaborate with our clients, bringing together
business insight, advanced research and technology to give
them a distinct advantage in today’s rapidly changing environ-
ment. Through our integrated approach to business design and
execution, we help turn strategies into action. And with
expertise in 17 industries and global capabilities that span 170
countries, we can help clients anticipate change and profit from
new opportunities.
32   Telco 2015


References                                                           10 IDATE and IBM Institute for Business Value analysis.
1    This report is based on 60 C-level interviews, over 7,700       11 Montagne, Roland. “Telcos’ views of openness.” IDATE
     consumer surveys and extensive research by the IBM                 DigiWorld Summit. 2009; IBM Institute for Business Value
     Institute for Business Value (IBV). The IBV conducted              analysis.
     face-to-face interviews with 60 senior executives from nearly
                                                                     12 “Apple’s App Store Downloads Top Three Billion.” Apple
     40 communication service providers to gain their perspec-
                                                                        Press Release, January 5, 2010. http://www.apple.com/pr/
     tives on the key drivers of change. The consumer survey
                                                                        library/2010/01/05appstore.html
     (conducted in the United States, Germany, Sweden, the
     United Kingdom, Spain, the Netherlands, China, India and        13 IDATE and IBM Institute for Business Value analysis.
     Australia) examined their views on the impact of the 2008       14 Pujol, Frédéric. “Open Mobile.” IDATE DigiWorld Summit
     global economic crisis on communication services, buyer            2009; IBM Institute for Business Value Analysis
     values and influences, demand and spending on communica-
                                                                     15 Capell, Kerry. “Vodafone and Orange Outsource To Ericsson
     tion services, content interaction models and emerging
                                                                        and Nokia.” Business Week. March 18, 2010. http://www.
     advanced communication capabilities.
                                                                        businessweek.com/globalbiz/blog/europeinsight/
2    ICT Statistics Database. International Telecommunications          archives/2009/03/vodafone_and_or.html
     Union (ITU). http://www.itu.int/ITU-D/icteye/Indicators/
                                                                     16 Ibid.
     Indicators.aspx. Note: 2009 figures are estimated; “The world
     in 2009: ICT Facts and Figures.” ITU. Geneva. 2009. http://     17 Montagne, Roland. “Telcos’ views of openness.” IDATE.,
     www.itu.int/ITU-D/ict/material/Telecom09_flyer.pdf; IBM            DigiWorld Summit. 2009
     Institute for Business Value Analysis.                          18 Cisco Visual Networking Index. June 2009. http://www.cisco.
3    IDATE and IBM Institute for Business Value Analysis                com/en/US/solutions/collateral/ns341/ns525/ns537/ns705/
                                                                        ns827/white_paper_c11-481360.pdf; Institute for Business
4    Ibid.
                                                                        Value analysis.
5    Ibid.
                                                                     19 Ibid.
6    Montagne, Roland. “Telcos’ views of openness.” IDATE.
                                                                     20 IDATE and IBM Institute for Business Value analysis.
     DigiWorld Summit. 2009
                                                                     21 “TeliaSonera launches commercial LTE in Stockholm and
7    Ibid.
                                                                        Oslo.” Telecoms.com. December 2009. http://www.telecoms.
8    IDATE, Bank of America/Merrill Lynch, Global Wireless              com/16997/teliasonera-launches-commercial-lte-in-stock-
     Matrix 1Q09 and IBM Institute for Business Value analysis.         holm-and-oslo
9    Bharti Airtel Limited, Investor Presentation, April 2009        22 Pujol, Frédéric. “Open Mobile. “ IDATE DigiWorld Summit
     (downloaded from http://www.airtel.in/wps/wcm/connect/             2009; IBM Institute for Business Value analysis.
     ea3977804dfa60049ce2bcc43c6eaf82/Investor-Presentation-
     April-09-n.pdf?MOD=AJPERES&CACHEID=ea3977804dfa
     60049ce2bcc43c6eaf82)
IBM Global Business Services   33


23 Toledano, Joëlle. “Toward FTTH.” AUTORITÉ DE RÉGU-            34 Ergas, Henry. “FTTP deployment in Australia.” IDATE
   LATION des Communications Electroniques et des Postes            DigiWorld Summit 2009.
   (ACERP). Digiworld. 2009.                                     35 Wei Ho Ka. “Fact Sheet: Next Generation National
24 Montagne, Roland. “FTTH Panorama European Union (36)             Infocomm Infrastructure.” Infocomm Development Authority
   & Middle East (14) at end December 2009.” IDATE.                 of Singapore. http://www.itu.int/osg/spu/ngn/documents/
   February 2010.                                                   NGNII-Factsheet-060303-Singapore.pdf)
25 Citynet Amsterdam.http://www.citynet.nl/                      36 The Communications Market Report.” Ofcom. 2009; IBM
26 2009 IBM Telecom Industry Survey. IBM Institute for              Institute for Business Value analysis.
   Business Value.
27 “An Introduction to RCS.” GSMA., http://www.gsmworld.
   com/our-work/mobile_lifestyle/rcs/an_introduction_to_RCS.
   htm; IBM Institute for Business Value analysis.
28 “Leading Operators Unite to Unleash Global Apps Potential.”
   GSMA. February 15, 2010. http://www.gsmworld.com/
   newsroom/press-releases/2010/4633.htm
29 “GSMA Leads Mobile Industry Towards a Single, Global
   Solution for Voice over LTE.” GSMA. February 15, 2010.
   http://www.gsmworld.com/newsroom/press-
   releases/2010/4634.htm
39 Sherr, Ian and John Poirier. “Google to build high-speed
   Internet network.” Reuters. February 10, 2010. http://www.
   reuters.com/article/idUSTRE6193XH20100210
31 IDATE and IBM Institute for Business Value analysis.
32 Benkler, Yochai. “Next Generation Connectivity.” The
   Berkman Center for Internet & Society. October 2009.
   Harvard University.
33 Ibid.
© Copyright IBM Corporation 2010

IBM Global Services
Route 100
Somers, NY 10589
U.S.A.

Produced in the United States of America
April 2010
All Rights Reserved

IBM, the IBM logo and ibm.com are trademarks or registered trademarks
of International Business Machines Corporation in the United States, other
countries, or both. If these and other IBM trademarked terms are marked
on their first occurrence in this information with a trademark symbol (® or
™), these symbols indicate U.S. registered or common law trademarks
owned by IBM at the time this information was published. Such trademarks
may also be registered or common law trademarks in other countries. A
current list of IBM trademarks is available on the Web at “Copyright and
trademark information” at ibm.com/legal/copytrade.shtml

Other company, product and service names may be trademarks or service
marks of others.

References in this publication to IBM products and services do not
imply that IBM intends to make them available in all countries in which
IBM operates.


         Please Recycle


                                                    GBE03304-USEN-01

Telcom Industry Review and Future of Telcom Providers - Telco 2015

  • 1.
    IBM Global BusinessServices Telecommunications Executive Report IBM Institute for Business Value Telco 2015 Five telling years, four future scenarios
  • 2.
    IBM Institute forBusiness Value IBM Global Business Services, through the IBM Institute for Business Value, develops fact-based strategic insights for senior executives around critical public and private sector issues. This executive report is based on an in-depth study by the Institute’s research team. It is part of an ongoing commitment by IBM Global Business Services to provide analysis and viewpoints that help companies realize business value. You may contact the authors or send an e-mail to iibv@us.ibm.com for more information. Additional studies from the IBM Institute for Business Value can be found at ibm.com/iibv
  • 3.
    Introduction By Ekow Nelsonand Rob van den Dam Despite the run-up in mobile revenues over the last few years, communications revenue growth is beginning to falter as voice markets in developing countries saturate. While the global digital renaissance has yielded pockets of success and opportunity for telecom providers, content and connectivity revenues have not offset the declines. How will the industry evolve over the next five years? Will provider strategies be proactive or protective? Our research suggests four plausible scenarios and the events that would signal their unfolding. More important, we outline the characteristics of companies most likely to succeed in each of these possible futures. The telecommunications industry has experienced more IBM research suggests that the outcomes for several important change in the last decade than in its entire history. In 1999, industry trends are highly predictable.1 Conversely, we have only 15 percent of the world’s population had access to a identified 13 significant variables from a larger pool of telephone; by 2009, nearly 70 percent had mobile phones. In unknowns that will also have significant impact on the industry. addition to this phenomenal growth in mobile communica- The outcomes of the 13 variables are far from certain and fall tions, the past decade also brought steep declines in public into two main categories: potential areas of growth and the switched telephone network (PSTN) voice revenues, an competitive structure of the industry. Mapping the extremes of explosion of over-the-top (OTT) communication services and the possible outcomes related to these uncertainties reveals global industry consolidation (see page 27 for a glossary of four contrasting scenarios depicting what the industry could common telecommunications terms and abbreviations). There look like five years from now. were even ground-breaking decisions by some Telcos to outsource functions as core to their business as their physical Four future scenarios networks. Survivor Consolidation: Reduced consumer spending leads to revenue stagnation or decline. Service providers in developed Fueled by rapid growth in developing countries, mobile markets have not significantly changed their voice communica- communications have propped up the industry’s top line. But tions/closed-connectivity service portfolio and have not now with these markets saturating, communications revenue expanded horizontally or into new verticals. Investors’ loss of growth is stalling. Expected content and connectivity-related confidence in the sector produces a cash crisis and elicits revenues have not risen quickly enough to compensate. industry consolidation. Although increases in mobile Internet usage offer a glimmer of hope – along with a host of operational challenges – the telecom industry faces some serious questions: Where will future growth come from? How will the industry evolve?
  • 4.
    2 Telco 2015 Market Shakeout: Under a prolonged economic downturn or Our modeling of the four scenarios suggests Generative Bazaar a weak and inconsistent recovery, investors force providers to as the most attractive outcome in terms of revenue, profit- disaggregate assets into separate businesses with different ability and cash flow projections, followed by Clash of Giants. return profiles. Retail brands emerge to collect and package Survivor Consolidation and Market Shakeout are clearly less services from disaggregated units. The market is further attractive scenarios, both of which imply a contracting and fragmented by government, municipality and alternative challenged industry. If the current growth model, based on an providers (e.g., local housing associations or utilities) that ever-expanding customer base, persists, the industry is likely to extend ultra-fast broadband to gray areas, while private experience flat or declining revenues. In such a case, Survivor infrastructure investments are limited to densely populated Consolidation or Market Shakeout would be the most areas. Service providers look for growth through horizontal plausible outcomes. expansion and premium connectivity services sold to applica- tion and content providers, as well as businesses and To return to strong growth, the telecom industry needs to act consumers. collectively to create the conditions necessary for the more dynamic and profitable scenarios of Clash of Giants or Clash of Giants: Providers consolidate, cooperate and create Generative Bazaar. They can begin to accomplish this through alliances to compete with OTT players and device/network greater global industry cooperation on common capabilities manufacturers that are extending their communication and platforms to improve competitiveness with global OTT footprints. Mega-carriers expand their markets through providers. The role of service providers can be enhanced in selective verticals (e.g., smart electricity grids and e-health) for adjacent vertical markets, enabling new business models in which they provide packaged end-to-end connectivity health, smart grids, transport, retail, banking and more. solutions. Telcos develop a portfolio of premium network Further growth can be achieved through pervasive, open services and better-integrated digital content capabilities to connectivity for any person, object and a multitude of deliver new experiences. connected devices by stimulating third-party innovation and leveraging customer and network insights to deliver new Generative Bazaar: Barriers between OTT and network experiences that help to accelerate the evolving digital providers blur as regulation, technology and competition drive economy. open access. Infrastructure providers integrate horizontally to form a limited number of network co-operatives that provide pervasive, affordable and unrestricted open connectivity to any person, device or object, including a rapidly expanding class of As growth and revenues from traditional innovative, asset-light service providers. services stall and data and content struggle to compensate for declines, the industry faces a range of uncertainties and must prepare for a number of alternative scenarios.
  • 5.
    IBM Global BusinessServices 3 More change in the last 10 years than the During the same period, fixed telephony (PSTN) lines previous 100 and voice revenues continued their long-term decline in The way in which the world communicates has changed more advanced markets where the volume of mobile in the last decade than in all previous history. In this section, telephony voice minutes increased at the expense of we explore the following critical changes and challenges: fixed telephony. In 2008, for example, outgoing fixed voice traffic in the EU-5 markets – France, Germany, • The mobile migration Italy, Spain and the United Kingdom – amounted to • The changing face of communication 560 billion minutes or 53 percent of total minutes of • The challenge to monetize content use (MOU), down from 645 billion minutes and 72 • The decoupling of traffic and revenue percent MOU in 2003.3 In 2010, mobile is expected for • The flight from the network. the first time to carry more outgoing voice traffic than fixed telephony.4 The mobile migration In 1999, more than a century after its invention, less than one After a decade of meteoric increases, global mobile in six people in the world had access to a telephone of any kind. growth has begun to stall. In 2008, revenue growth fell By 2009, mobile telephony was accessible for seven out of ten below double-digits for the first time.5 In some people worldwide (see Figure 1).2 advanced countries, overall mobile revenues are expected to decline for the first time during 2009-2010.6 Average revenue per user (ARPU) has actually been per 100 declining for some time. For example, ARPU for Italian inhabitants telecommuniations companies declined from almost 80 Mobile cellular telephone subscriptions €30 per month in 2004 to just over €20 per month in 70 Internet users 2008.7 Fixed telephone lines 60 Fixed broadband subscribers Over the decade, emerging markets demonstrated their 50 ability to make profits from low ARPU users, as telephony was for the first time extended to many new 40 consumers. In 2008, average EBITDA (earnings before 30 interest tax, depreciation and amortization) levels for 20 the mobile telecom industry in South Asia ranged from 45-65 percent, with ARPU levels below US$5.8 This 10 was driven, in part, by significant increases in MOU and 0 innovative cost-management models. From Q2 2008 to ‘99 ‘00 ‘01 ‘02 ‘03 ‘04 ‘05 ‘06 ‘07 ‘08 ‘09 Q4 2009, for example, Bharti Airtel roughly doubled Source: International Telecommunications Union (ITU) ICT Statistics Database, http://www.itu. the total volume of traffic on its network, from over 64 int/ITU-D/icteye/Indicators/Indicators.aspx. (2009 figures are estimated); “The world in 2009: ICT Facts and Figures,” ITU Geneva 2009, http://www.itu.int/ITU-D/ict/material/Telecom09_ billion minutes per quarter to 130 billion minutes.9 flyer.pdf Figure 1: Mobile cellular telephony has exhibited strong growth over the past decade.
  • 6.
    4 Telco 2015 Emerging market expansion has also begun to falter. From revenues, 1 percent of fixed telecom revenues and 1.5 percent 2005-2009, revenue growth from telecom services declined 14 of broadband revenues. Our most optimistic view forecasts percent in the Middle East and Africa, 11 percent in Latin IPTV revenues at US$17 billion and 6 percent of the pay- America, 8 percent in Brazil, Russia, India and China (BRIC), 4 television market in 2012. percent in North America and 1 percent in Europe (excluding Russia).10 In emerging markets, adoption of mobile messaging-based applications that leverage two-way/premium SMS is growing, The changing face of communication as well as Unstructured Supplementary Service Data (USSD), Over the past decade, Internet access and connectivity shifted to deliver public information and advisory services to rural from dial-up to broadband. Higher data speeds through Digital communities. These applications also allow mobile payments Subscriber Line (DSL), cable modem and fiber access tech- and money transfer services. They can also provide basic nologies enable users to communicate in more innovative ways. banking services in countries where such services are relatively Today, communications are fragmented across online services under-developed or unavailable. (VoIP, peer-to-peer, social networking, e-mail, instant messaging, blogs, forums, wikis and more) and telecom services The decoupling of traffic and revenue (fixed and mobile voice, SMS, MMS). While non-traditional One of the brightest spots in the industry toward the end of communication services in advanced markets have grown the decade was the phenomenal growth of mobile broadband, overall, outgoing call minutes from traditional telecoms have facilitated by the rollout of High Speed Packet Access (HSPA) remained relatively flat. In France, for example, the volume of networks. This growth helped mitigate declines in overall call minutes across fixed and mobile will increase by only 9 revenues in 2009, particularly in Europe and North America. percent from 2005 to 2010 – from nearly 190 billion minutes Driven in part by the increased penetration of smartphone to 207 billion. However, OTT communications over the same devices like the 3G Apple iPhone, High Speed Downlink period, including VoIP, peer-to-peer and instant messaging, Packet Access (HSDPA)-enabled USB keys or dongles for will increase by 211 percent, from 303 billion to 942 billion laptops/Netbooks, and other mobile Internet devices (MIDs), minutes.11 A challenge for the industry is to devise a way to mobile broadband growth is paving the way for a second wave better monetize this massive growth in over-the top services. of fixed-mobile substitution, but this time in data connectivity services. The challenge to monetize content Revenues from digital content services, such as Internet Protocol TV (IPTV) and mobile content (mobile video, mobile music, wireless games and mobile advertising) have not yet Much of the growth in overall communication compensated for the decline in traditional services. Our analysis shows that IPTV generated close to US$4 billion in volumes has come from OTT innovations, but 2008 revenues, representing only 0.5 percent of total mobile providers are struggling to monetize these using traditional models.
  • 7.
    IBM Global BusinessServices 5 Aggressive pricing and attractive packages, including “all-you- Traffic can-eat” bundles and simple pre-pay (or pay-as-you-go) Network cost (existing technologies) options – generally unavailable with fixed broadband – have Traffic Revenues helped accelerate consumer adoption and increase mobile volume/ Network cost broadband traffic. revenue (future technologies) Voice dominant Revenue and traffic decoupled The dramatic increase in application stores, following the success of Apple’s App Store, has reinvigorated the market for mobile applications. Just 18 months after its launch in July 2008, the number of App Store applications had surpassed Profitability 100,000 – with more than 3 billion downloads.12 At an average price per application of around US$2.50, the App Store model Data dominant is far from a significant source of revenue. But it is a powerful Time complement to drive Apple’s hardware revenues.13 Source: Nokia-Siemens; IBM Institute for Business Value analysis. Overall, global mobile data traffic has more than doubled since Figure 2: Revenue and traffic are disassociated in an increasingly 2008.14 With future growth forecast at 130 percent year-to- data-dominant world. year, capacity on current 3G networks is likely to be exhausted by 2013, increasing pressure on providers for additional The flight from the network investment in radio access and backhaul networks. As part of the effort to reduce capital costs, many telecom providers are turning to network outsourcing and infrastruc- Furthermore, with flat tariffs, costs no longer match revenues ture sharing, which are becoming mainstream even among for delivering an ever-increasing amount of data over a Tier-1 providers such as Vodafone. In early 2009, Vodafone network designed to support narrowband voice and light- UK signed a seven-year agreement for Ericsson to take over weight download, Web browsing and e-mail. Essentially, the maintenance and operational support of its second- and revenue and traffic volumes are disconnected as telecom third-generation radio access networks.15 France Telecom becomes more data/connectivity-centric. While the boom in Orange has outsourced the management of its networks in the demand for mobile broadband is welcome for an industry United Kingdom and Spain to Nokia Siemens Networks.16 looking for new sources of growth, based on the current Indeed the number of outsourcing deals in the industry rose revenue model of “all-you-can-eat” data plans, it is unsustain- from six in 2004 to nearly 90 in 2008.17 able long-term. Historically, traffic and revenue tracked along the same path. In the past ten years, however, they have After the unprecedented change that has swept through and diverged. The disassociation of these two is at the heart of the across the telecommunications industry in recent years, what Telco revenue model challenge (see Figure 2). evolution will transpire over the next five years?
  • 8.
    6 Telco 2015 Scenario envisioning for Forces driving telecommunications through 2015 telecommunications There are a number of forces and underlying trends in the Traditional approaches to predicting the future based on evolution of the communications industry for which there is a prefabricated world visions of economic and geopolitical trends high degree of consensus about their certainty (see Figure 3). are unsuitable for an industry changing as quickly as telecom- These provide a common backdrop for future scenario munications, the evolution of which has taken many unprec- envisioning. We’ve grouped these forces and trends into five edented turns over the past decade. Given the ongoing categories: uncertainties, a scenario-envisioning approach – one that enables industry executives to assess alternative contrasting 1. Usage – changes to user consumption patterns futures for the industry that are distinctly different from the 2. Services – changes in services composition present – is more appropriate. Our scenario envisioning 3. Access – device and network access technology evolution consists of an analysis of the following: 4. Business model – future revenue structure and sources 5. Industry structure and regulation – future of industry structure • Forces driving telecommunications through 2015 and regulation. • Critical (uncertain) variables – nascent technology, possible consumer responses to offerings not yet invented, potential Usage – Mobile and broadband have emerged as key staples, regulatory structure and possible competitive initiatives and consumers are unwilling to make drastic changes in their • Scenario realization triggers – economic, technology, use of communication and connectivity services, even in a time regulatory, market of economic uncertainty. Asked what they are least likely to • Scenario revenue and profitability outlooks. give up if the economy worsened, after their homes, respon- dents listed their mobile phones and broadband Internet access. The items ranked considerably ahead of family holidays, PayTV and going out (see Figure 4). • Ubiquitous, seamless open access becomes the norm • Communications fragmented across multiple tools • PSTN decline accelerates Usage Services • VOIP migration accelerates • Mobile and broadband are basic household staples • Increased use of data – both fixed and mobile. • Growth in shared communication capabilities. • Commitment to net neutrality remains Forces • Basic broadband pervasive as TV Industry • Battle for mobile broadband favors LTE • New local access competition rules with Next shaping the structure and Access • Proliferation in high-end devices (e.g., Generation Access future of regulation Smartphone, Netbook) • New broadband infrastructure competition will telecom emerge from industry (e.g., utilities, municipalities) • Market for ultra-low-cost handsets grows. • Fixed/mobile termination rates converge as barriers fade. • Revenue from environmental mitigation programs grow Business • Share of revenues from third-party connectivity grows model • Voice is monetized as a feature of connectivity. Source: IBM Institute for Business Value and IDATE analysis. Figure 3: A number of forces are shaping the future of the telecommunications industry.
  • 9.
    IBM Global BusinessServices 7 79% 5% 16% Home 51% 15% 34% Mobile phone 26% 27% 47% Broadband Internet access 26% 13% 61% Landline/fixed telephony 17% 15% 68% Family holiday Unlikely to give up 12% 18% 70% Going out (e.g., restaurants, bars, cinema) Neutral 12% 12% 76% Pay TV Likely to give up 11% 9% 79% Newspapers/magazines Source: IBM Institute for Business Value Global Telecom Consumer Survey, 2009; N= 7722. Figure 4: After their homes, consumers are least likely to give up mobile phones and broadband Internet access. Furthermore, while many consumers will make adjustments in Over the next five years, driven in large part by younger their use of communication services to control costs, only 23 consumers, communications will be fragmented across a percent of consumers expected an economic downturn to number of tools, from fixed and mobile voice and text significantly impact their use of such services. messaging, to online alternatives, including e-mail, VoIP, instant messaging and social networking (see Figure 5). Text/SMS 64% Landline/ fixed voice Instant 54% messaging 46% E-mail Mobile Social 74% voice networking 73% Frequency of use Postal 43% service 10% VoIP MMS 11% 9% Mobile e-mail (on smartphone) Voice 12% conferencing Video calls 5% 7% -15% -10% -5 0% 5% 10% 15% 20% 25% 30% 35% 40% 45% 50% Percent of customers (25 and younger) who expect to increase/decrease use of service Note: Size of bubble: Percent of respondents who expect to use service every day. Source: IBM Institute for Business Value Global Telecom Consumer Survey, 2009; N= 7722. Figure 5: OTT communication services are challenging Telco-controlled services, especially for people age 25 and under.
  • 10.
    8 Telco 2015 Between 2008 and 2013, Internet data traffic is expected to Services – Overall, PSTN circuit-switched lines will continue to quintuple, largely as a result of significant increases in the decline, although some emerging countries may notice consumption of Internet video.18 While in 2008 file sharing short-term growth in fixed lines as they “catch up” with the accounted for the majority of Internet traffic at 56 percent, this rest of the world. Increasingly, VoIP will replace fixed-voice will decline to 31 percent by 2013, with Internet video access lines in mature economies. Further, as penetration of replacing it as the largest contributor to online traffic at 46 mobile VoIP accelerates, the proportion of provider-managed percent.19 mobile VoIP will also increase. A previously skeptical industry will overcome fears of cannibalization and will begin to However, the largest growth area by far will be mobile transition from outright prohibition, through models imposing broadband, with a forecast CAGR of 130 percent from 2008 to surcharges and, finally, on to formal partnerships with over- 2013 as the penetration and use of Smartphones, MIDs, the-top providers like Skype. Mass migration to mobile VoIP, Netbooks and tablet devices increase (see Figure 6). however, is unlikely until HSPA and Long-Term Evolution (LTE) networks are deployed more widely to address known limitations around usability, availability and quality of service. Mobile Internet/data traffic (Petabytes/month) 2184 Middle East and Africa Shared capability services that enable interoperability across Latin America fragmented communication tools will become standard as Central and Eastern Europe several industry initiatives become a reality, like GSMA’s Rich Western Europe Communications Suite (RCS) and GoogleVoice, which enables Asia Pacific users to link all their phones together into one central commu- North America nications network. 130% 1076 Access – With forecasts of nearly 800 million fixed broadband CAGR subscribers and over one billion mobile broadband subscribers by 2015, basic broadband will be available to most households around the world, and levels of penetration will be similar to 483 television in advanced markets.20 207 85 The race for mobile broadband appears to have been decided 34 in favor of LTE – one of two broadband access technologies 2008 2009 2010 2011 2012 2013 telecom providers identified as critical to invest in over the next five to ten years (see Figure 7). In December 2009, Nordic Source: Cisco Visual Networking Index, June 2009, http://www.cisco.com/en/US/ solutions/collateral/ns341/ns525/ns537/ns705/ns827/white_paper_c11-481360.pdf; carrier TeliaSonera deployed what it claims are the world’s first IDATE, IBM institute for Business Value analysis. two commercial LTE networks, offering maximum throughput Figure 6: Use of video and other data services will grow as Internet data and mobile broadband consumption soar.
  • 11.
    IBM Global BusinessServices 9 Industry structure and regulation – Increasingly, the source of Critical access technologies for telecom providers 2010 - 2015 new infrastructure competition will be external: from govern- FTTx 71% 27% 2% ment, municipality, local housing associations and utility companies. In France, a law passed in 2004 allows local 4G/LTE 67% 33% authorities to act as telecom providers, and around half of the 3G 44% 48% 7% €2.1 billion invested in backhaul networks in sparsely xDSL 43% 48% 9% populated areas since then has come from public financing.23 CATV 27% 39% 34% All across Europe, municipalities – and even housing associa- tions – are investing in local access networks. By December 2G 20% 42% 38% 2009, nearly 60 percent of FTTH/B projects across Europe WiMAX 8% 38% 54% 11% 9% 23% were being led by municipalities, utilities or housing associa- Critical to success tions, with incumbent and alternative telecom providers Neutral accounting for the rest.24 For example, the city of Amsterdam, Source: IBM Telecom Executive Survey 2009. Not critical to success in partnership with two private investors and five housing associations, has invested €18 million in building a fiber-to- Figure 7: The race for mobile broadband appears to have been decided in favor of LTE. the-home broadband access network to initially connect nearly 40,000 households.25 speeds of 20-80 Mbps.21 A number of major providers, In developed markets, both mobile and fixed termination rates including Verizon, KPN, NTT Docomo, AT&T, France will continue to decrease. The EU’s long-term vision is to Telecom/Orange, Telstra, Vodafone, Telus and Rogers, have reduce mobile termination rates (MTR) in member states to announced early commercial deployment plans for LTE. levels comparable to fixed termination. At the same time, the Global subscribers are expected to reach nearly 400 million by boundaries defined by access (i.e., fixed, mobile, cable, Internet) 2015.22 will fade as an increasing number of players offer a combina- tion of products. Business model – Over the forecast period, fixed voice communi- cations will increasingly be monetized largely as features of Existing remedies for enforcing local access competition will broader connectivity packages, rather than as standalone be replaced with the deployment of next generation access services. Providers will seek new revenues by providing open (NGA). wholesale interfaces to drive innovation on their networks. As environmental sensitivities progress, the “green” practices of telecom providers will become sources of revenues as they help companies in other industries reduce their CO2 emissions through new services such as mobile virtual private networks, The race for mobile broadband appears to have video and teleconferencing capabilities and machine-to- been decided in favor of LTE. machine communications.
  • 12.
    10 Telco 2015 Critical (uncertain) variables • Premium connectivity: What is the opportunity for premium In addition to the trends we’ve outlined, a number of poten- connectivity features (e.g., guaranteed low latency, security, or tially high-impact variables exist with outcomes that are, as yet, a more robust content delivery network)? Will increased uncertain. From these, we have selected 13 whose contrasting available bandwidth to third-party solution providers reduce outcomes signal distinctly different scenarios for the future. the need for premium features? These variables are placed in context with the industry trends previously described: Access • Ultra-fast broadband availability: Deployment of ultra-fast Usage: broadband networks requires high levels of investment. • The future of voice: Will voice communication volumes Taking into account their commercial viability and the continue to decline, substituted by asynchronous and/or regulatory environment, how much coverage can be online data communications (e.g., SMS, social networking, effectively achieved over the next five to ten years? instant messaging, IP voice), or will drastic price cuts, superior • Open versus closed devices: Will providers continue to subsidize convenience, and new voice usage applications (e.g., human- handsets, or will unlocked and open devices prevail? Will a to-machine voice communications, high-definition voice) standard open device platform emerge, or will the industry trigger a voice “rebirth?” continue to support competing device platforms, including • OTT versus network-optimized content: How will the battle be Apple, Symbian, Google Android, Windows and Palm OS. waged with over-the-top providers? Can telecom providers deliver and monetize unrivalled user experiences through Business model network-optimized features (e.g., multi-sensorial, 3-D, • User-funded versus third-party funded: Will user-funded immersive reality) to derive value alongside over-the-top (subscription) revenues continue to dominate, or will Telco be (OTT) providers? able to gain significant revenues from third parties, such as • Siloed versus unified communications: Will consumers finally advertisers, in a two-sided business model? Can providers make the leap to embrace unified communications across adequately and legally monetize subscriber information (e.g., fixed, mobile and online, or will shared capabilities across socio-demographic, presence, preferences)? stand-alone fragmented communication tools be a sufficient • Service pricing models – voice and connectivity: What will be the trade-off between simplicity and freedom of choice? predominant service pricing models? Single-service metered? Monolithic bundles structured for key subscriber segments? Services Abundant (all-you-can-eat) pricing for connectivity and voice? • New verticals: What is the opportunity for telecom in industry Differentiated tiered pricing based on quality/speed? Will verticals such as healthcare, smart grids and financial services providers be able to generate premium prices for ultra-fast beyond basic connectivity? What form is this likely to take, broadband (FTTH and LTE) compared to current broadband and can Telcos beneficially enhance the vision of an services? increasingly instrumented, interconnected and intelligent world to create value?
  • 13.
    IBM Global BusinessServices 11 • Machine-to-machine (M2M): Will provider revenues continue Four industry scenarios for Telco 2015 to be based primarily on maintaining high ARPU across a These variables can be grouped into two industry dimensions finite number of accesses, or on ramping up M2M services – addressable market growth and competition/integration based on an infinite number of connected objects? structure – as shown in Figure 8. Industry structure and regulation Addressable market growth: This covers all the variables related • ServCo/NetCo versus vertical integration: Will the industry be to future sources of revenue growth. Will there be a rebirth of organized by separate service companies and network the blockbuster revenue generator of voice, or is this destined companies, or will vertically integrated providers prove to be to be replaced by content, broadband connectivity and new the only viable model to generate sufficient shareholder value? service areas in selected industry verticals? Will communica- • Network sharing versus outsourcing: Will passive infrastructure tions fragmentation dissipate value, or create new opportuni- sharing become the norm? Will providers go beyond passive ties with increased demand for shared capabilities? infrastructure sharing and share the active network, too? Will network outsourcing become the norm? • Regulation: What will be regulators’ goals over the next five-to-ten years, and how will they impact the industry’s Competition/ integration business models? After two decades of liberalization of Addressable structure telecom markets around the world, is competition self- market growth Open versus sustaining, making ex-ante provisions dispensable? Or will new closed devices The future of networks, market consolidation and new business models voice Premium Network sharing require the (re-)introduction of a number of ex-ante remedies. connectivity versus What is the future of net neutrality? The industry appears Silo versus outsourcing unified divided over its long-term future. Nearly half of our communications Service pricing Vertical versus respondents expect regulators to sustain the commitment to model horizontal OTT versus integration neutrality over the next five-to-ten years. But over 40 percent network- anticipate the commitment will be abandoned or relaxed to optimized content Machine-to- User versus machine (M2M) third-party/ stimulate investment that improves customer experience/ Expansion into communications ad-funded quality of service.26 adjacent verticals Regulation Ultra-fast broadband availability Source: IBM Institute for Business Value and IDATE analysis. Figure 8: Variables that may shape the future of telecommunications can be grouped within two industry dimensions.
  • 14.
    12 Telco 2015 Competition/integration structure encompasses uncertainties The interplay between the dimensions of addressable market around industry integration and open versus closed connec- growth and competition/integration structure produces four tivity models. As regulatory change and technology develop- equally likely but contrasting future scenarios (see Figure 9). ments lower entry barriers for new entrants to deliver innova- tive services, will the service structure be based predominantly It is important to note that these scenarios are potential on packaged end-to-end delivery or open access platforms with outcomes for markets at national or regional levels and not a multiple service providers? Will the vertically integrated model set of strategic choices to be made by individual telecom survive as providers increasingly share infrastructure and providers. The purpose of the scenario-envisioning process is outsource significant parts of their business, including not to rank the probability of individual scenarios or attempt to networks, to external providers? Will demand for new service make predictions, but to provide a framework to enable combinations impel infrastructure providers to open up their executives to assess what it would be like to operate in each networks and enable third-party providers to leverage capabili- potential scenario and to build capabilities for success for ties to deliver new experiences? Is the fragmentation of the whichever scenario prevails over the next five to ten years. industry – with independent national and regional providers – sustainable when the main competitive threats are expected to Table 1 (see page 14) describes contrasting outcomes for be from global over-the-top communications providers? uncertain variables and sets out plausible consumer behaviors How will future regulation impact industry structure and and industry/market dynamics for each scenario. competition? Expanding Clash of Giants Generative Bazaar Addressable market growth Results from carrier cooperation and alliances (such as RCS) that pave Pervasive, affordable, open connectivity is enabled for a person, the way for global consolidation in response to increased competitive device or object, unleashing a wave of generative innovation. A threats from over-the-top providers. Mega carriers expand markets co-operative of horizontally integrated network infrastructure providers through selected verticals such as smart grid and e-health for which (Net Co-op) emerges, based on catering to the needs of a multitude of they provide packaged end-to-end solutions. asset-light service providers that package connectivity with completely new services and revenue models. Survivor Consolidation Market Shakeout Declining/stagnant Occurs as a result of reduced consumer spending, leading to revenue Likely when CSPs expand horizontally in search of growth through stagnation or decline. Investor loss of confidence in the telecoms sector premium connectivity services sold to application and content providers, produces a cash crisis and triggers survival consolidation. and device OEMs. The vertical integration model is disaggregated and the industry fragments as governments, municipalities, etc., expand ultra-fast broadband to under-invested areas. Concentrated/vertical Competition/integration structure Fragmented/horizontal Source: IBM Institute for Business Value analysis. Figure 9: Four contrasting scenarios are possible, depending upon the interplay of trends and variables.
  • 15.
    IBM Global BusinessServices 13 Scenario realization triggers – economic, technology, regulatory, market Each of the four scenarios described is triggered by a distinct Each scenario is triggered by a combination of combination of factors across several dimensions: economic/ factors across several dimensions. financial, technological/investment, regulatory/competition and marketplace/customer-related. Survivor Consolidation is likely to be triggered by a prolonged global or local economic downturn that causes consumers to Clash of Giants is triggered by the determination of telecom cut back spending, leading to intense price competition. providers to take on Internet communication providers, Constrained access to and high cost of capital leads to reduced identified by 76 percent of telecom executives as the greatest investment. competitive threat to their businesses over the next five to ten years – well ahead of traditional cable and content providers. In Alternatively, a prolonged economic downturn may invoke a an industry essentially fragmented by geography and national different response from telecom providers, investors and regulations, the ability of Telcos to engage global OTT governments that leads to a different outcome – the Market providers that are relatively unencumbered in their reach will Shakeout. Private equity investors may acquire ailing telecom require global alliances, cooperation and standardization of the providers and break them up. A shakeout may also be triggered kind the GSMA is leading for rich communication services by increased fragmentation resulting from greater involvement (RCS), the OneAPI global applications platform and Voice and investment by governments, municipalities and infrastruc- over LTE (VoLTE), among others. ture players like utilities. The GSMA’s RCS initiative, for example, will enable Smaller or emerging providers may be compelled by circum- subscribers of telecom providers to exchange rich multimedia, stances to outsource more of their networks, and the industry such as video and photos, during a call, and will facilitate may end up with the majority of its network infrastructure run shared capabilities, including a common personal address book by equipment suppliers. Telecom providers may further augmented with real-time presence across providers, devices outsource other assets, including their business process support and networks.27 infrastructure, and divest others, like their retail store networks. The business of telecommunications could be driven In response to the success of mobile application stores driven by established retail brands with first-class sourcing, supply by the likes of Apple, 24 of the world’s largest mobile providers chain and customer management capabilities. teamed together in February 2010 to announce an initiative to collaborate on a wholesale platform for mobile applications with a single point of entry for developers.28 Forty organiza- tions in total within the telecom industry are supporting the One Voice initiative.29 Based on current open standards, this initiative defines the minimum mandatory functionality for interoperable IMS-based voice and SMS over LTE, which is needed to drive the global mobile industry toward a standard for delivering voice (and messaging) services for LTE (VoLTE).
  • 16.
    14 Telco 2015 Survivor Consolidation Market Shakeout Usage  Communications are“siloed” and fragmented  Communications are “siloed” and fragmented from a wide range of  Connectivity is personal and asymmetric, with more download than suppliers and aggregators. Consumers opt for over-the-top and user- upload generated content  Passive content consumption remains strong. In emerging economies  emerging markets, mobile money paves the way for other simple In communication remains voice-centric on mobile; Internet and data usage data applications catering to specific local market needs. is limited to large cities with sufficient data networks, but deployment of basic mobile data services, (e.g., mobile money, information advisory services) meets with success. Services  Services remain as today as Telcos fail to enter new industry verticals  There is greater focus on wholesale backbone business as well as and/or expand horizontally Information, Communication and Technology (ICT) services  Packaged connectivity and communications services prevail.  Telcos expand horizontally to offer premium connectivity services that enable content/application providers to offer OTT content services with adequate quality of service (QoS) and service level agreements (SLAs)  Emerging market providers focus on growing mobile data usage. Access  Ultra broadband availability is limited to 10-15 percent of households,  Government, municipality and alternative provider (e.g., local housing primarily in economically profitable, densely populated areas associations, utilities) initiatives increase ultra-fast broadband  smaller providers, active network outsourcing to NEPs and passive For household coverage to 20-25 percent in advanced markets sharing with one another is sustained for FTTx and LTE  Passive infrastructure sharing becomes the norm for most providers  Handset subsidies remain and telecom networks remain closed to for FTTx deployment and for 2G/3G mobile infrastructure optimization unapproved devices, third-party providers or applications/services.  Low-end, SIM-only, open devices co-exist with high-end devices, based on exclusivity periods and strategic partnerships with OEMs. Business  User-funded subscription revenues dominate and still rely upon  Multiple tariff packages, including metered and bundled, that appeal model maintaining high ARPU across limited number of accesses to different segments are supplied under a variety of market brands  Retail-driven with multiple tariff packages, including metered and bundled  Predominantly subscription-based but driven in part by wholesale, for different segments with an emphasis on cost control as devices, application and content providers leverage premium  Content market of limited value. Service providers absorb network costs connectivity from increased OTT content consumption or pass connectivity costs to  Ultra-fast broadband (FTTH and LTE) offers are priced at levels users. comparable to broadband connectivity, encouraging rapid migration  Open access models financed by government/municipalities in gray/ sparsely populated areas. Industry  Consolidation of declining private-sector players in advanced markets;  Some Tier-2 providers divest network and assets to focus on structure competition typically revolves around a limited number of large integrated customers and brand players as fixed and mobile pure-plays disappear  Multiple service provider brands emerge to package low-cost, no frills  emerging markets, a duopoly of mobile service providers is the norm In services targeted at specific consumer segments  Large mobile-centric providers from BRIC successfully gain footholds  Major device manufacturers provide communications services as across emerging regions (e.g., Africa), replicating their low-cost models. MVNOs in major markets  handful of NEPs manage networks for a significant percentage A (more than half) of global telecom providers. Regulation  is, with ongoing uncertainty As  Strong access obligations on infrastructure and strong net neutrality  NGA investment is stifled by very restrictive regulation or uncertainty stance undermine investment incentives  Providers reduce rollout speed and geographic coverage of NGA.  Local not-for profit network initiatives and governments/municipalities provide open access. Source: IBM Institute for Business Value analysis. Table 1: Characteristics of each of the four possible telecommunications scenarios.
  • 17.
    IBM Global BusinessServices 15 Clash of Giants Generative Bazaar  Users adopt shared capabilities (e.g., presence, contact list) and enhanced rich  Advanced users mix and match communication tools; most adopt open shared multimedia communication booms capabilities (e.g., presence, contact list) across voice and online communication.  significant portion of consumers purchase packaged digital content and A Enhanced, rich multi-media communication is the norm in advanced markets lifestyle services (e.g., healthcare, payments, security, energy management)  Usage extended to any object for personal and professional use by individuals and from providers third parties  Voice services dominate in emerging markets and extend to the remaining  Seamless and ubiquitous access across devices and networks. population at the base of the pyramid.  Providers gain sizeable commercial traction for packaged end-to-end solutions  Open approach triggers new connectivity needs for OTT providers delivering for strategic verticals. Some premium network-optimized entertainment industry-specific solutions (e.g., wellness and smart grid services) but no end-to-end services (e.g., multi-sensorial, 3-D, immersive reality) gain commercial success packaged Telco “vertical” offering  Shared communications capability (e.g., RCS) becomes standard feature  Premium connectivity (e.g., guaranteed low latency, security, CDN) for OTT providers offering.  Local applications that meet emerging market specificities boom  Voice HD  Shared communications capabilities  Large-scale machine-to-machine communications.  Next generation access infrastructure sharing extends coverage to 40-50  Widespread fixed and/or mobile ultra-broadband availability, with coverage of 50 - 60 percent of households percent of households  Providers enter strategic partnerships with selected device manufacturers for  Open devices (e.g., unlocked phones, Netbooks) dominate market as providers customized devices with support for proprietary service, network and platform retreat from handset subsidization features.  Open and standardized device platforms supported by Net Co-ops and device manufacturers.  Voice communication services are free for users who pay for shared  Voice services continue to be paid-for on mobile, but fixed communications become capabilities an embedded feature of connectivity  Retail dominated, based on customer ownership and delivery of end-to-end  Wholesale-driven with premium connectivity a key feature for revenue generation. targeted services and experiences based on network and customer insights Providers are able to generate premium prices for ultra broadband (FTTx, LTE)  New revenues from packaged end-to-end digital content and lifestyle services  OTTs collaborate with network providers and pay carriage fees or share revenues in  Emerging market providers focus on optimizing their asset utilization by return for network-optimized delivery to enhance end-user experience growing voice revenues through more users at the base of the pyramid.  Providers ramp up M2M to generate low ARPU for an infinite number of connected objects  Co-ops supply analytics to service providers for platform advertising and Net improved customer experience.  Active global industry alliances and standards, some of which pave the way for  co-operative of infrastructure providers support a myriad of asset-light service A global provider consolidation providers such as VNOs, OTTs, banks, utilities, governments, etc.  European and North American providers consolidate at regional level (e.g., two  Vertically integrated models replaced by horizontal model with NetCo/ServCo or three pan-European providers) separation  OTT players integrate backwards and build out own fixed networks in selected  Passive infrastructure sharing, but no network outsourcing. geographies. Others are successful in bidding and acquiring spectrum for mobile  Some emerging market providers enter mature markets.  Light-touch regulation on infrastructure to encourage infrastructure competition  Evolution to Internet-style model with light-touch regulation for Telcos  endorsement by regulator of strong net neutrality positions No  Abolition of the majority of sector-specific services regulations, creating a level  Telcos develop a portfolio of premium services (e.g., 3-D TV) but have to carry playing field in services for Internet and Telco players competing OTT services.  Structural separation of access networks with wholesale open access to best-in- class services and applications from any provider  Open access is the norm.
  • 18.
    16 Telco 2015 Other events that may trigger a Clash of Giants scenario Scenario revenue and profitability outlooks include integration of OTT players into the network. Eric The 2015 scenarios each have different revenue profiles and Schmidt, CEO of Google, announced in February 2010 that include varying levels of contributions to the overall mix from Google will be building an ultra-high speed optical network communications (voice and basic data), connectivity with speeds of 1 Gbps to connect up to 500,000 consumers in (broadband, legacy and enterprise) and digital media/content. the United States, enabling them to download a high-defini- We have designed a revenue and profitability model for each tion movie in less than five minutes, or watch live 3-D video scenario based on assumptions of penetration and ARPU services.30 growth for fixed voice, mobile voice and data (SMS), VoIP/ VoBB, fixed broadband (including dial-up), mobile Internet Generative Bazaar is predicated on the break-up of the vertical and broadband, machine–to-machine connectivity, IPTV and integration model, resulting in some form of structural mobile content services. separation of Telcos into distinct network (NetCo) and services (ServCo) businesses. It is unlikely that there will be many In a Survivor Consolidation scenario, fixed-mobile substitution competing NetCos in any one country, but rather a handful of accelerates, mobile penetration slows and ARPU declines as providers that will form a co-operative (Net Co-op). This consumers move to control spending on telecom services and/ co-operative will be based on a viable funding model to or turn to VoIP/VoBB alternatives. Despite the downturn, fixed support open access infrastructure (see Appendix 2 for and mobile broadband penetration increases modestly as examples of emerging net co-op models). providers offer competitive “all-you-can-eat” bundles and users opt for free OTT services. Paid content services, however, The Net Co-op may also emerge through the deliberate decline. intervention of national governments, as currently exemplified in Australia and Singapore, or through voluntary cooperation As governments and municipalities participate more actively in of infrastructure providers such as in the Netherlands (see extending ultra-fast broadband capabilities and fixed connec- Appendix 2, page 22). Generative Bazaar depends on wide- tivity penetration, this potentially triggers a Market Shakeout spread deployment of ultra-fast broadband and the availability scenario. Overall ARPU declines sharply, but premium of connectivity with pervasive and ubiquitous access supporting connectivity services enable OEMs and content providers to the proliferation of Smartphones, Netbooks, MIDs and large bundle content or device-centric applications with connec- volumes of other connected devices. This would serve to tivity. accelerate the explosion of new services and applications emerging to support the increasingly digital economy and In Clash of Giants, while fixed voice penetration continues to personal lifestyles. decline, overall voice revenue erosion is contained as consumers increasingly adopt and pay for end-to-end packaged services and enhanced rich communication capabilities. Consumers come to accept network-optimized vertical industry applications and digital lifestyle services from telecom providers. Providers in emerging markets are successful in extending communications to many more people as ultra-low- cost handset penetration increases.
  • 19.
    IBM Global BusinessServices 17 PSTN line losses accelerate sharply, along with significant decreases in ARPU as providers migrate consumers to Global GDP versus telecom growth scenarios managed VoIP offerings in a Generative Bazaar scenario. VoIP/ 7% VoBB use is widespread as connectivity becomes part of the Global telecom fabric of society and is bundled with all broadband/connec- 6% Generative Bazaar 5.3% tivity packages. Users pay only for communications aggrega- 5% 4.5% tion and shared capability services across multiple tools. Growth Phenomenal growth in mobile broadband continues, and 4% Clash of Giants 3.3% nearly all mobile users in advanced markets have data connec- 3% Global GDP tivity plans across multiple devices. In emerging markets, Market Shakeout 1.8% 2% mobile broadband is the de facto Internet platform as mobile devices become the users’ portable digital identity. OTT video, 1% applications, services and digital content services boom as a Survivor Consolidation 0.2% 0% result of open access infrastructure. There is also a significant ‘05 ‘06 ‘07 ‘08 ‘09 ‘10 ‘11 ‘12 ‘13 ‘14 ramp-up in the penetration of M2M services as low tariff Source: International Monetary Fund (IMF), World Economic Outlook Database, October 2009, packages enable profitable network connectivity of objects and http://imf.org/external/pubs/ft/weo/2009/01/weodata/index.aspx; IBM Institute for Business Value and IDATE analysis; 2004 - 2009 growth forecasts are based on IDATE “World Telecom sensors. Service Market,” 2008 Edition, January 2009, revision in July 2009; forecasts for. 2010 -2015 are IBM Telecom 2015 scenario forecasts. Regardless of which scenario dominates, PSTN revenues Figure 10: Generative Bazaar represents the most optimistic growth decline. Likewise, fixed and mobile connectivity/broadband outlook. revenues increase in all scenarios. Overall, the financial model suggests Generative Bazaar is potentially the most profitable, A critical potential industry shift is the overall composition of with the highest revenue and growth prospects. However, it is the telecom revenue mix as the once-dominant PSTN voice also the most challenging scenario because of the dramatic business disappears and mobile revenue growth stalls. In 2008, degree of change it will demand from the industry. Clash of the proportion of total industry revenue in advanced markets Giants may, indeed, be more a plausible and natural evolution attributed to communications (PSTN Voice, VoIP/VoBB, in a recovering/slower-growing economy, even if revenue and Mobile Voice and SMS) was approximately 75 percent, versus profitability potential is less than in Generative Bazaar (see 24 percent for connectivity (fixed broadband, dial-up Internet, Figure 10). legacy corporate data services, mobile broadband and machine- to-machine revenues) and 1 percent for content.31 With the growth in broadband and the slowdown of communications revenues, this split is likely to shift, with a greater share going to connectivity. The most promising scenario will require a fundamental change in industry structure and result in a shift in revenue mix, with connectivity supplanting communication services as the dominant contributor.
  • 20.
    18 Telco 2015 The four scenarios show contrasting revenue composition Critical success attributes and imperatives outcomes (see Figure 11). Survivor Consolidation and Clash of The scenarios should not be treated as strategic aspirations or Giants retain the current revenue mix structure, even as their choices by any specific provider. They are significantly influ- share of connectivity increases. In Market Shakeout, parity enced by a number of highly dynamic external factors, exists between communications and connectivity in the overall including government policy, regulation, technology evolution, revenue composition. However, Generative Bazaar reflects a industry dynamics and the state of the local/global economy. model that is opposite the dominant model of today. Connec- Collectively, industry players in specific markets or regions can tivity revenue becomes most prevalent in the mix. PSTN voice shape and influence these outcomes, but the imperative is for declines, and fixed voice communication is offered virtually for telecom providers to focus on the attributes for success for the free as a standard service in mobile and fixed broadband scenario most likely to emerge, and to begin to take action now packages. The demand for access grows, fueled by the prolif- to best position themselves for the future. eration of smart devices, including machine-to-machine connectivity supporting growth in sensing and automated response capabilities. 69% 49% 64% 35% 75% Communications 60% PSTN voice, VoIP/ VoBB, mobile 49% voice, SMS revenues 2015 30% 31% Connectivity Developed Fixed broadband, dial-up markets Internet, legacy corporate data 1% 2% 5% 5% service, 3G/mobile broadband and machine-to-machine Survivor Market Clash of Generative revenues Consolidation Shakeout Giants Bazaar Content 85% 80% 81% 63% IPTV and mobile content (music, 24% video, mobile TV, games, advertising) 1% 2008 2015 34% Emerging 14% 20% 18% markets 3% 1% 0% 1% Source: IBM Institute for Business Value and IDATE analysis. Figure 11: Although revenues shift from communications to connectivity in all four scenarios, the substitution is highest by far in the Generative Bazaar.
  • 21.
    IBM Global BusinessServices 19 To be successful in a Survivor Consolidation scenario, telecom Summary and conclusions providers will have to achieve scale, reduce cost-to-serve, After a decade of unprecedented change, where the phenom- contain voice ARPU erosion, secure a significant proportion of enal growth of mobile telephony has given rise to an era in the ultra-fast broadband market and increase share of high- which anyone who wants – and can afford – telephony has it, value customers. the industry is at an inflection point as it postures itself for future growth . . . or survival. Unless the telecom industry is In a Market Shakeout scenario, successful telecom providers able to reinvent itself as it did with mobile telecommunications will be those that have clear and distinctive roles in a frag- in the 1990s, the next few years could usher in a period of flat/ mented and horizontally integrated industry; a powerful brand/ declining growth as opportunities for industry growth based on reputation; viable premium connectivity propositions for increasing customer penetration gradually diminish. third-party application providers; agile, flexible and reconfigu- Continuing along this path favors the emergence of a Survivor rable processes and infrastructure; and the ability to provide Consolidation or Market Shakeout scenario, both of which are ubiquitous and cost-effective ultra-fast broadband access. likely to yield very low levels of growth. The providers likely to be successful in the Clash of Giants A return to strong growth requires the telecom industry to act scenario will include those with the ability to effect collabora- collectively to create the necessary conditions for the tive inter- and intra-industry alliances; deliver innovative and emergence of the more profitable scenarios, Clash of Giants or differentiated network-optimized experiences based on Generative Bazaar. They can do so by focusing their strategic end-to-end packages; and enhance the role of service providers priorities on those capabilities required to deliver on the in adjacent vertical markets to achieve competitive cost critical success attributes for these growth scenarios, including: structures and scale. • Global industry collaboration on common capabilities, Success in the Generative Bazaar scenario will be dependent enablers and platforms to facilitate innovation and improve on the provider’s ability to achieve structural industry separa- competitiveness with global OTT providers tion; a pervasive open network access infrastructure; support • Enhancing the role of the service provider to enable new for third-party application/services innovation; a dynamic business models in adjacent vertical markets such as e-health, business design; and the ability to leverage advanced customer smart grids, transportation, retail and banking and network analytics. • Pervasive and open access connectivity for any person, object and a multitude of devices, optimized to deliver large data For a more detailed view on the capabilities required to volumes cost-effectively successfully achieve the attributes for each scenario, please reference Appendix 3 on page 23.
  • 22.
    20 Telco 2015 • Value propositions for third-party application and asset-light To be ready, providers will need to watch for the key scenario service providers with a range of coarse to granular wholesale triggers we’ve described, understand the requirements for connectivity offers, open interfaces to network capabilities and success in each of these contrasting environments, begin to services enablers, and infrastructure support for common address execution gaps and nurture critical capabilities that are business process services (e.g., billing, CRM), along with a common across all four scenarios. These include a cost-effec- viable commercial model tive ultra-fast broadband deployment strategy, business • Harnessing information and business insights to reduce optimization based on more advanced network and customer complexity and costs and to deliver new customer experiences insights, more effective cost management and embracing a that enable new business models. highly collaborative culture.
  • 23.
    IBM Global BusinessServices 21 Appendix 1 Scenario realization: Major prerequisite economic, regulatory and market triggers for each scenario Economic and financial Investment and technology Competition and regulation Customers and markets Survivor Prolonged economic  Constrained access to, or  Increased price competition  Stagnating penetration at or near  Consolidation downturn increased cost of, capital High wholesale and interconnect  current levels Declining/flat revenues/  Reduced/flat capex  charges Inability to monetize value-added  margins Reduced investment in service  Governments foster favorable M&A  services Investor loss of  innovation and research. climate Consumers reduce spending  confidence. Some under-performing providers  Consumers switch to lower cost  hand back licenses. alternatives. Market Prolonged economic  Governments/municipalities  Increased network outsourcing and  Proliferation of brands emerge to  Shakeout downturn increase network infrastructure infrastructure sharing target specific segments/services Declining/flat revenues  investments Voluntary/forced separation  Stagnating penetration at or near  Industry EBITDA  Private sector capex constrained  Viable B2B market for premium  current levels consistently performs Private equity enters and  connectivity services emerges Consumers reduce spending  below historic levels. acquires under-performers and Telcos outsource other parts of  Consumers switch to lower-cost  breaks them apart. business – e.g., support, retail , IT, etc. alternatives. Governments take over infrastructure  of ailing incumbents. Clash of Growing, vibrant global  Unencumbered access to and  Global telecom consolidation  Greater willingness of  Giants economy lower cost of capital OTT provider consolidation with a  customers to purchase digital Increased consumer  Increased capital expenditure  small number of significant global lifestyle services (e.g., energy confidence and spending Global telecom technology  players management, e-health) from on communications alliances and standardization Some emerging market providers  Telcos Vertically integrated Telcos  OTTs integrate backwards into  enter advanced markets End-to-end customer experience  deliver superior returns the network with their own OTT actions pose significant  and QoS are a key differentiator and shareholder value. spectrum and infrastructure competitive threat to Telcos. Customers expect ubiquitous,  Providers invest in selected  seamless access and rich verticals. multimedia communication interactions. Generative Increased investor  Unencumbered access to and  Providers devise funding model for  Increasingly, organizations  Bazaar confidence in Telco two- lower cost of capital open access infrastructure market package connectivity with their sided business model Increased capex  National governments fund open  own services Growing, vibrant global  Widespread deployment of ultra-  infrastructure for economic growth Proliferation of MIDs  economy fast broadband Infrastructure to services-based  Smartphones, Netbooks and Increased consumer  Investment in developer  competition and regulation connected devices confidence and spending platforms, tools, communities. Asset-light providers emerge to  Consumers demand access to  on communications. innovate on open infrastructure. services from multiple providers. Source: IBM Institute for Business Value analysis. Table 2: Major prerequisite economic, regulatory and market triggers for each scenario.
  • 24.
    22 Telco 2015 Appendix 2 Emerging net co-op models Open access net co-ops Creation of Net Co-ops, aimed at providing national or local owned by the state (51 percent) and the private sector (49 open access network infrastructures, are already under percent) – in order to build and operate a fiber-to-the-home way. network that provides broadband to 90 percent of urban and regional towns at speeds of 100 Mbps.34 Next genera- In the Netherlands, KPN has announced a plan to “roll out tion wireless and satellite will be employed to cover the re- its next generation network based on an open access maining 10 percent. NBN will operate the network on a model, using a joint venture to spread the risk and sepa- wholesale only basis, with no role in retail services direct to rate the functions of wholesale access for providers from consumers, and will provide rights of access to all service retail sales direct to consumers.”32 The other members of providers on non-discriminatory terms and conditions. the consortium are Tele2-Versatel, BBned and Orange NL (now Online.NL).33 KPN has memoranda of understanding In Singapore, the government is rolling out the open access in place with each company on the terms of next genera- Next Generation National Broadband Network (Next Gen tion roll out and sharing of facilities. NBN) that will offer pervasive ultra-high speed connectivity by 2015, supporting a range of new and exciting Next Gen Australia and Singapore offer an alternative government-led Services such as high-definition video conferencing, tele- model. In April 2009, the Australian government launched a medicine, Grid Computing-on-Demand, security and im- National Broadband Network (NBN) company – jointly mersive learning applications.35
  • 25.
    IBM Global BusinessServices 23 Appendix 3 Critical success attributes and capability implications A-3.1 Survivor Consolidation Critical success attributes IBM recommendations Achieve scale  Deploy standardized processes and technology platforms for rapid and seamless M&A integration  Leverage dynamic infrastructures, global resources, “centers of excellence,” and standardized and automated processes for scale  Institutionalize processes to identify acquisition targets, conduct due diligence and close M&A transactions. Reduce cost-to-serve  Explore selective use of network outsourcing and infrastructure sharing  Accelerate migration to converged/single core IP-based NGN  Optimize and consolidate IT infrastructure  Leverage global resources, “centers of excellence” and business process outsourcing (BPO) as necessary  Simplify and automate business processes and transition to self-service. Contain voice ARPU  Bundle basic communication services with access/value-added services erosion  Enable access to widest range of communication tools/channels and facilitate integration of lower-cost/free alternatives with subscribed services  Acquire/partner with mobile, OTT communications, fixed or broadband provider to plug capability gap in communications portfolio  Leverage customer insights for cross-/up-sells. Secure significant share  Acquire/partner with incumbent local network infrastructure organizations to accelerate the deployment of ultra- of ultra-fast broadband in fast broadband access in densely populated areas densely populated areas  Passive infrastructure sharing, including underground ducts. Increased share of high  Leverage network insight into customer experience to deliver personalized experiences and services value customers  Apply social network analytics to enable automated identification of group leaders for focused retention and attraction (churn management) actions  Develop end-to-end visibility of high value customers for focused retention and attraction (churn management) actions.
  • 26.
    24 Telco 2015 Appendix 3 Critical success attributes and capability implications A-3.2 Market Shakeout Critical success attributes IBM recommendations Clear and distinctive role(s)  Identify strategic areas of focus in fragmented/disaggregated industry value chain aligned with core capabilities in disaggregated value  Build collaborative relationships with key external partners for open innovation chain and ability to partner  Define and implement common standards, processes and platforms to support external collaboration. externally Powerful brand/reputation  Leverage insights across the customer lifecycle to enhance the end-to-end customer experience  Deliver differentiated and personalized experiences  Proactively monitor and track actual experience delivered with the capability to adjust in realtime. Viable premium  Enable open and standardized access to premium connectivity (e.g., device management, CDNs) and service connectivity propositions enablers (e.g., presence, location) for third-party application  Integrate partner services/offerings with providers’ retail channel and application stores providers  Develop platforms and tools for information sharing with partners (e.g., device OEMs and application and content providers). Agile, flexible and  Implement standardized processes based on dynamic infrastructures to optimize business flexibility reconfigurable processes  Leverage global resources and “centers of excellence” to optimize capability and infrastructure  Leverage dynamic architectures and cloud-based infrastructure to optimize costs. Ubiquitous and cost-  Deploy standardized processes and technology platforms for rapid and seamless M&A integration effective ultra-fast  Leverage dynamic infrastructures, global resources, “centers of excellence,” and standardized and automated broadband access processes for scale  Institutionalize processes to identify acquisition targets, conduct due diligence and close M&A transactions.
  • 27.
    IBM Global BusinessServices 25 Appendix 3 Critical success attributes A-3.3 Clash of Giants Critical success attribute IBM recommendations Collaborative inter/intra-  Adopt and implement global standards for service interoperability across fixed and mobile Internet industry alliances  Develop and implement global standards for application/service roaming  Global collaboration in service innovation and development. Innovative and  Invest in service innovations based on tightly coupled intelligent network capabilities and content services to differentiated network- deliver new, unrivalled experiences optimized experiences  Speed time-to-market through greater experimentation and collaboration  Leverage insights across the customer lifecycle to enhance and deliver differentiated end-to-end customer experience. Enhanced service provider  Clarify role in selected verticals and develop capabilities and domain expertise through acquisition, or partner to roles in vertical markets deliver solutions  Deliver customer experience consistent with service level expectations along with requisite sales support organization/infrastructure for verticals  Collaborate with partners in the ecosystem in defining new and common standards for telecom-enabled vertical services (e.g., mobile payments). Efficient and competitive  Unified support infrastructure for end-to-end service management across all platforms and devices cost structure  Explore use of network outsourcing and infrastructure sharing as necessary  Optimize and consolidate IT infrastructure  Simplify and automate business processes and transition to self-service. Achieve scale  Deploy standardized processes and technology platforms for rapid and seamless M&A integration  Leverage dynamic infrastructures, global resources, “centers of excellence,” and standardized and automated processes for scale  Institutionalize processes to identify acquisition targets, conduct due diligence and close M&A transactions.
  • 28.
    26 Telco 2015 Appendix 3 Critical success attributes and capability implications A-3.4 Generative Bazaar Critical success attributes IBM recommendations Structural separation of  Negotiate appropriate point of separation to preserve the integrity of the NetCo and ServCo businesses and align network and services skills with business outcomes. operations  Define and implement target operating model for separation along with processes, systems and organizational design  Build capability to support dynamic wholesale pricing for different levels of service. Pervasive open network  Devise shared/co-operative funding model for open network access with risk sharing access infrastructure  Anticipate and plan for growth in data and build/optimize network to deliver large volumes cost-effectively  Secure regulatory incentives for open and non-discriminatory access. Third-party applications/  Establish value proposition for third-party providers, including interfaces to network capabilities, service enablers services innovation based on open standards, access to ecosystem of partners, a commercial model and infrastructure support for common business process services, e.g., self-service, e-commerce, billing  Provide test infrastructure for experimentation and stimulate developer community to ramp-up application/service innovation. Dynamic business design  Enable infrastructure/processes to support connectivity of a multitude of objects, sensors, devices and applications  Enable real-time data collection and analytics for dynamic decision support  Leverage dynamic architectures and cloud-based infrastructures to reduce cost, and for business flexibility. Leverage advanced  Leverage insights into network and usage data to optimize core and access networks; reduce costs; and customer and network improve customer experience analytics  Proactively monitor, track and effect actual experience in real-time  Leverage insights across the customer lifecycle to enhance and deliver differentiated end-to-end customer experience.
  • 29.
    IBM Global BusinessServices 27 Glossary36 2G – Short for second generation of mobile telephony Dongle – Portable mobile broadband adapter connected to a systems. laptop or PC via a USB port. 2.5G – An extension of 2G systems to support packet- xDSL (Digital Subscriber Line) – A family of technologies switched data communications. capable of transforming ordinary phone lines into high-speed 3G – Third generation of mobile systems that supports digital lines for Internet access. ADSL (asymmetric digital conventional voice along with high-speed data transmission subscriber line) allows higher speeds in one direction (toward for multimedia (including video) communications over a mobile the customer) than the other. HDSL (high data rate digital network. subscriber line) and VDSL (very high data rate digital subscriber line) are all variants of xDSL). 3.5G – (see HSPA) FTTC (Fiber-to-the-cabinet) – Access network consisting of Access network – Connection of end-user premises to a optical fiber from the exchange to the cabinet or node at the service provider. It is sometimes referred to as the “local loop” end of the road (in a residential area) and a traditional copper or “last mile.” pair augmented with high-speed DSL technology (e.g., VDSL) ARPU (Average revenue per user) – earned from a subscriber, to the customer’s premises. typically over a month. FTTH (Fiber-to-the-home) – Optical fiber is extended all the Blog – Short for Weblog. A Weblog is a journal (or newsletter) way to the customer’s home. that is frequently updated. FTTB (Fiber-to-the-building) – Similar to FTTH but building is Broadband – “Always on” high-speed Internet access with typically a multi-dwelling unit (MDU) e.g., a block of flats. speeds in excess of 256 Kbps. FTTx – Variants of optical fiber access networks – e.g., FTTC, CAGR (Compound Annual Growth Rate) – The average FTTH, FTTB. annual growth rate over a specified period of time. GSM (Global System for Mobile Communications) – A global CDN (Content Delivery Network) – A network of computers standard for mobile telephony. that cache data at various points in a network to enhance GSMA (GSM Association) – The trade body for the world’s delivery and user experience. mobile operators. CSP (Communication Service Providers) – An umbrella term HDTV (High-definition television) – A technology that provides used to describe both traditional providers of communication viewers with better quality, high resolution pictures. services (i.e., telecom) and alternative providers such as cable TV companies and other-the-top providers. HD Voice – A technology that provides better audio quality by delivering at least twice the sound range (wideband) of a traditional (narrowband) telephone call.
  • 30.
    28 Telco 2015 HSPA (High Speed Packet Access) – Often referred to as Microblogging – Short-form blogging. The term is commonly 3.5G, this is an extension to the original 3G standard associated with the Twitter service, on which messages are providing significantly higher data rates. HSDPA (downlink) no longer than 140 characters. can provide theoretical maximum downlink speeds of 14.4 MMS (Multimedia Messaging Service) – The next generation Mbps. HSUPA (uplink) supports maximum uplink speeds of of mobile messaging services, adding photos, pictures and 5.76 Mbps. audio to text messages. IMS (IP Multimedia Subsystem) – Part of 3G Architecture Mobile broadband – Various types of wireless high-speed designed to provide ubiquitous cellular access to all Internet Internet access through a portable modem, telephone or services. other device. IP (Internet Protocol) – The packet data protocol used for Narrowband – A service or connection providing data routing and carrying messages across the Internet and similar speeds up to 128 Kbps, such as via an analog telephone line. networks. NEP (Network Equipment Providers) – Companies that supply IPTV (Internet Protocol Television) – Television and/or video communications equipment to service providers/operators. signals that are delivered to subscribers or viewers using Internet Protocol (IP), the technology that is also used to NGN (Next Generation Networks) – Internet Protocol-based access the Internet. We use the term to mean delivery over a core networks that can support a variety of existing and new “closed intranet”, typically operated by ISPs and local-loop services, typically replacing multiple, single service legacy unbundlers, rather than over the public Internet. IPTV services networks. are hosted on servers placed in the exchange, which means NGA (Next Generation Access) networks – Broadband they can be delivered with assured QoS since the ISP has access networks that connect the end-user to the core more control over the network. network capable of a bandwidth quantity and quality signifi- Local Loop –The access network connection between the cantly in excess of current levels (a benchmark of 20 Mbps or customer’s premises and the local PSTN exchange, usually a more is often used). loop comprised of two copper wires. PSTN (Public switched telephone network) – The network LTE (Long Term Evolution) – The next iteration of 3G mobile that manages circuit-switched fixed line telephone systems. communications network, which optimizes the 3GPP’s (3rd SIM (Subscriber Identify Module) – A SIM or SIM card is a Generation Partnership Project) radio access architecture to small flat electronic chip that identifies a mobile customer and deliver mobile broadband speeds similar to those available on the mobile operator. A mobile phone must have a SIM card high-speed fixed broadband networks. It is based on a inserted before it can be used. high-speed, IP-only radio interface, promising downlink peak rates of 100 Mbps, with uplink rates of 50 Mbps. It promises higher spectral efficiency than normal 3G and will benefit from much-needed new spectrum resources to support mobile data growth.
  • 31.
    IBM Global BusinessServices 29 SIM-only – A mobile contract that is sold without a handset. SMS (Short messaging service) – Also known as “text messaging,” this is a mechanism that facilitates the delivery of short text messages over mobile networks. Social networking sites – A Website that allows users to join communities and interact with friends or to others that share common interests. VoBB (Voice over Broadband) – VoIP (see separate entry) delivered over broadband networks. VoD (Video-on-demand) – A service or technology that enables TV viewers to watch programs or films whenever they choose to, not restricted by a linear schedule. VoIP (Voice over Internet Protocol) – Voice communications transmitted over public Internet or private IP networks. VNO (Virtual Network Operator) – A telecom service provider that does not have allocation of spectrum or its own network and uses those of another operator to deliver services to its customers. MVNO is Mobile Virtual Network Operator. WiMAX (Worldwide Interoperability for Microwave Access) – A wireless MAN (metropolitan area network) technology, based on the 802.16 standard. Available for both fixed and mobile data applications, the technology was approved as a 3G standard by the International Telecommunications Union (ITU) in 2007.
  • 32.
    30 Telco 2015 About the authors Executive sponsors Ekow Nelson leads strategic thought leadership and research Chris Pearson, Senior Client Partner, Telecom Industry, IBM in telecommunications at IBM’s Institute of Business Value and Global Business Services is a contributor to IBM‘s global telecom strategy. A manage- Nick Gurney, Partner and Global Telecom Leader, IBM ment consultant for over 20 years, Ekow has worked in a range Global Business Services of advisory and implementation roles, from strategy and market/product development to systems integration and Scott T. Stainken, General Manager, Telecommunications project management for major telecommunications and media Industry, IBM Corporation organizations. He is author of numerous papers on Telecom- Eric Riddleberger, Partner and Communications Sector munications including “The changing face of communication: Strategy & Transformation Lead, IBM Global Business Social networking’s growing influence on telecom providers,” Services the Telecom editions of IBM’s CEO and CIO studies, “A Joseph Ziskin, Vice President, Corporate Strategy, IBM Future in Content(ion)” and “The Innovation Paradox in the Corporation Telecom Industry.” He contributes to The Annual Review of Communications and the Journal of Telecommunications Manage- Judith A. List, Partner and North American Telecom Lead, ment. He can be contacted at ekow.nelson@uk.ibm.com. IBM Global Business Services Mario Cavestany, Vice President Southwest Europe Telecom Rob van den Dam is the telecommunications leader at the and Media Lead, IBM Corporation IBM Institute for Business Value. In this role he develops industry outlooks and business value realization studies for Contributors telecom. He has 20 years experience of working in telecommu- IDATE Consulting and Research nications. Rob periodically presents or participates in panel Thomas F. Ross, Partner, Telecom Solutions Lead Northeast sessions at major industry conferences, and has written or Europe, IBM Global Business Services co-written numerous papers and articles on telecommunica- tions and media, including “The changing face of communica- Rob Wilmot, Partner, Telecom and Media, IBM Global tions: Social networking’s growing influence on telecom Business Services, UK and Ireland providers,” Social Media: where broadcast and broadband Zygmunt Lozinksi, Telecom Industry Technical Lead come together,” “Fighting for Viewers - IPTV versus Internet Northeast Europe and Master Inventor, IBM Corporation TV,” “A Future in Content(ion),” “Cash, Credit, or Phone” and Gary Langley, Telecom Value Creation Lead, Northeast “Mobile Advertising, Ads on the Move.” He can be contacted Europe, IBM Corporation at rob_vandendam@nl.ibm.com. Dr. Hagen Wenzek, Corporate Strategy, IBM Corporation Matthew Stankey, Global Telecom Marketing Lead, IBM Global Business Services Andreas Erler, Associate Partner, IBM Global Business Services Eduardo Argueso Lopez, Telecom and Media Manager, IBM Corporation Soufian Ameziane, IBM Corporation, Germany
  • 33.
    IBM Global BusinessServices 31 The right partner for a changing world At IBM, we collaborate with our clients, bringing together business insight, advanced research and technology to give them a distinct advantage in today’s rapidly changing environ- ment. Through our integrated approach to business design and execution, we help turn strategies into action. And with expertise in 17 industries and global capabilities that span 170 countries, we can help clients anticipate change and profit from new opportunities.
  • 34.
    32 Telco 2015 References 10 IDATE and IBM Institute for Business Value analysis. 1 This report is based on 60 C-level interviews, over 7,700 11 Montagne, Roland. “Telcos’ views of openness.” IDATE consumer surveys and extensive research by the IBM DigiWorld Summit. 2009; IBM Institute for Business Value Institute for Business Value (IBV). The IBV conducted analysis. face-to-face interviews with 60 senior executives from nearly 12 “Apple’s App Store Downloads Top Three Billion.” Apple 40 communication service providers to gain their perspec- Press Release, January 5, 2010. http://www.apple.com/pr/ tives on the key drivers of change. The consumer survey library/2010/01/05appstore.html (conducted in the United States, Germany, Sweden, the United Kingdom, Spain, the Netherlands, China, India and 13 IDATE and IBM Institute for Business Value analysis. Australia) examined their views on the impact of the 2008 14 Pujol, Frédéric. “Open Mobile.” IDATE DigiWorld Summit global economic crisis on communication services, buyer 2009; IBM Institute for Business Value Analysis values and influences, demand and spending on communica- 15 Capell, Kerry. “Vodafone and Orange Outsource To Ericsson tion services, content interaction models and emerging and Nokia.” Business Week. March 18, 2010. http://www. advanced communication capabilities. businessweek.com/globalbiz/blog/europeinsight/ 2 ICT Statistics Database. International Telecommunications archives/2009/03/vodafone_and_or.html Union (ITU). http://www.itu.int/ITU-D/icteye/Indicators/ 16 Ibid. Indicators.aspx. Note: 2009 figures are estimated; “The world in 2009: ICT Facts and Figures.” ITU. Geneva. 2009. http:// 17 Montagne, Roland. “Telcos’ views of openness.” IDATE., www.itu.int/ITU-D/ict/material/Telecom09_flyer.pdf; IBM DigiWorld Summit. 2009 Institute for Business Value Analysis. 18 Cisco Visual Networking Index. June 2009. http://www.cisco. 3 IDATE and IBM Institute for Business Value Analysis com/en/US/solutions/collateral/ns341/ns525/ns537/ns705/ ns827/white_paper_c11-481360.pdf; Institute for Business 4 Ibid. Value analysis. 5 Ibid. 19 Ibid. 6 Montagne, Roland. “Telcos’ views of openness.” IDATE. 20 IDATE and IBM Institute for Business Value analysis. DigiWorld Summit. 2009 21 “TeliaSonera launches commercial LTE in Stockholm and 7 Ibid. Oslo.” Telecoms.com. December 2009. http://www.telecoms. 8 IDATE, Bank of America/Merrill Lynch, Global Wireless com/16997/teliasonera-launches-commercial-lte-in-stock- Matrix 1Q09 and IBM Institute for Business Value analysis. holm-and-oslo 9 Bharti Airtel Limited, Investor Presentation, April 2009 22 Pujol, Frédéric. “Open Mobile. “ IDATE DigiWorld Summit (downloaded from http://www.airtel.in/wps/wcm/connect/ 2009; IBM Institute for Business Value analysis. ea3977804dfa60049ce2bcc43c6eaf82/Investor-Presentation- April-09-n.pdf?MOD=AJPERES&CACHEID=ea3977804dfa 60049ce2bcc43c6eaf82)
  • 35.
    IBM Global BusinessServices 33 23 Toledano, Joëlle. “Toward FTTH.” AUTORITÉ DE RÉGU- 34 Ergas, Henry. “FTTP deployment in Australia.” IDATE LATION des Communications Electroniques et des Postes DigiWorld Summit 2009. (ACERP). Digiworld. 2009. 35 Wei Ho Ka. “Fact Sheet: Next Generation National 24 Montagne, Roland. “FTTH Panorama European Union (36) Infocomm Infrastructure.” Infocomm Development Authority & Middle East (14) at end December 2009.” IDATE. of Singapore. http://www.itu.int/osg/spu/ngn/documents/ February 2010. NGNII-Factsheet-060303-Singapore.pdf) 25 Citynet Amsterdam.http://www.citynet.nl/ 36 The Communications Market Report.” Ofcom. 2009; IBM 26 2009 IBM Telecom Industry Survey. IBM Institute for Institute for Business Value analysis. Business Value. 27 “An Introduction to RCS.” GSMA., http://www.gsmworld. com/our-work/mobile_lifestyle/rcs/an_introduction_to_RCS. htm; IBM Institute for Business Value analysis. 28 “Leading Operators Unite to Unleash Global Apps Potential.” GSMA. February 15, 2010. http://www.gsmworld.com/ newsroom/press-releases/2010/4633.htm 29 “GSMA Leads Mobile Industry Towards a Single, Global Solution for Voice over LTE.” GSMA. February 15, 2010. http://www.gsmworld.com/newsroom/press- releases/2010/4634.htm 39 Sherr, Ian and John Poirier. “Google to build high-speed Internet network.” Reuters. February 10, 2010. http://www. reuters.com/article/idUSTRE6193XH20100210 31 IDATE and IBM Institute for Business Value analysis. 32 Benkler, Yochai. “Next Generation Connectivity.” The Berkman Center for Internet & Society. October 2009. Harvard University. 33 Ibid.
  • 36.
    © Copyright IBMCorporation 2010 IBM Global Services Route 100 Somers, NY 10589 U.S.A. Produced in the United States of America April 2010 All Rights Reserved IBM, the IBM logo and ibm.com are trademarks or registered trademarks of International Business Machines Corporation in the United States, other countries, or both. If these and other IBM trademarked terms are marked on their first occurrence in this information with a trademark symbol (® or ™), these symbols indicate U.S. registered or common law trademarks owned by IBM at the time this information was published. Such trademarks may also be registered or common law trademarks in other countries. A current list of IBM trademarks is available on the Web at “Copyright and trademark information” at ibm.com/legal/copytrade.shtml Other company, product and service names may be trademarks or service marks of others. References in this publication to IBM products and services do not imply that IBM intends to make them available in all countries in which IBM operates. Please Recycle GBE03304-USEN-01