Download to read offline

![6
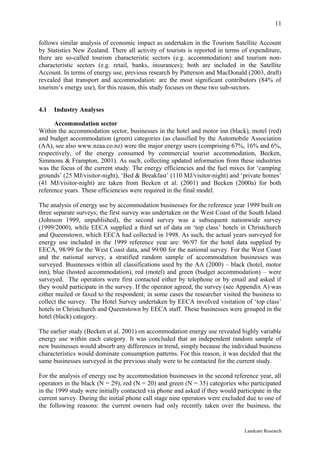
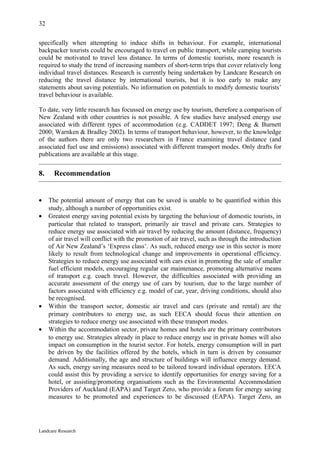
For the industry analyses for the second reference year, operators in the hotel, motel and
backpacker accommodation categories were asked to provide information on their business
and the amount of electricity, fossil fuel and other solid fuel consumed in its running.
Similarly, transport providers were asked to supply data on fuel consumption and load
factors, where information was not able to be accessed from publications. Information gained
in these surveys was translated into energy efficiencies (energy use per unit of output, i.e.
MJ/passenger-kilometre [MJ/pkm] and MJ/visitor-night) and compared for the two reference
years. Analyses of tourist behaviour (i.e. travel choices in the transport and accommodation
sub-sectors) were based on data provided through the Domestic Travel Study and the
International Visitor Study (both undertaken by Tourism New Zealand), and were used to
identify distinct tourist types (by means of cluster analysis). The travel behaviour of each
tourist type was combined with energy efficiencies obtained in the industry analyses, which
then enabled calculation of energy use associated with each tourist type and for all tourists.
Results
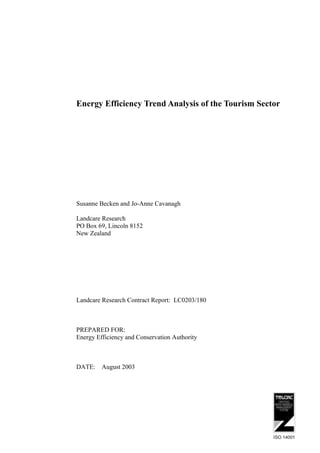
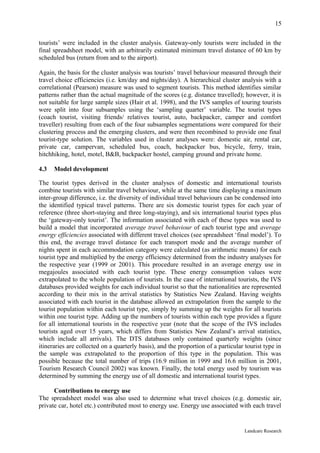
• Overall, hotel and motel operators showed a decrease in energy efficiency, dropping from
134.0 MJ/ visitor-night and 40.4 MJ/visitor-night respectively in the 1999 reference year
to 145.3 MJ/ visitor-night and 48.5 MJ/ visitor-night respectively in the 2001 reference
year. This equates to a decrease in efficiency of 8.4% and 20% for hotels and motels
respectively. In contrast backpacker operators increased their energy efficiency from 38.6
MJ/ visitor-night in the 1999 reference year to 36.7 MJ/ visitor-night in 2001.
• The energy efficiency of domestic air travel, rail, Cook Strait ferry and coach travel
(backpacker bus, scheduled coach, shuttle bus) increased by 5-74% in the 2001 reference
year, although the efficiency of campervans decreased (16 %). In 2001, energy use by the
different transport modes varied from 0.32 MJ/pkm for scheduled coaches to 2.63
MJ/pkm for the Cook Strait ferry. The energy efficiency of cars was unable to be
updated, due to the difficulties in accounting for the large number of number of factors
(e.g. model of car, year of manufacture, driving conditions) that influences energy
efficiencies.
• The energy efficiency of domestic air travel improved (2.5 MJ/pkm in 2001 compared
with 3.2 MJ/pkm in 1999), as a result of increases in both technological efficiency (lower
fuel consumption per kilometre) and operational efficiency (increased load factors).
• Overall, transport and accommodation associated with tourism consumed 22.6 PJ in 1999
and 21.0 PJ in 2001, which is equivalent to a decrease of 7.5%. Transport and
accommodation contributed 81.7 % (18.5 PJ) and 18.3 % (4.2 PJ) respectively of the
energy use in 1999 and 78.8% (16.5 PJ) and 21.2% (4.4 PJ) respectively in 2001.
• In 1999, fuel (diesel and petrol) contributed at 43.8% (9.9 PJ) of the total energy use,
followed by aviation fuel (38.4%, 8.7 PJ) and electricity (13.2%, 3.0 PJ). The proportions
were similar in 2001, where petroleum fuel made up 44.7% (9.4 PJ), aviation fuel 34.5%
(7.2 PJ) and electricity 15.1% (3.2 PJ) of the total energy use.
• Including both international and domestic tourists, the most important drivers of this
energy use are domestic air (34.5% of the total energy use in 2001), private cars (30.5%),
and private homes (9.6%).
• Fewer tourists travelled by domestic air in 2001 compared with 1999 (3.8% less for
domestic tourists and 7.5% less for international tourists). This may change with the
introduction of Air New Zealand’s ‘Express Class’ that may lead to increased volumes
and possibly more flights as a result of the associated cheaper fares.
Landcare Research](https://image.slidesharecdn.com/4226finalreport2907s13803-130205195837-phpapp02/85/4226-final-report2907_s13803-6-320.jpg)
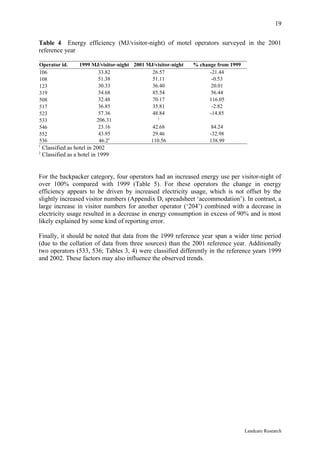
![20
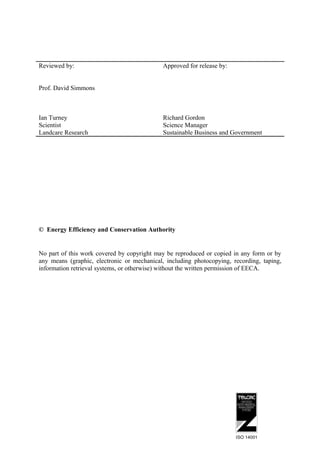
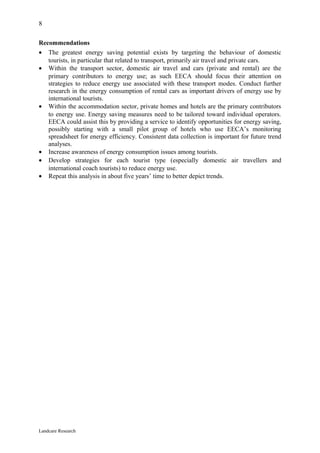
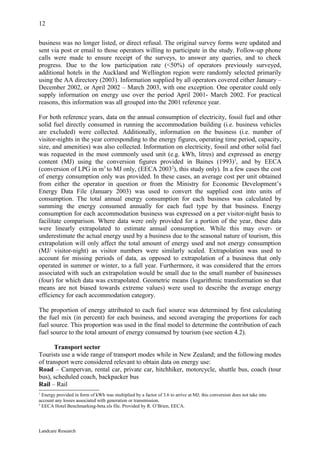
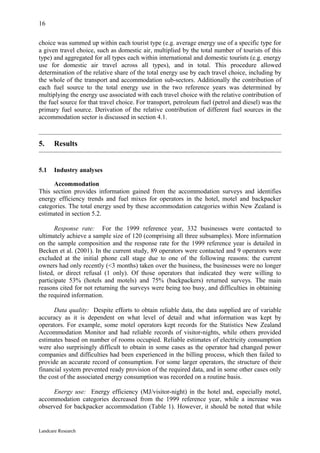
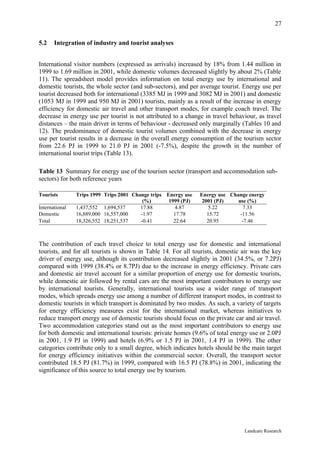
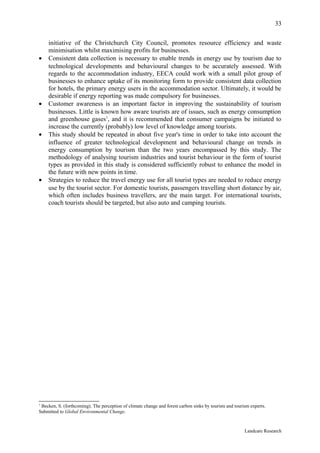
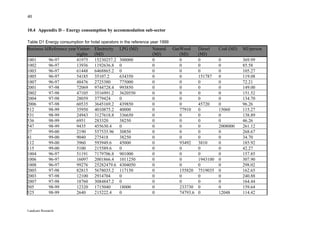
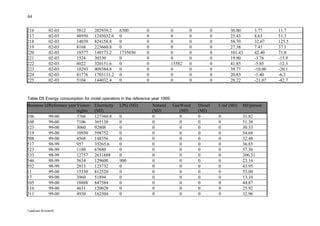
Table 5 Energy efficiency (MJ/visitor-night) of backpacker operators surveyed in the 2001
reference year
Operator id. 1999 MJ/visitor- 2001 MJ/visitor-night % change from 1999
night
506 43.72 47.71 9.1
526 32.08 42.08 31.2
200 194.71 133.11 -31.6
201 22.62 19.33 -14.5
202 7.73 30.56 295.4
203 43.99 144.85 229.3
204 44.83 3.85 -91.4
205 54.96 17.02 -69.0
1
206 53.43 NA
207 81.62 72.70 -10.9
209 31.66 142.81 351.0
210 39.03 39.09 0.2
211 49.19 54.32 10.4
212 26.55 21.98 -17.2
213 30.68 31.63 3.1
214 36.95 19.81 -46.4
216 32.23 36.00 11.7
217 16.81 25.43 51.3
218 26.03 58.70 125.5
219 19.97 27.38 37.1
220 59.03 101.43 71.8
221 23.66 19.90 -15.9
222 47.70 41.85 -12.3
223 49.77 39.77 -20.1
224 22.23 20.83 -6.3
225 49.29 28.22 -42.8
1
Unreliable estimates
Contribution of fuel sources to total energy consumption
Electricity is the primary contributor to the total energy consumption in all accommodation
categories for both reference years (Tables 6 and 7). LPG is the next most common fuel type
for all, while the other sources, natural gas, wood, diesel and coal, only play a minor role.
Table 6 Relative contribution of different fuel sources to total energy use by operators
surveyed in the 1999 reference year
Fuel source Hotel [%] Motel [%] Backpacker [%]
Electricity 74.4 94.8 76.3
LPG 7.5 4.4 3.2
Natural gas 0.0 0.0 5.1
Wood 5.6 0.9 9.8
Diesel 7.7 0.0 1.1
Coal 4.8 0.0 4.5
Landcare Research](https://image.slidesharecdn.com/4226finalreport2907s13803-130205195837-phpapp02/85/4226-final-report2907_s13803-20-320.jpg)
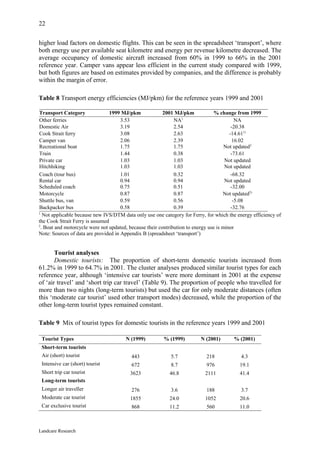
![21
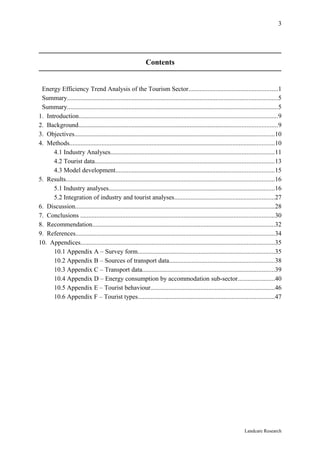
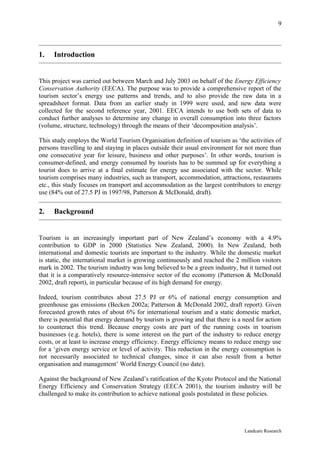
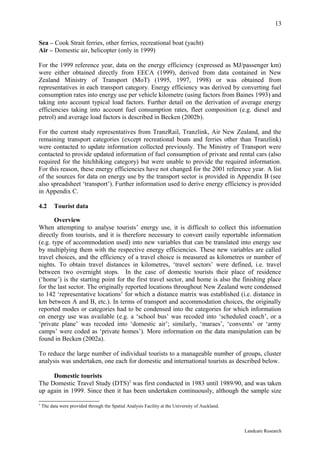
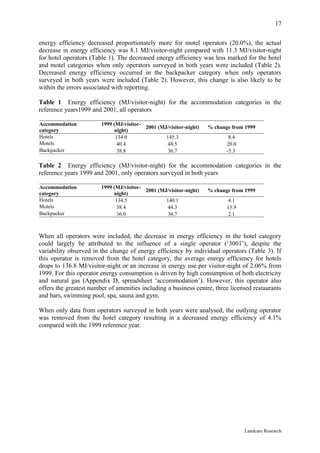
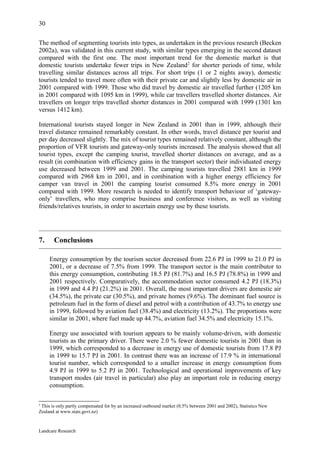
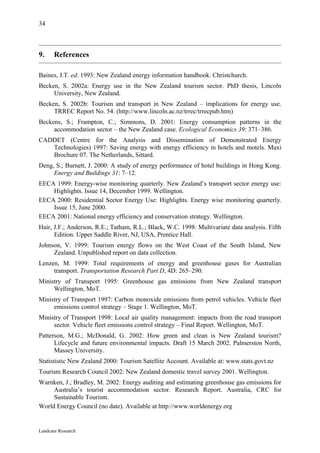
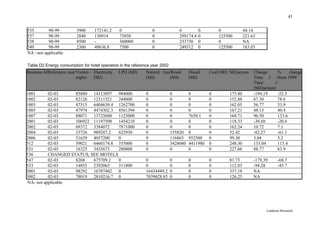
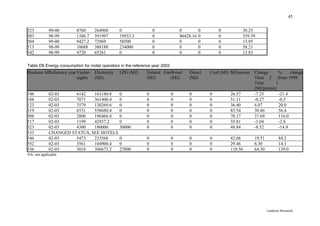
Table 7 Relative contribution of different fuel sources to total energy use by operators
surveyed in the 2001 reference year
Fuel source Hotel [%] Motel [%] Backpacker [%]
Electricity 70.6 97.8 90.1
LPG 15.8 2.2 6.1
Natural gas 8.1 0.0 0.4
Wood 2.3 0.0 1.2
Diesel 3.2 0.0 0.0
Coal 0 0.0 2.1
Potential for energy savings exist in initially making operators aware of how their energy is
being used and of cost-effective ways to reduce that energy use. This is especially relevant
for motel operators for which the greatest difficulties were experienced in obtaining energy
use data due to the lack of, or incomplete records. Awareness of energy use could be
achieved through the promotion of consistent data reporting such as that already commenced
by EECA with their auditing spreadsheet for hotels and by the Youth Hostel Association who
records energy consumption of its member hostels. However, it should also be acknowledged
that a number of operators (particularly hotels) already record energy consumption for their
own use and are working towards reducing energy use. Energy consumption of an individual
operator also depends on the number and type of facilities (e.g. spas, saunas, bars) offered,
which in turn is driven by consumer demand. As such cost-effective energy saving measures
need to be tailored to individual businesses and case studies of energy saving measures such
as those provided by the Environmental Accommodation Providers of Auckland could be
promoted as examples of ways different operators have already reduced energy use.
Transport
This section provides the energy efficiency trends for the different transport modes. Energy
efficiency is measured as the amount of energy used per passenger-kilometre, hence this
measure takes into account both fuel efficiency of the vehicle and average load factors. These
data are used in section 5.2 to estimate the overall energy use by transport and the relative
importance of different transport modes.
Data quality: The quality of data for transport modes typically used by tourists varies, with
data on domestic air travel, the Cook Strait ferries and rail travel considered to be the most
accurate and reliable. Bus operations and campervan travel were also considered to be
reasonably reliable and accurate. The value for car transport constituted an average value
dating back to the mid-1990s. However, the variation in fuel consumption for cars is
considerable given different makes, years, driving conditions, etc., which is the reason why
the Ministry of Transport were unwilling to update the average consumption figure provided
in MoT (1995).
Energy use: The greatest improvements in energy efficiency were made for rail travel,
coach tours, scheduled buses and domestic air travel (Table 8). In the case of coach and bus
travel, the determining factor was increased occupancy of buses in the 2001 reference year
compared with 1999. The energy efficiency for rail travel in 1999 has been taken from EECA
(1999), while the data for 2001 reference year have been provided directly by TranzRail.
Achievements in energy efficiency for air travel are due to a modernised fleet as well as
Landcare Research](https://image.slidesharecdn.com/4226finalreport2907s13803-130205195837-phpapp02/85/4226-final-report2907_s13803-21-320.jpg)
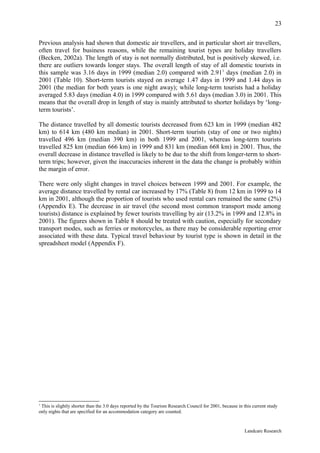
![24
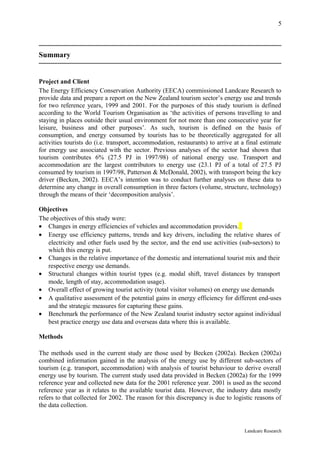
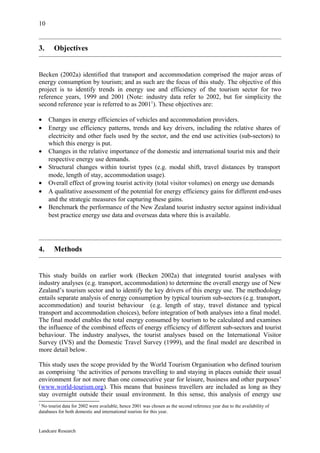
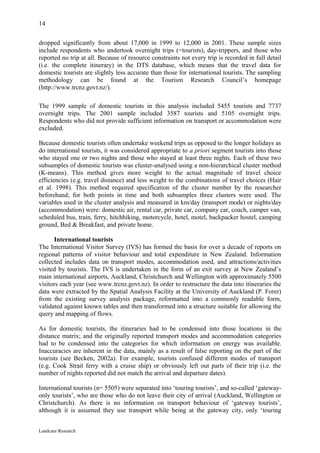
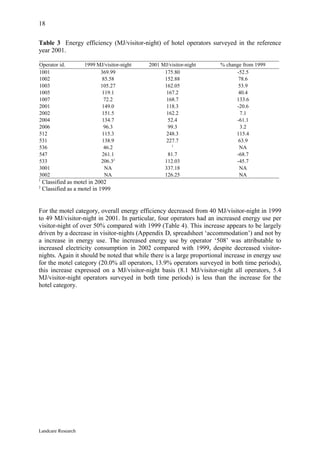
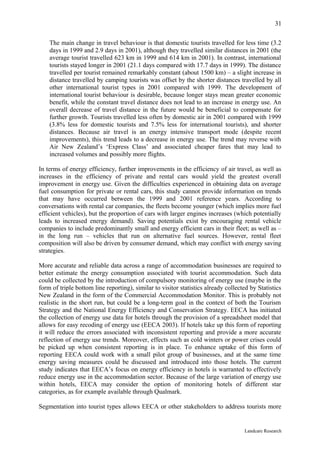
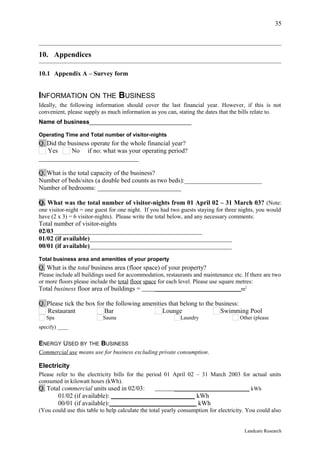
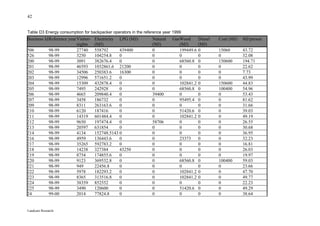
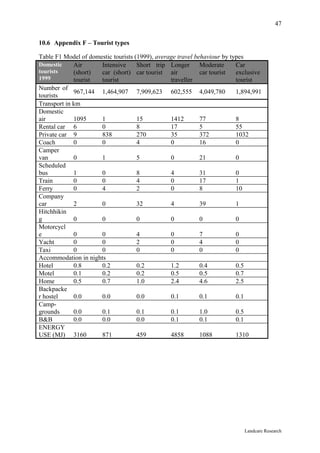
Table 10 Travel choices of domestic tourists for both reference years and all tourist types
Travel choice 1999 2001 Change [%]
Average distance travelled per tourist (km)
Domestic air 140 135 -3.6
Rental car 12 14 16.7
Private car 406 395 -2.7
Coach 6 6 0.0
Camper van 7 7 0.0
Scheduled bus 11 13 18.2
Train 6 5 -16.7
Ferry 4 5 25.0
Company car 25 28 12.0
Hitchhiking - 1
Motorcycle 3 1 -66.7
Yacht 2 1 -50.0
Taxi - 1
TOTAL DISTANCE 623 614 -1.4
Accommodation (average nights per tourist)
Hotel 0.4 0.3 -25.0
Motel 0.3 0.3 0.0
Home 2.0 1.9 -5.0
Backpacker hostel 0.1 0.1 0.0
Campgrounds 0.4 0.3 -25.0
B&B 0.1 0.1 0.0
TOTAL STAY 3.16 2.91 -7.9
Note: the figures presented in this table are calculated as an average across all tourists, including those that did
not use a specific transport mode (distance = 0) or accommodation category (no nights).
International tourists: In the IVS sample of 1999, data were analysed for 5505 tourists,
of which 1162 were gateway-only tourists (21.1%). Similarly in 2001, 5468 tourists, of which
1184 were gateway-only tourists (21.7%), were included in this analysis. The mix of tourist
types resulting from the cluster analyses is shown in Table 11. The mix of tourist types was
relatively stable over the two years, although both the proportion of tourists visiting
friends/relatives (VFR) and gateway-only tourist increased with a corresponding decrease in
other tourist types (Table 11).
Table 11 International tourist types in the reference years 1999 and 2001
Tourist Types N (1999) % (1999) N (2001) % (2001)
Coach tourist 1545 28.0 1488 27.2
Auto tourist 819 14.9 794 14.5
Backpacker 494 9.0 478 8.7
Camper 316 5.7 288 5.3
Comfort traveller 157 2.8 145 2.7
Visiting friends/ 1012 18.4 1091 20.0
relatives (VFR)
Gateway only 1162 21.1 1184 21.7
Landcare Research](https://image.slidesharecdn.com/4226finalreport2907s13803-130205195837-phpapp02/85/4226-final-report2907_s13803-24-320.jpg)
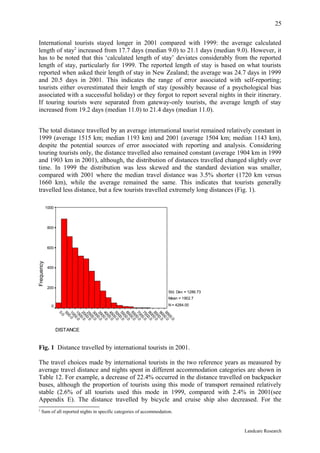
![28
Table 14 Most important drivers of energy use (relative share [%] of 22.6 PJ in 1999 and
21.0 PJ in 2001)
Key drivers of Domestic Domestic International International Overall Overall
energy use [%] tourists 1999 tourists 2001 tourists 1999 tourists 2001 share 1999 share 2001
Domestic air 39.7 36.1 33.8 29.6 38.4 34.5
Private car 36.3 39.2 4.0 4.4 29.3 30.5
Coach 0.6 0.2 8.7 2.7 2.3 0.8
Rental car 1.2 1.5 11.7 13.8 3.4 4.6
Camper van 1.5 1.7 5.2 6.3 2.3 2.9
“Home” 7.9 8.1 10.9 14.3 8.5 9.6
Hotel 4.5 4.3 12.7 14.9 6.2 6.9
Motel 1.3 1.7 2.1 3.0 1.4 2.0
Backpacker 0.1 0.1 2.3 2.9 0.6 1.0
The most important fuel source is diesel and petrol, followed by aviation fuel and electricity
(Table 15); the other sources only play a minor role. The importance of electricity increased
slightly between 1999 and 2001.
Table 15 Fuel sources (relative share [%]) in 1999 and 2001
Key drivers of energy Overall share Overall share
use [%] 1999 2001
Petrol/diesel fuel 43.8 44.7
Aviation fuel 38.4 34.5
Electricity 13.2 15.1
LPG 1.0 1.7
Wood 1.6 1.6
Natural gas 0.8 1.5
Coal 0.8 0.5
Geothermal 0.4 0.4
6. Discussion
The objective of this study was to analyse any trend in energy use by tourists and the tourism
sector that occurred between 1999 and 2001 resulting from changes in tourism activity
(volume), structure (e.g. tourist type mix) and technology, when considering transport and
accommodation as the major sources of energy demand. Due to the large volume of domestic
tourists, the slight decrease (2%) in the number of domestic trips by New Zealanders (in
combination with gains in efficiency) resulted in a larger decrease (11.6%) in the energy
demand for domestic tourism from 17.8 PJ in 1999 to 15.7 PJ in 2001. In contrast, the
growing international tourist volume (18% between the two reference years, and about 6%
per annum forecast each year until 2008, although this growth was slowed down in 2003 as a
result of external events such as SARS) led to a 7.3% increase in demand for energy by
international tourists during the two-year study period. This also indicates that the increased
volume of international tourists outweighs the efficiency gains (mainly in the transport sector,
e.g. domestic air travel). Due to the influence of domestic tourism, overall energy use by
Landcare Research](https://image.slidesharecdn.com/4226finalreport2907s13803-130205195837-phpapp02/85/4226-final-report2907_s13803-28-320.jpg)
![29
tourist transport and accommodation decreased by 7.5% between 2001 and 1999. Of the total
energy use transport contributed about 82% in 1999 and 79% in 2001. The main drivers of
energy use are domestic air travel (34.5%), cars (private [30.5%] and rental [4.6%]), private
homes (9.6%) and hotels (6.9%). The most significant modal change that could be observed
was a decrease in air travel.
Energy use per average trip, for both domestic and international tourists, decreased slightly
(international tourists: 3385 MJ in 1999 and 3082 MJ in 2001; domestic tourists: 1053 MJ in
1999 and 950 MJ in 2001) primarily as a result of improved energy efficiencies in the
transport sector. In particular, domestic air became more energy efficient on a per passenger
basis (3.19 MJ/pkm in 1999 and 2.54 MJ/pkm in 2002, Table 8). Furthermore, this result is
considered reliable because of the consistent reporting by Air New Zealand for both reference
years. Information on energy use by all other modes of transport was obtained from different
sources for each reference year (e.g. train and buses), or was unable to be updated (cars) and
may indicate that changes in energy use simply reflect different reporting. For the Cook Strait
ferry, energy use per passenger is highly dependent on the passenger-to-freight ratio, which
varies significantly, and makes improvements in efficiency difficult to detect. Energy use of
rental and private cars by tourists requires considerably more investigation than was possible
within the limits of this study. Principally, there are several competing trends that influence
energy use associated with these transport modes. These includes the introduction of more
modern and efficient cars (of particular importance for rental cars), the increasing number of
diesel cars, the increasing proportion of cars with larger engines, the popularity of four-wheel
drives, and the increasingly application of electronic equipment, such as air conditioning. At
this stage, there is no information on energy use associated with cars specifically used by
tourists, neither is there information whether specific types of tourists systematically use
different types of cars (e.g. there is some anecdotal evidence that backpackers tend to buy
older and smaller cars or rent them cheaply at companies such as ‘rent-a-dent’).
Energy efficiency associated with hotels and motels decreased slightly from 1999 to 2001
(134 MJ/visitor-night to 145 MJ/visitor-night, and 40.4 MJ/visitor-night to 48.5 MJ/visitor-
night for hotels and motels respectively). In contrast energy efficiency increased overall for
backpackers (from 38.6 MJ/visitor-night to 36.7 MJ/visitor-night in 1999 and 2001
respectively). In absolute numbers, hotels increased their energy use from 1.41 PJ in 1999 to
1.46 PJ in 2001, motels from 0.33PJ to 0.41 PJ and backpackers form 0.14 PJ to 0.17 PJ
(final spreadsheet model). For hotels and motels this change is likely to be attributed to both
increased stays and increase in energy efficiency for hotels and motels, for backpackers the
increase in consumption is due to increased international tourists to backpackers. However, it
is unclear as to how much of these trends are due to inconsistent or inaccurate reporting.
More detailed time-series would be needed to trace improvements in energy efficiency for
individual businesses, initially to primarily ensure consistent data collection. The results of
the accommodation survey show that the calculated average energy efficiency for a visitor-
night in a specific category depends on what businesses are included (outliers were shown to
affect the final result dramatically); and it is possibly inappropriate to try defining one single
estimate for energy use by category, given the very different nature of businesses even within
one category1. For the final spreadsheet model, however, it is pragmatic to assume a
representative energy efficiency for each category to allow calculation of energy use
associated with tourist types.
1
The variation in consumption patterns would possibly be less in other tourist destinations where more uniform, resort-style
accommodation businesses dominate.
Landcare Research](https://image.slidesharecdn.com/4226finalreport2907s13803-130205195837-phpapp02/85/4226-final-report2907_s13803-29-320.jpg)


![39
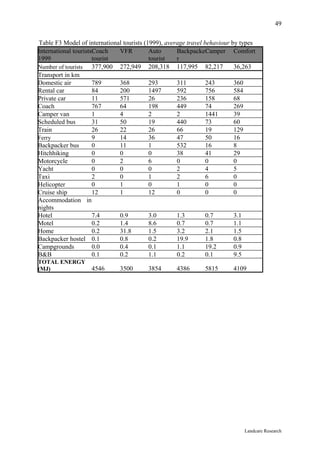
10.3 Appendix C – Transport data
Table C1 Transport data, road transport
Coach Category Average Avg fuel cons. MJ/pkm Other comments
company occupancy [l/100 km
Intercity scheduled 30 40.00 0.51 Guesstimates, assumed 30 pax on 50-
bus seater buses Volvo
Clarks tour 35 35.70 0.39 Refers to 48-seater bus
Coachlines operator
Clarks tour 29 12.85 0.17 Refers to 38-seater bus
Coachlines operator
Johnston's tour 35 36.50 0.40 Buses are 28 to 50 seaters, most in
Coachlines operator the fleet of 88 are 48-50 seaters
Kiwi backpacker bus Lease buses from Johnston's
Experience Coachlines
Magic Back- 32 32.50 0.39 Reliable data based on logs; high-
travellers packer season loads are 42 and off-peak
network bus loads are smaller at about 20 pax, the
32 are an estimated avg loading
Super Shuttle shuttle 10 14.80 0.56 Capacity of vans is 11; the estimate
for the fuel consumption refers to a
new Mercedes van (probably less
efficient for older vehicles)
Maui, Kea Camper 2.2 12- 15 2.39 Estimates provided by Kea Campers
Campers van and Maui
Table C2 Domestic air energy use
Air New Zealand data FY99 FY00 FY01 FY02 FY03*
MJ/ask 1.92 1.865 1.750 1.705 1.593
MJ/rpk 3.19 2.798 2.576 2.544 2.192
Percent Reduction
(% since FY99) -12.3% -19.2% -20.2% -31.3%
ask = available seat kilometre; rpk = revenue passenger kilometre
Table C3 Train energy use
Train data Passengers Passengers per Distance Energy use per Energy use per passenger
2002/3 trip * (oneway) oneway trip [MJ] kilometre [MJ/pkm]
Overlander 74,500 205 682 49117 0.35
Northerner 51,300 141 682 49117 0.51
Tranzcoastal 79,000 217 250 24765 0.46
Tranzalpine 194,000 533 230 39986 0.33
Table C4 Cook Strait Ferry energy use
Cook Strait MJ/passenger 1999 MJ/passenger 2001
Ferries
Lynx 9.19 5.59
Aratere 0.79 1.10
Arahura 1.25 1.48
Landcare Research](https://image.slidesharecdn.com/4226finalreport2907s13803-130205195837-phpapp02/85/4226-final-report2907_s13803-39-320.jpg)
![48
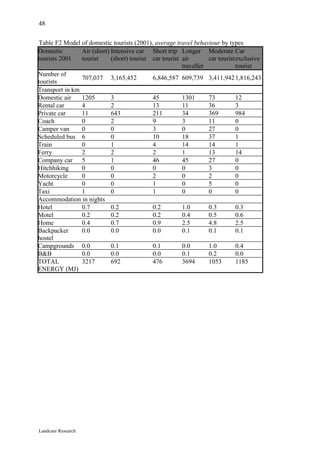
10.5 Appendix E – Tourist behaviour
Table E1 Information on proportion of tourist who used a specific transport mode or
accommodation category at least once.
Domestic Domestic International International
tourists 1999 tourists 2001 tourists 1999 tourists 2001
[%] [%] [%] [%]
Domestic air 13.3 12.8 37.4 34.6
Rental car 2.0 2.0 24.5 26.1
Private car 76.6 77.6 14.2 14.2
Coach 0.9 1.0 26.1 24.7
Camper van 1.0 0.7 3.5 3.5
Scheduled bus 2.3 2.6 40.41 40.3
Train 0.9 0.9 5.2 4.7
Ferry 2.9 3.4 15.4 16.8
Backpacker bus 0 0 2.6 2.4
Hitchhiking NA 0.1 0.8 0.5
Motorcycle 0.5 0.3 0.1 0.1
Yacht 0.7 0.6 0.3 0.3
Taxi NA 0.3 0.4 0.5
Helicopter NA NA 0.1 0.1
Cruise ship NA NA 0.5 0.5
Company car 4.6 5.0 NA NA
Bicycle NA NA 0.4 0.2
Hotel 17.0 16.8 55.2 54.0
Motel 13.2 13.6 23.5 22.7
Home 63.6 62.0 36.4 36.6
Backpacker 2.1 2.2 12.5 14.1
hostel
Campgrounds 10.1 9.2 9.5 9.2
B&B 2.1 1.8 8.4 7.4
1)
Note that gateway-only tourists were allocated 60 km by scheduled bus each.
Landcare Research](https://image.slidesharecdn.com/4226finalreport2907s13803-130205195837-phpapp02/85/4226-final-report2907_s13803-46-320.jpg)

- The study analyzed energy use trends in New Zealand's tourism sector between 1999 and 2001 by examining changes in energy efficiency of vehicles and accommodations, as well as structural changes in tourist types and their travel behaviors. - Overall hotel and motel operators decreased their energy efficiency between the two reference years, while backpacker operators increased efficiency. Most forms of transportation also improved efficiency except for campervans. - The goals were to understand drivers of energy use, benchmark performance against best practices, and identify opportunities for improved efficiency in the tourism sector.


