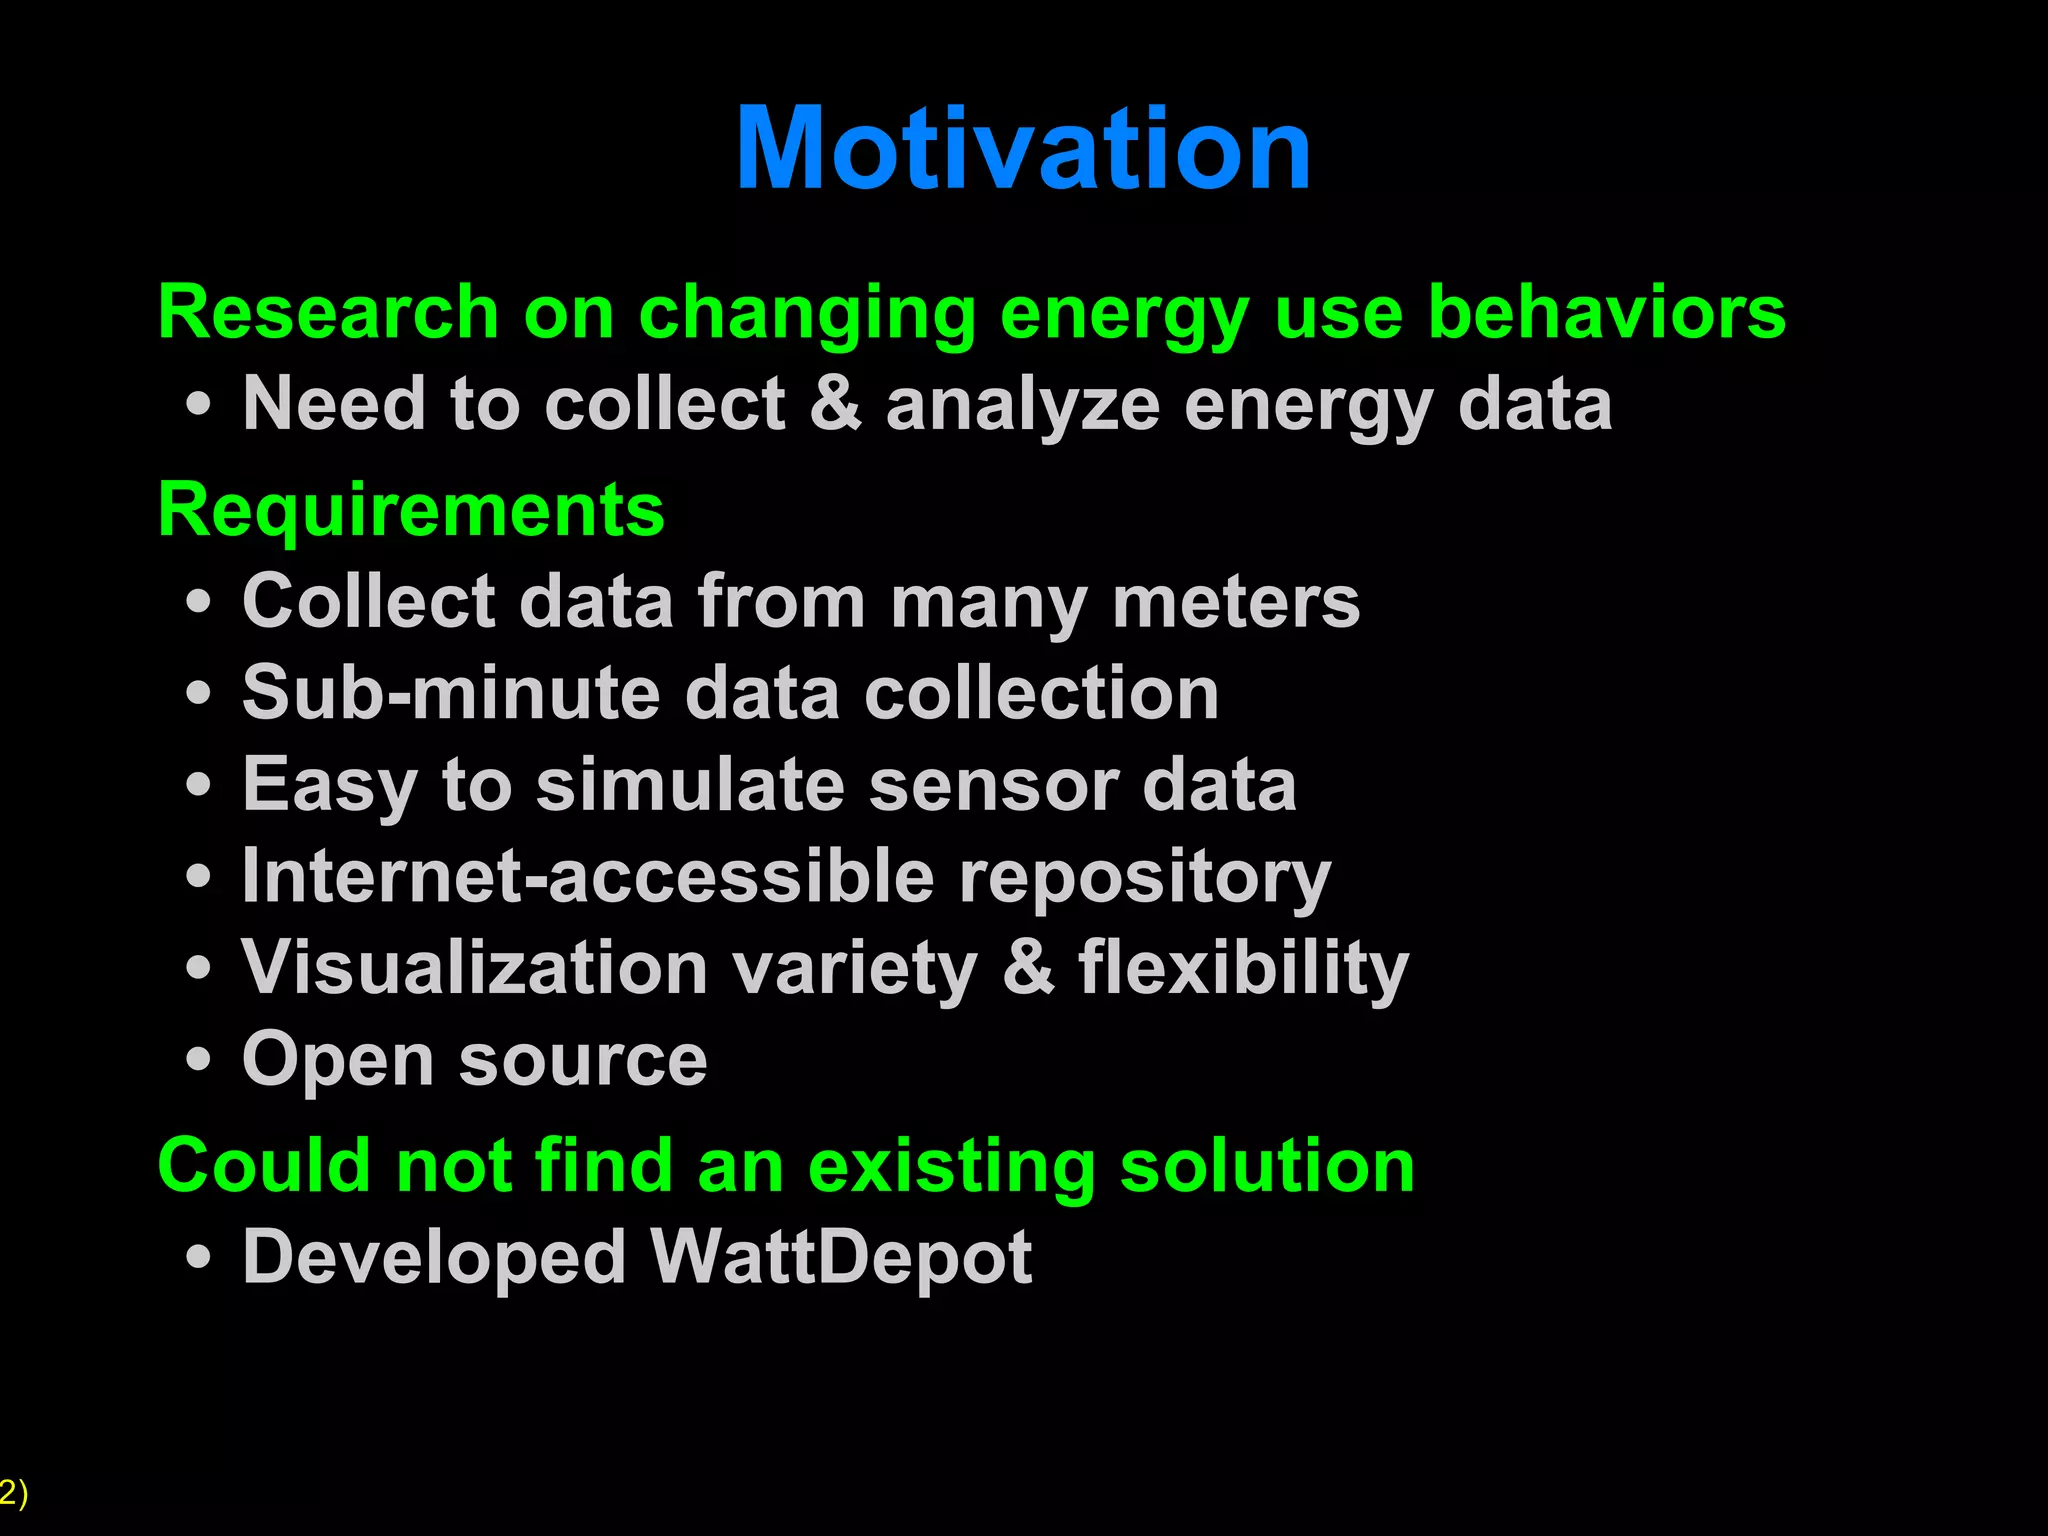
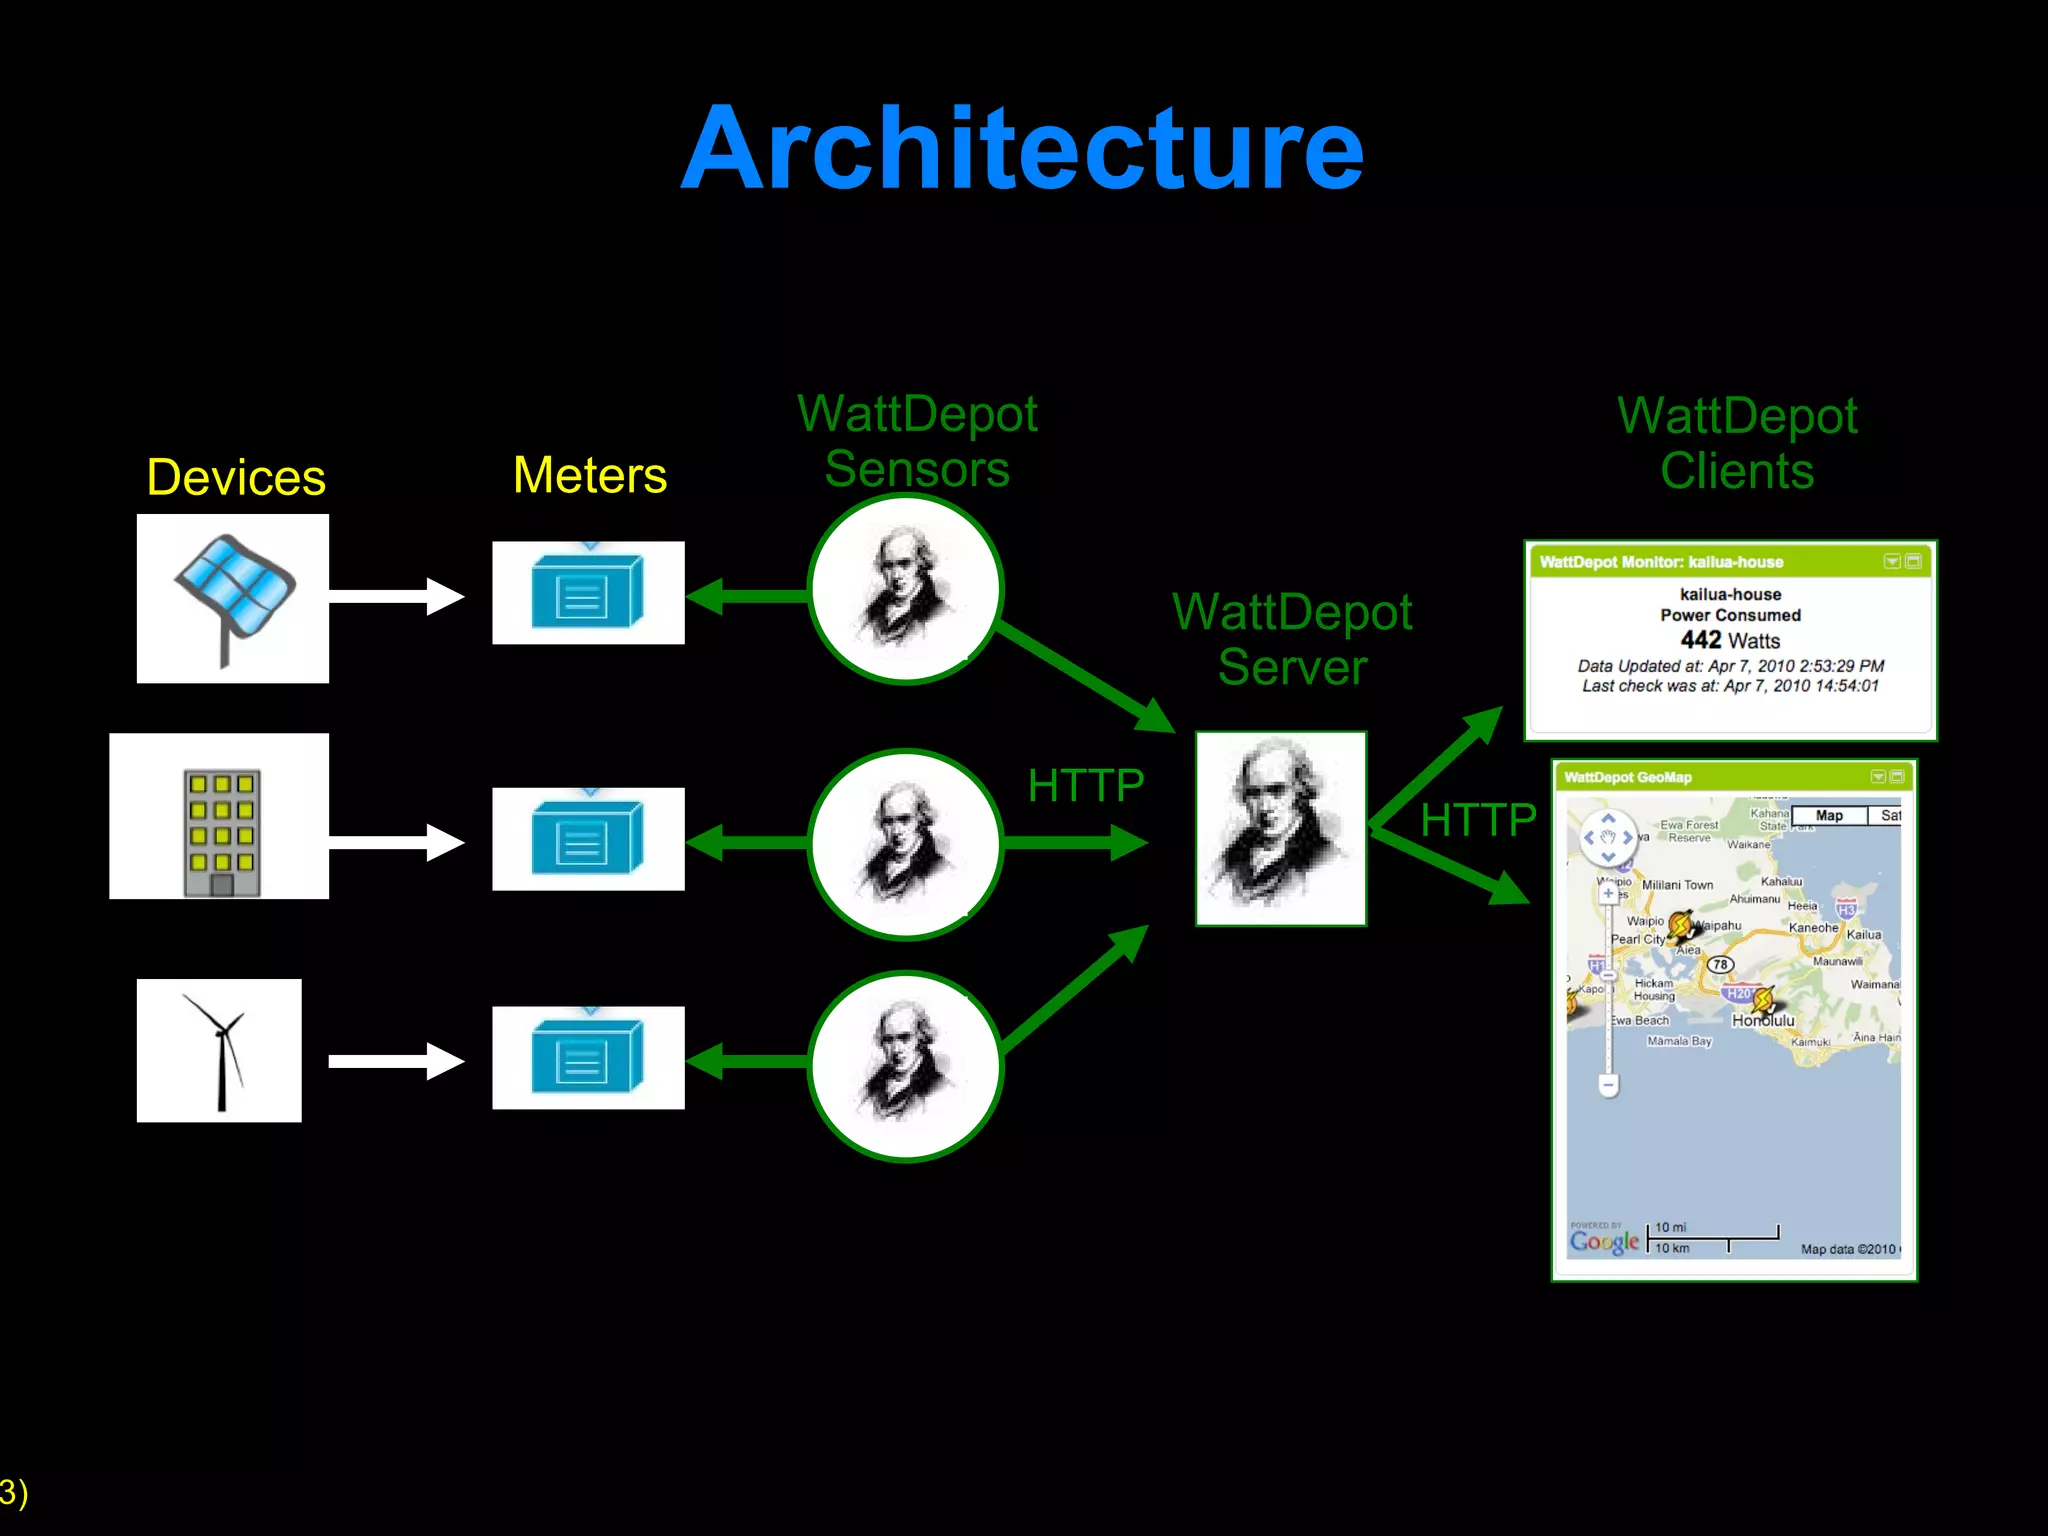
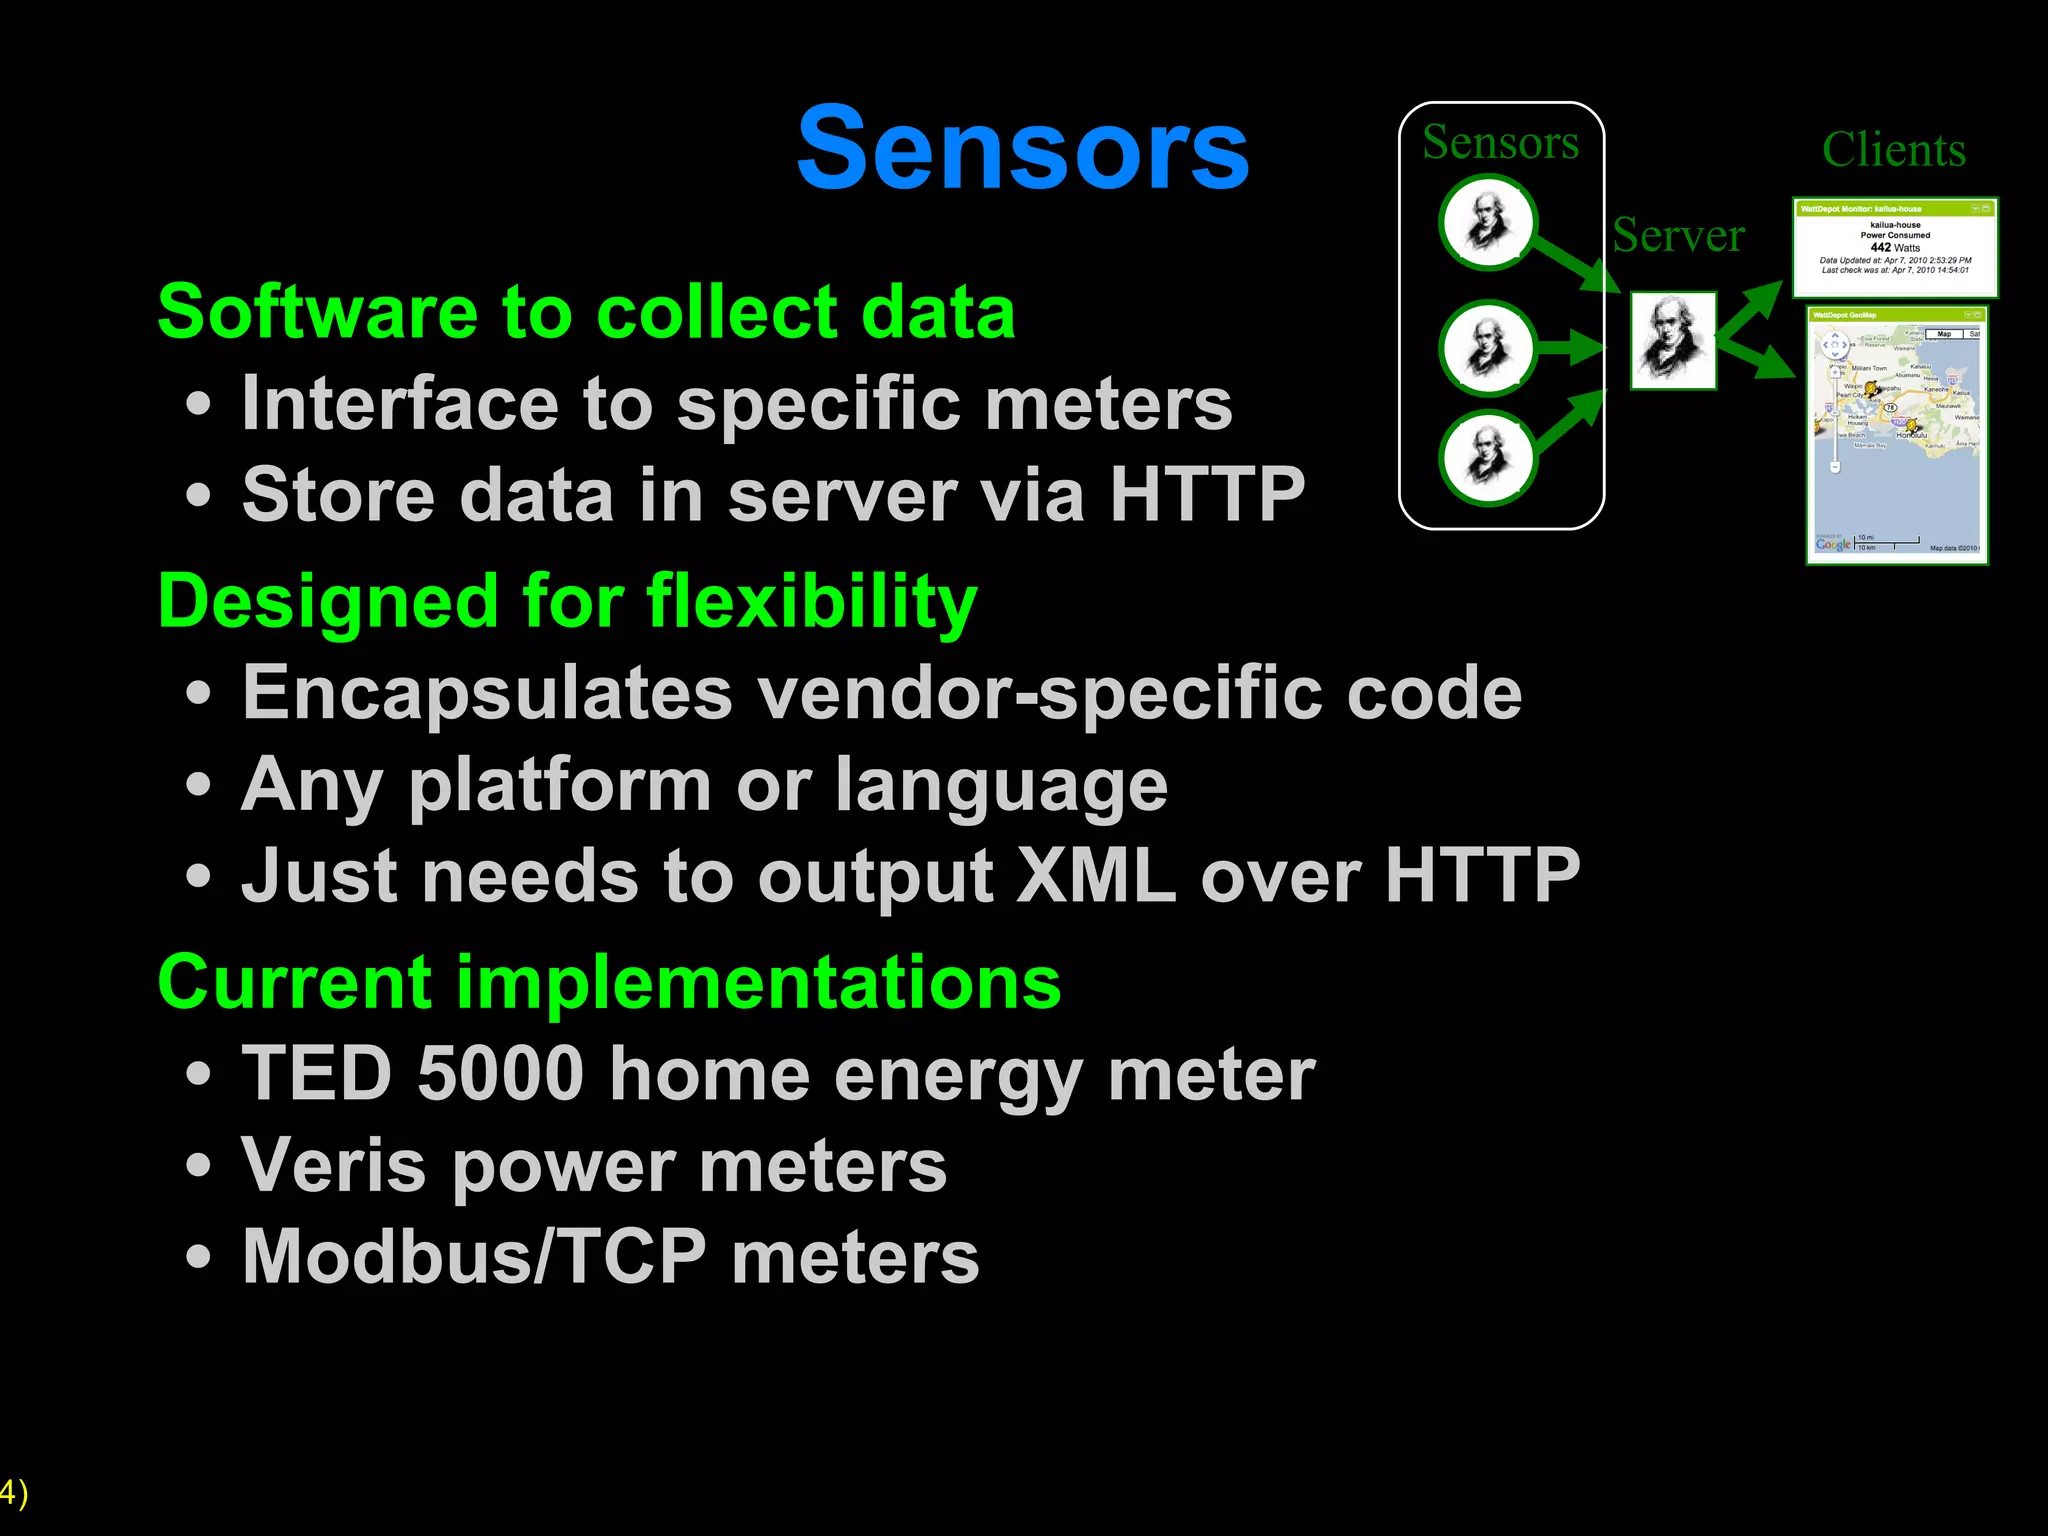
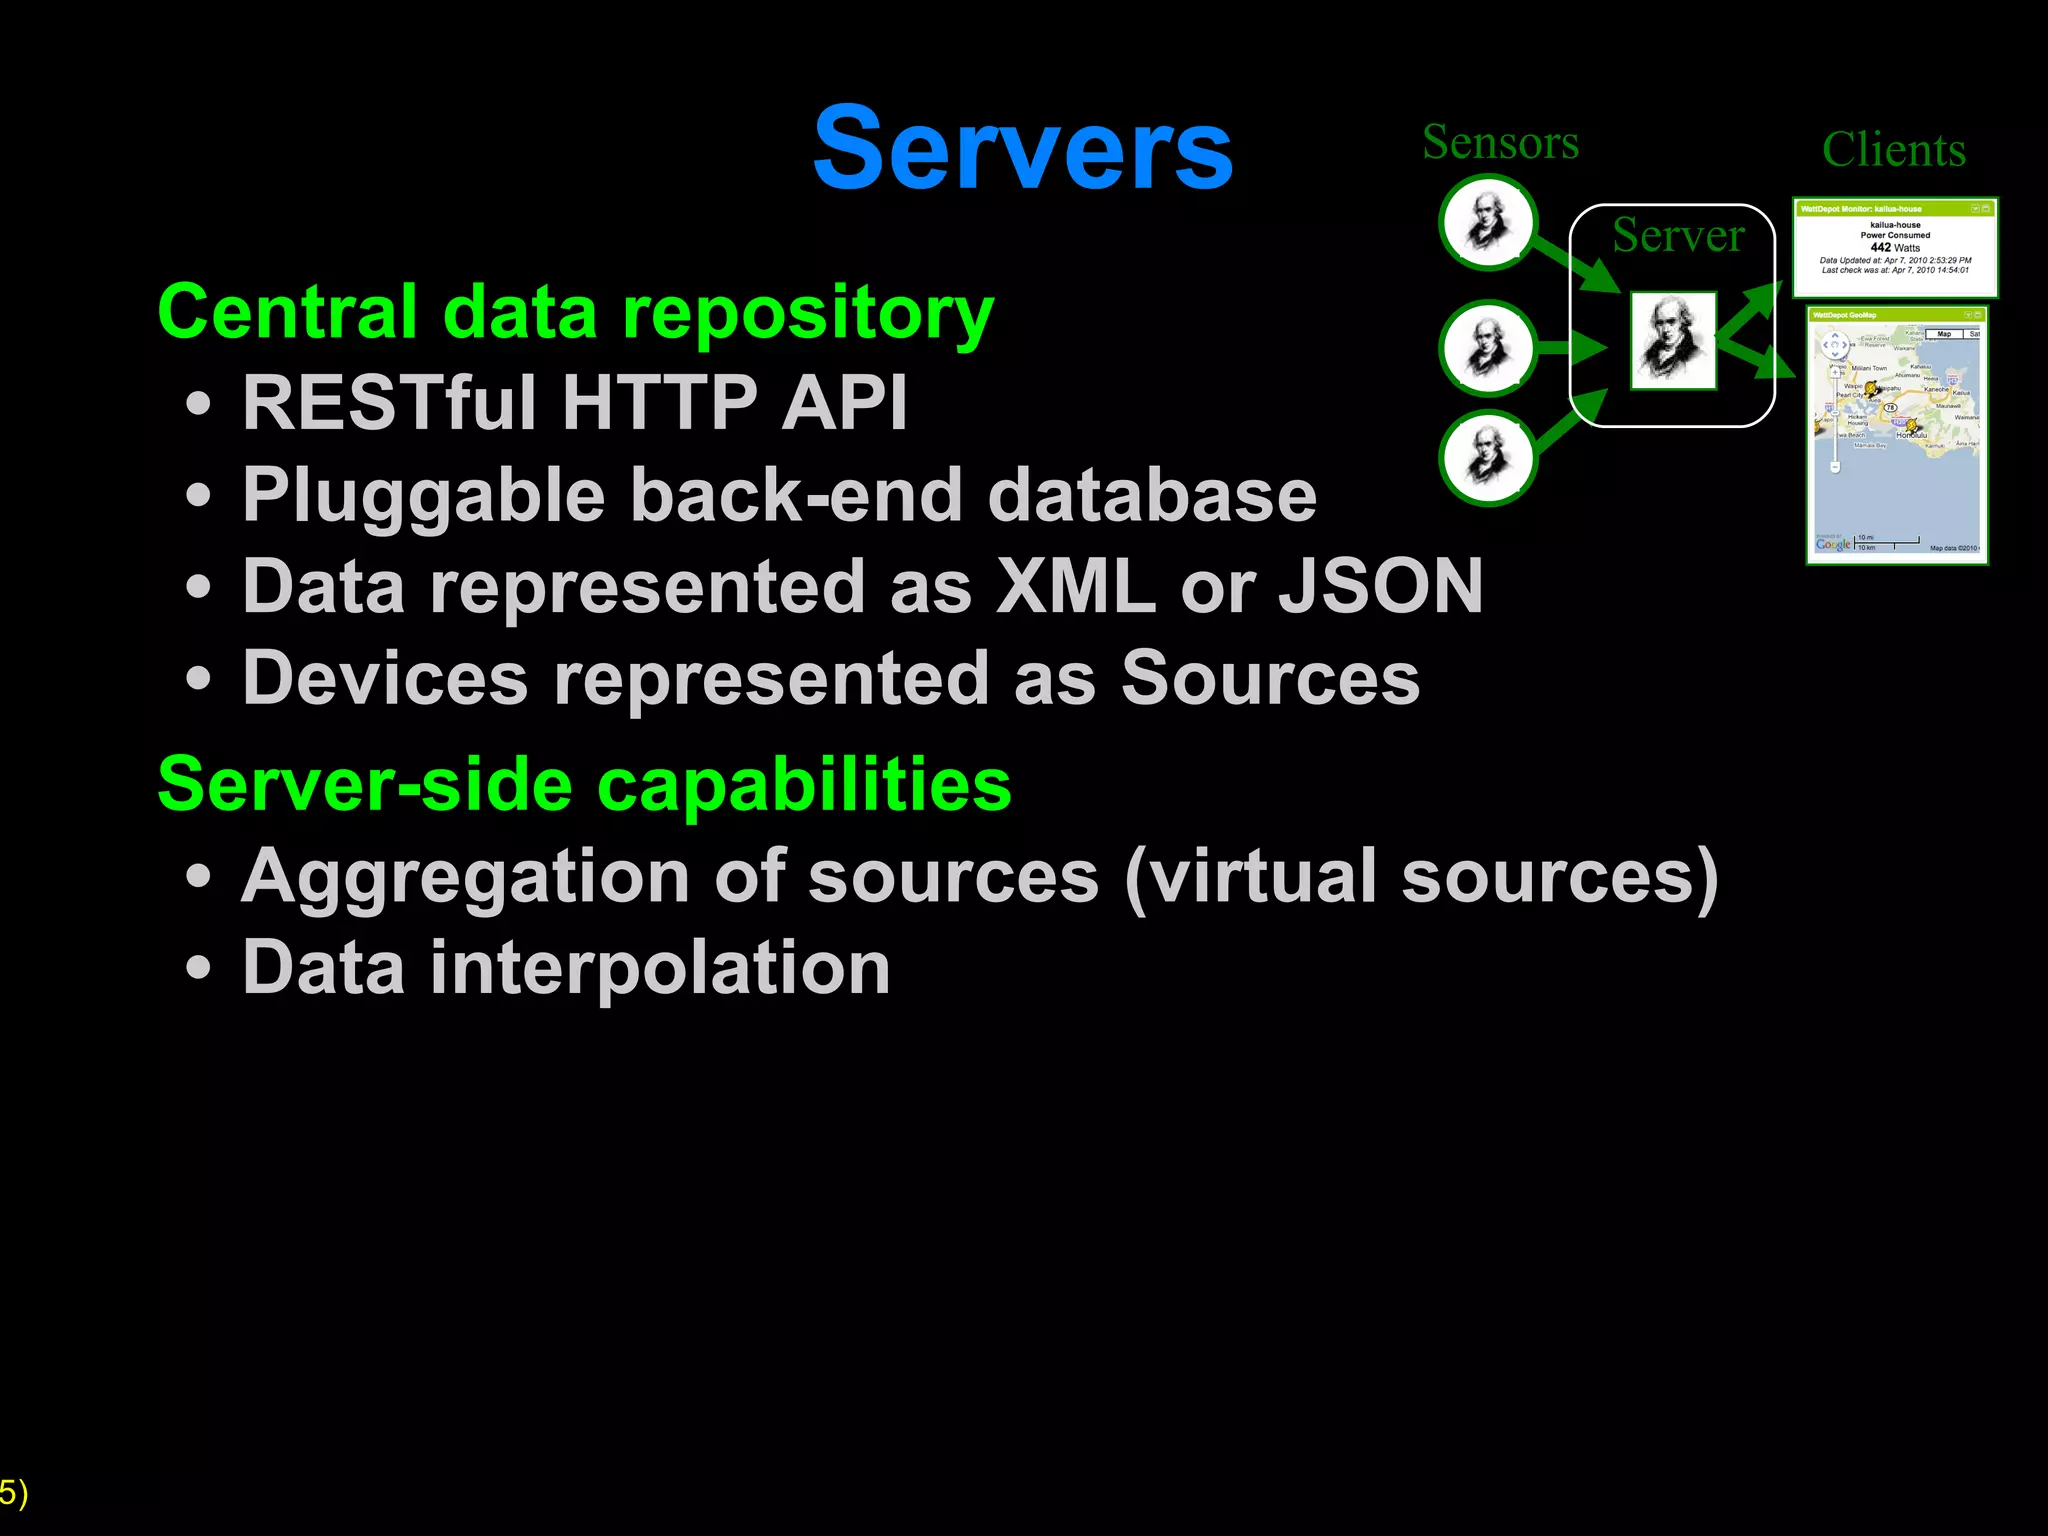
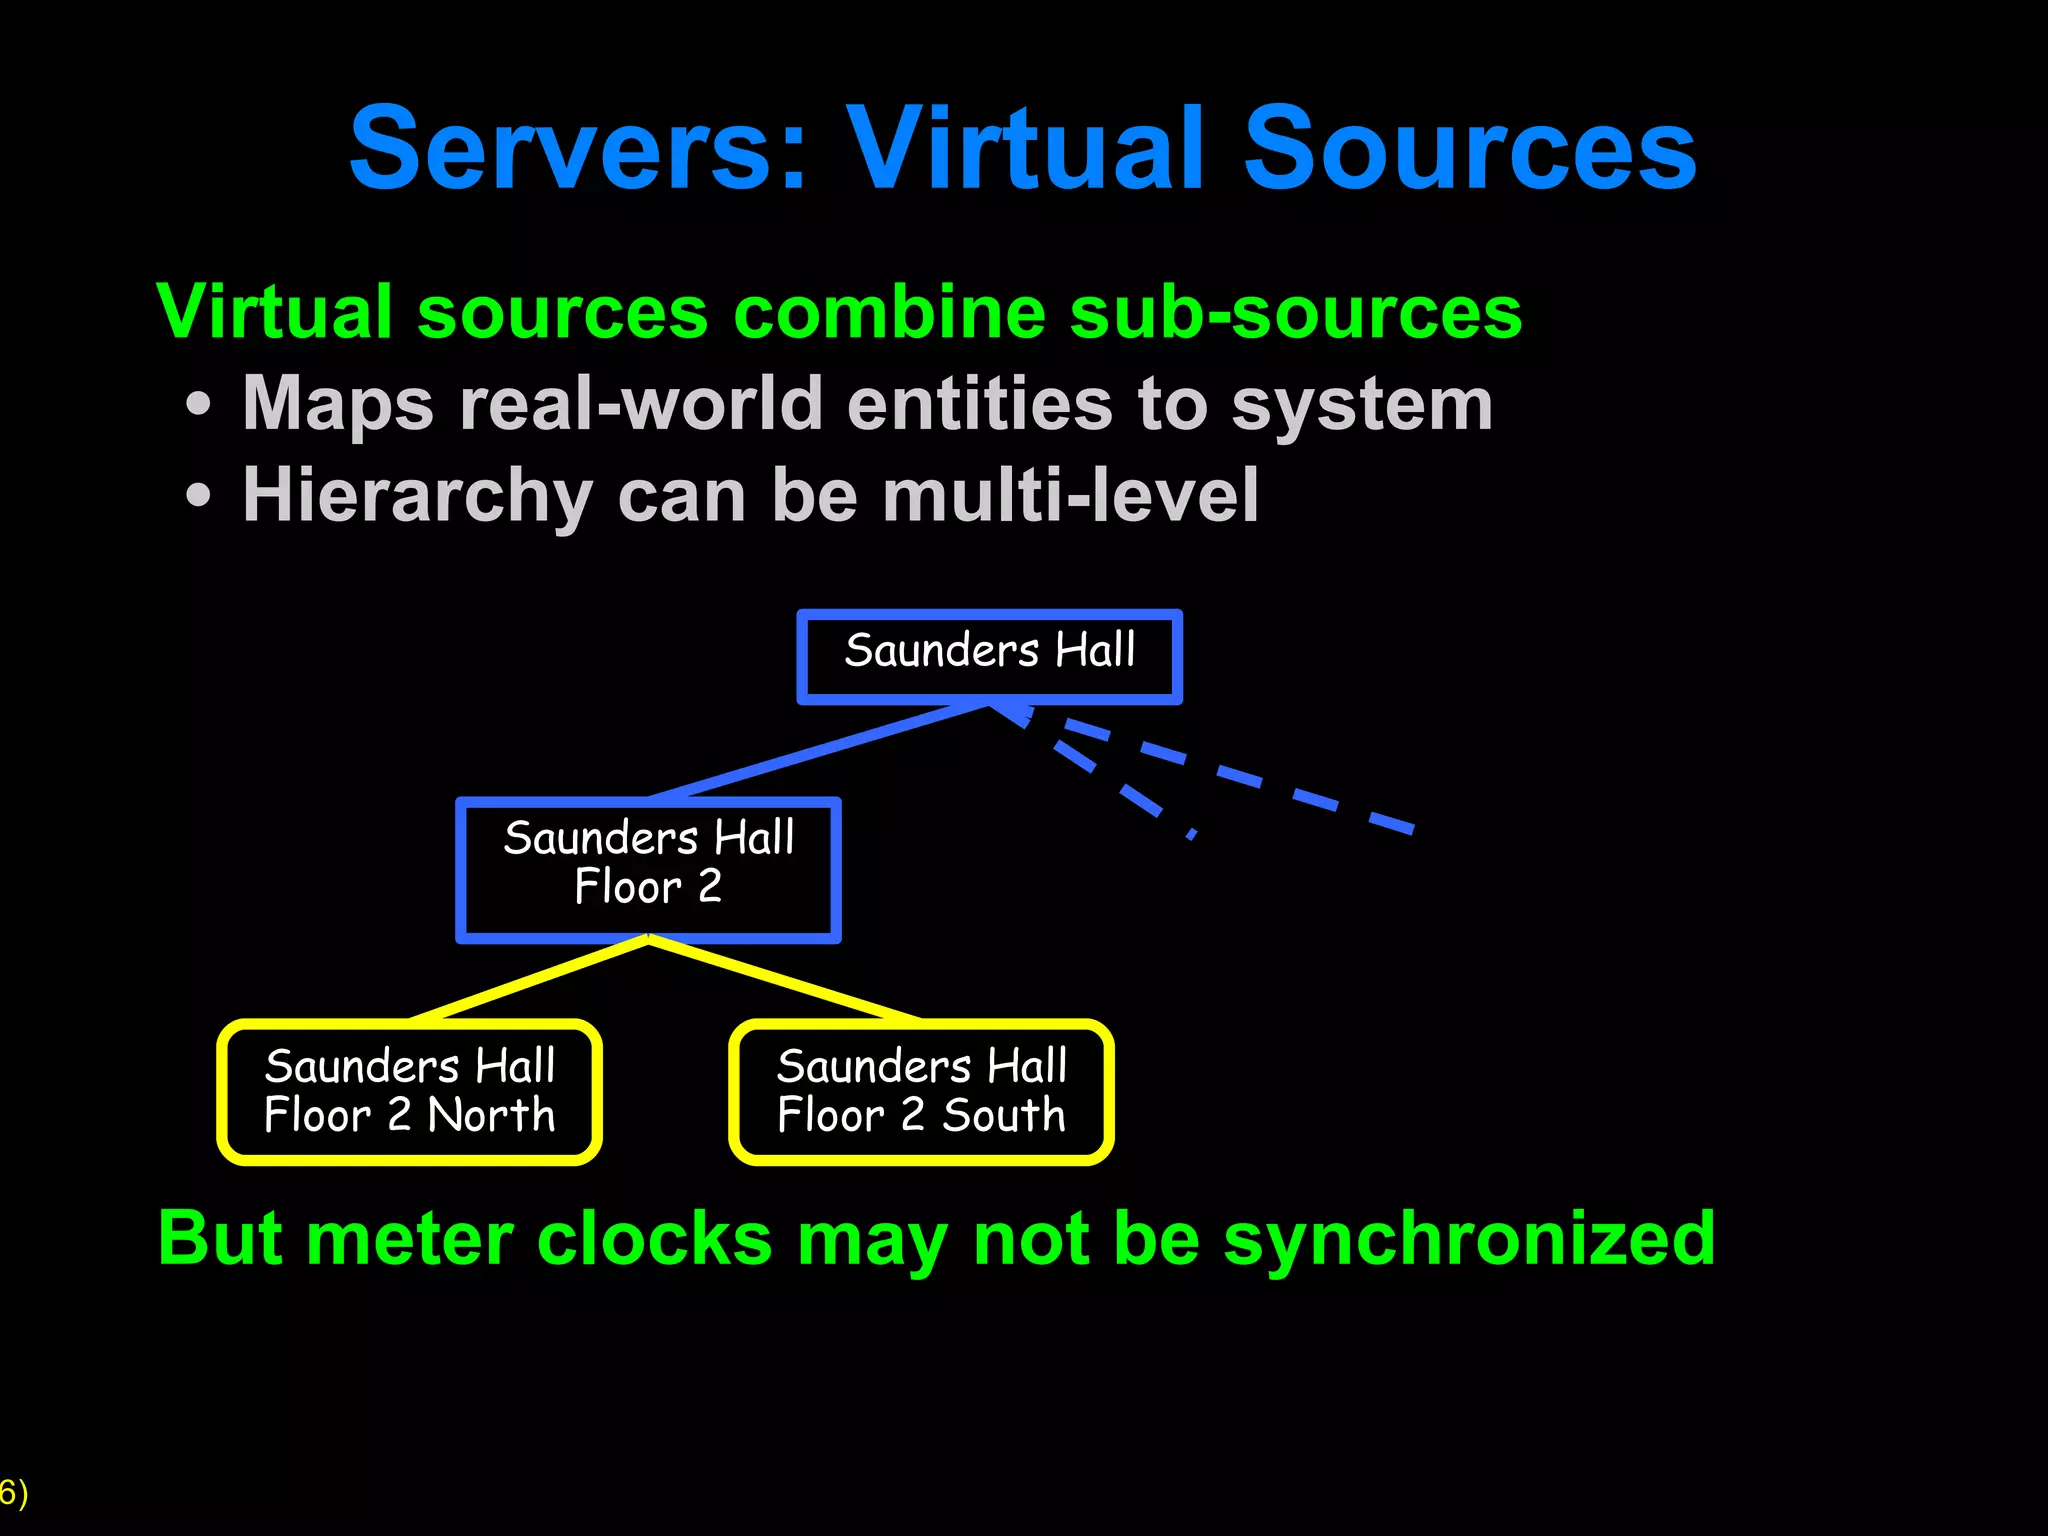
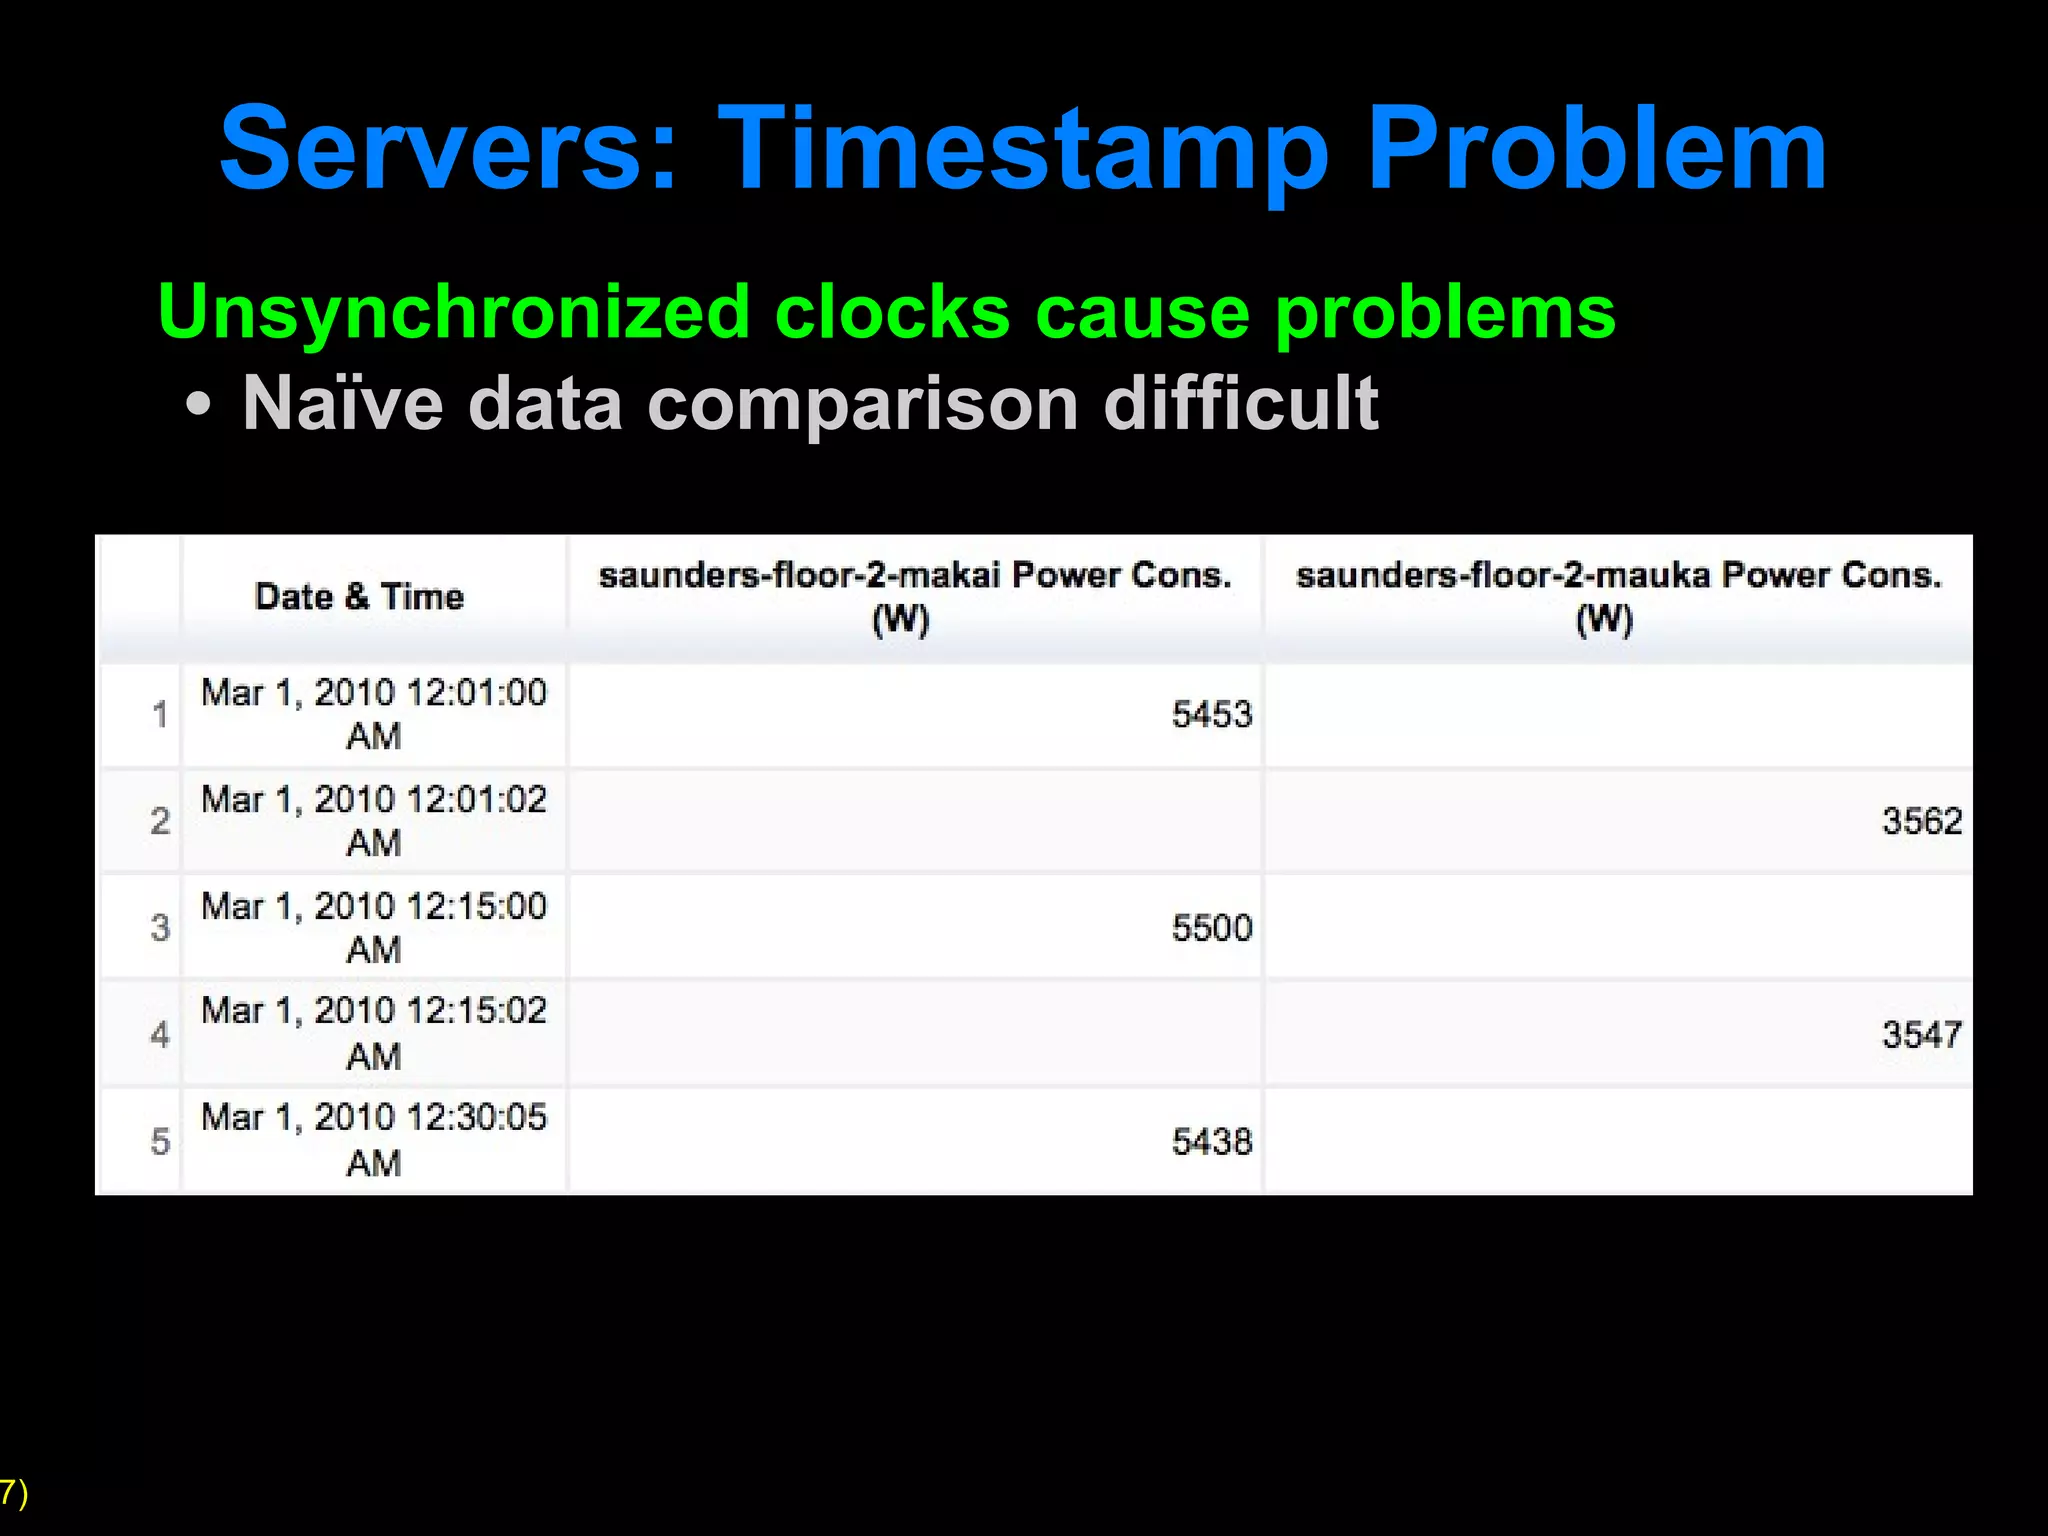
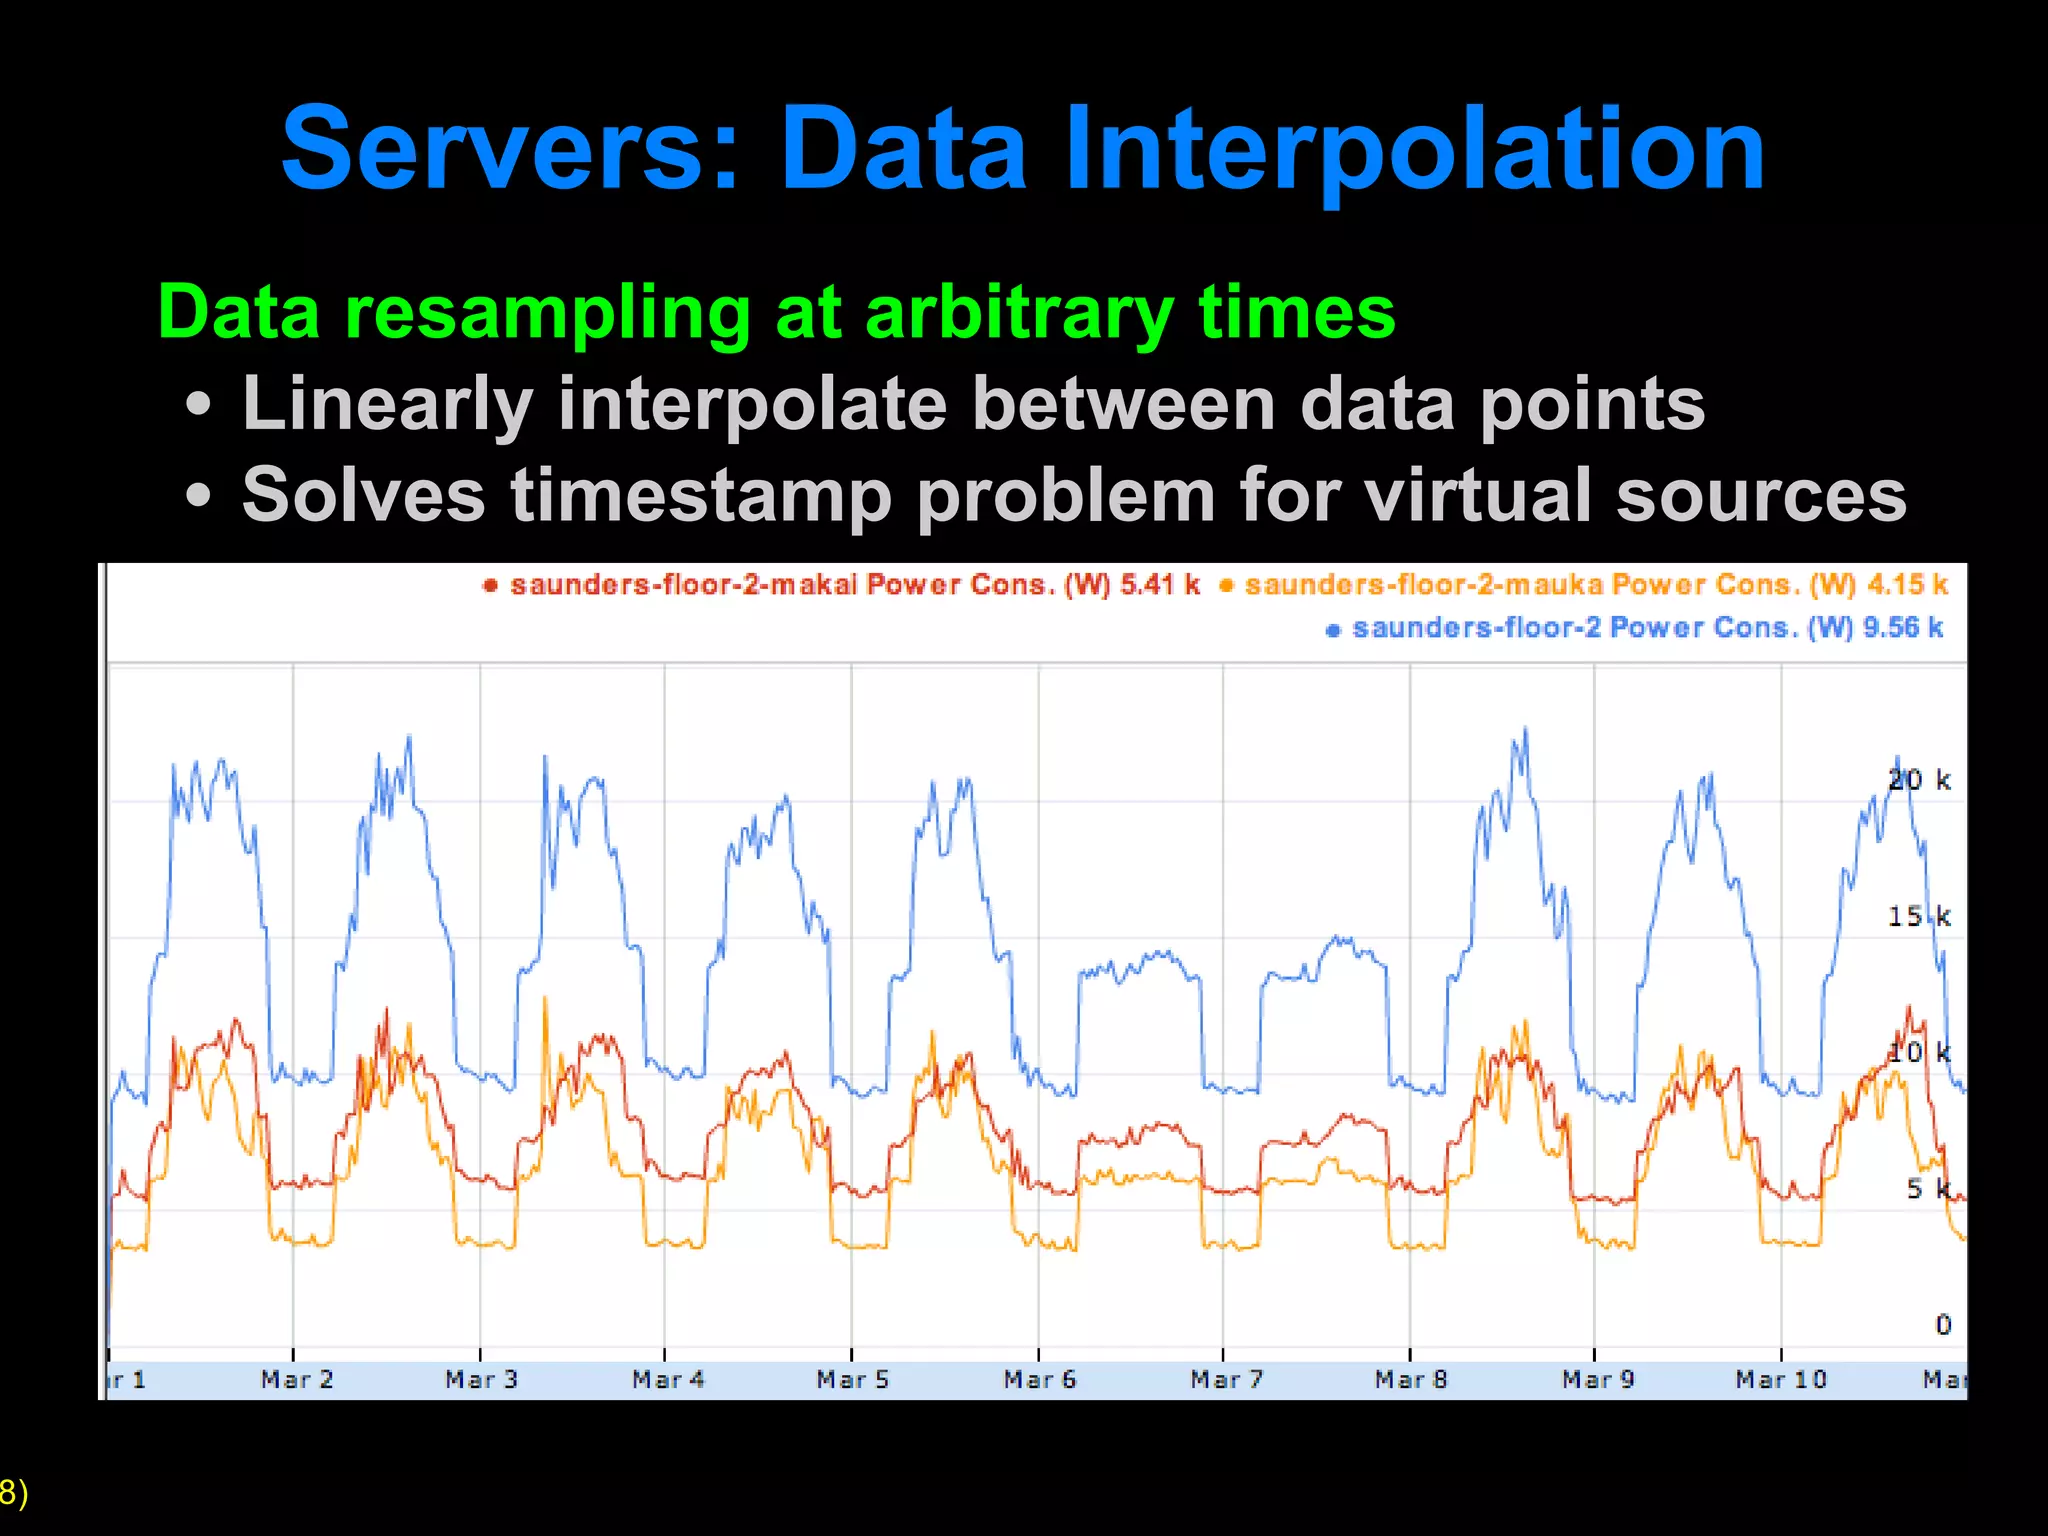
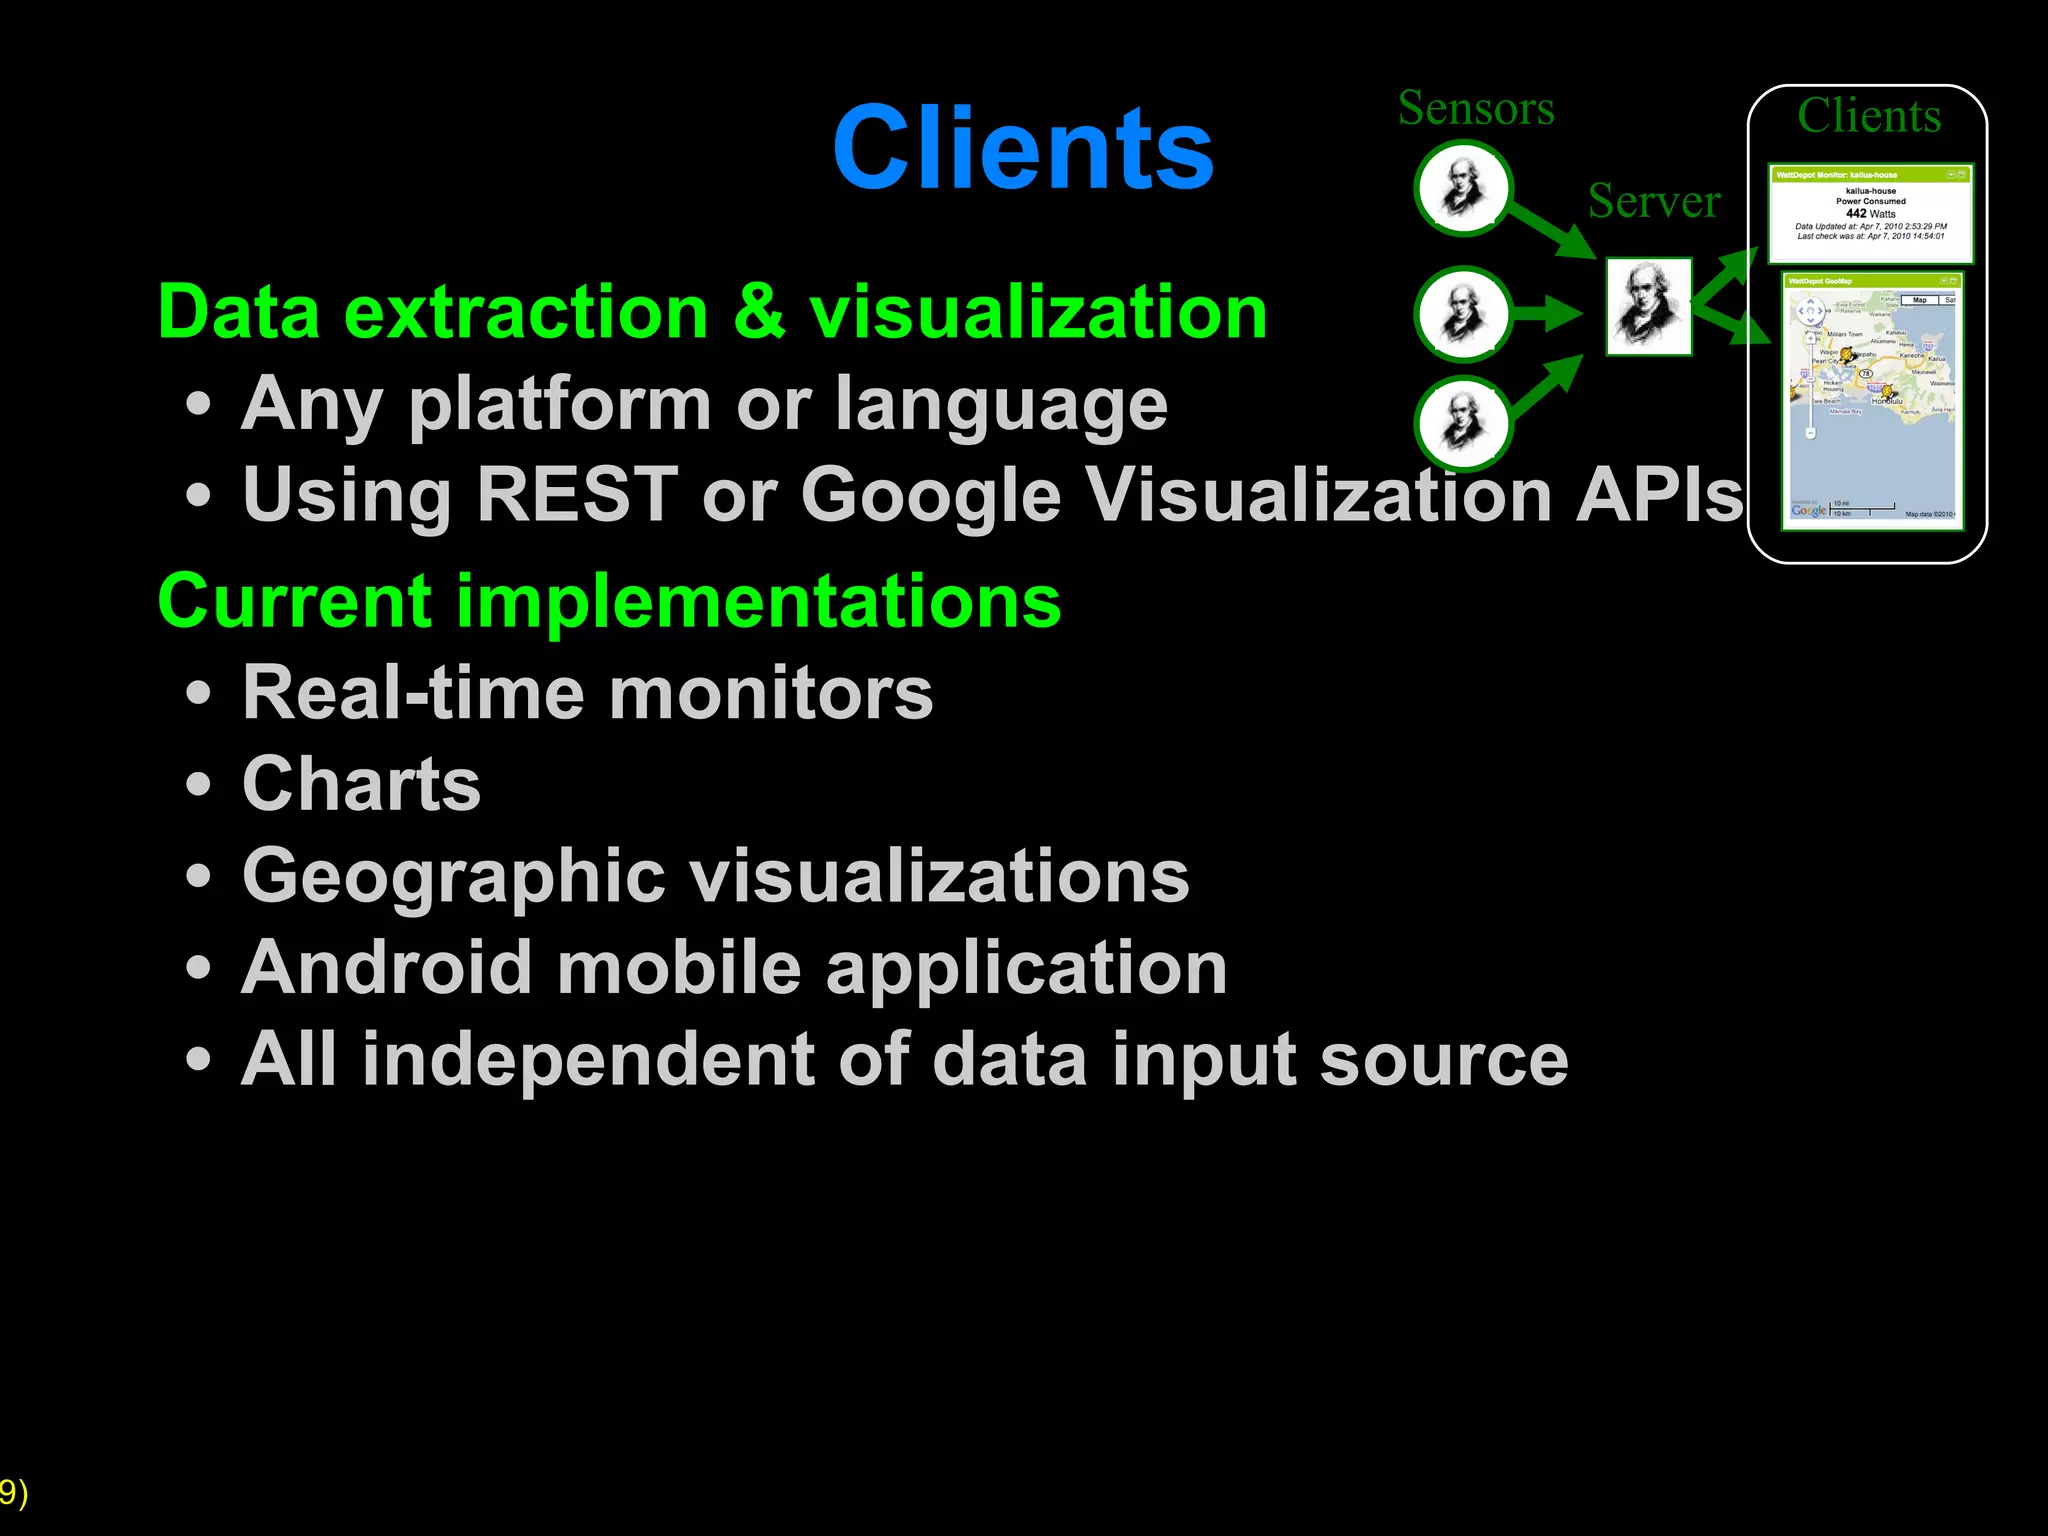
WattDepot: A software ecosystem for energy data collection, storage, analysis, and visualization Robert S. Brewer, Philip M. Johnson Collaborative Software Development Laboratory  Information and Computer Sciences Dept University of Hawaii at Manoa http://csdl.ics.hawaii.edu/
Motivation Research on changing energy use behaviors Need to collect & analyze energy data Requirements Collect data from many meters Sub-minute data collection Easy to simulate sensor data Internet-accessible repository Visualization variety & flexibility Open source Could not find an existing solution Developed WattDepot
Architecture Devices Meters WattDepot Sensors WattDepot Server WattDepot Clients HTTP HTTP
Sensors Software to collect data Interface to specific meters Store data in server via HTTP Designed for flexibility Encapsulates vendor-specific code Any platform or language Just needs to output XML over HTTP Current implementations TED 5000 home energy meter Veris power meters Modbus/TCP meters Sensors Server Clients
Servers Central data repository RESTful HTTP API Pluggable back-end database Data represented as XML or JSON Devices represented as Sources Server-side capabilities Aggregation of sources (virtual sources) Data interpolation Sensors Server Clients
Servers: Virtual Sources Virtual sources combine sub-sources Maps real-world entities to system Hierarchy can be multi-level But meter clocks may not be synchronized Saunders Hall Floor 2 North Saunders Hall Floor 2 South Saunders Hall Floor 2 Saunders Hall
Servers: Timestamp Problem Unsynchronized clocks cause problems Naïve data comparison difficult
Servers: Data Interpolation Data resampling at arbitrary times Linearly interpolate between data points Solves timestamp problem for virtual sources
Clients Data extraction & visualization Any platform or language Using REST or Google Visualization APIs Current implementations Real-time monitors Charts Geographic visualizations Android mobile application All independent of data input source Sensors Server Clients
Clients: Heatmap and Gauge
Clients: GeoMap
System Availability Hosted on Google Code http://wattdepot.googlecode.com/ Open source under New BSD license Discussion list http://groups.google.com/group/wattdepot-users
 

Introduction to WattDepot

  • 1.
    WattDepot: A softwareecosystem for energy data collection, storage, analysis, and visualization Robert S. Brewer, Philip M. Johnson Collaborative Software Development Laboratory Information and Computer Sciences Dept University of Hawaii at Manoa http://csdl.ics.hawaii.edu/
  • 2.
    Motivation Research onchanging energy use behaviors Need to collect & analyze energy data Requirements Collect data from many meters Sub-minute data collection Easy to simulate sensor data Internet-accessible repository Visualization variety & flexibility Open source Could not find an existing solution Developed WattDepot
  • 3.
    Architecture Devices MetersWattDepot Sensors WattDepot Server WattDepot Clients HTTP HTTP
  • 4.
    Sensors Software tocollect data Interface to specific meters Store data in server via HTTP Designed for flexibility Encapsulates vendor-specific code Any platform or language Just needs to output XML over HTTP Current implementations TED 5000 home energy meter Veris power meters Modbus/TCP meters Sensors Server Clients
  • 5.
    Servers Central datarepository RESTful HTTP API Pluggable back-end database Data represented as XML or JSON Devices represented as Sources Server-side capabilities Aggregation of sources (virtual sources) Data interpolation Sensors Server Clients
  • 6.
    Servers: Virtual SourcesVirtual sources combine sub-sources Maps real-world entities to system Hierarchy can be multi-level But meter clocks may not be synchronized Saunders Hall Floor 2 North Saunders Hall Floor 2 South Saunders Hall Floor 2 Saunders Hall
  • 7.
    Servers: Timestamp ProblemUnsynchronized clocks cause problems Naïve data comparison difficult
  • 8.
    Servers: Data InterpolationData resampling at arbitrary times Linearly interpolate between data points Solves timestamp problem for virtual sources
  • 9.
    Clients Data extraction& visualization Any platform or language Using REST or Google Visualization APIs Current implementations Real-time monitors Charts Geographic visualizations Android mobile application All independent of data input source Sensors Server Clients
  • 10.
  • 11.
  • 12.
    System Availability Hostedon Google Code http://wattdepot.googlecode.com/ Open source under New BSD license Discussion list http://groups.google.com/group/wattdepot-users
  • 13.