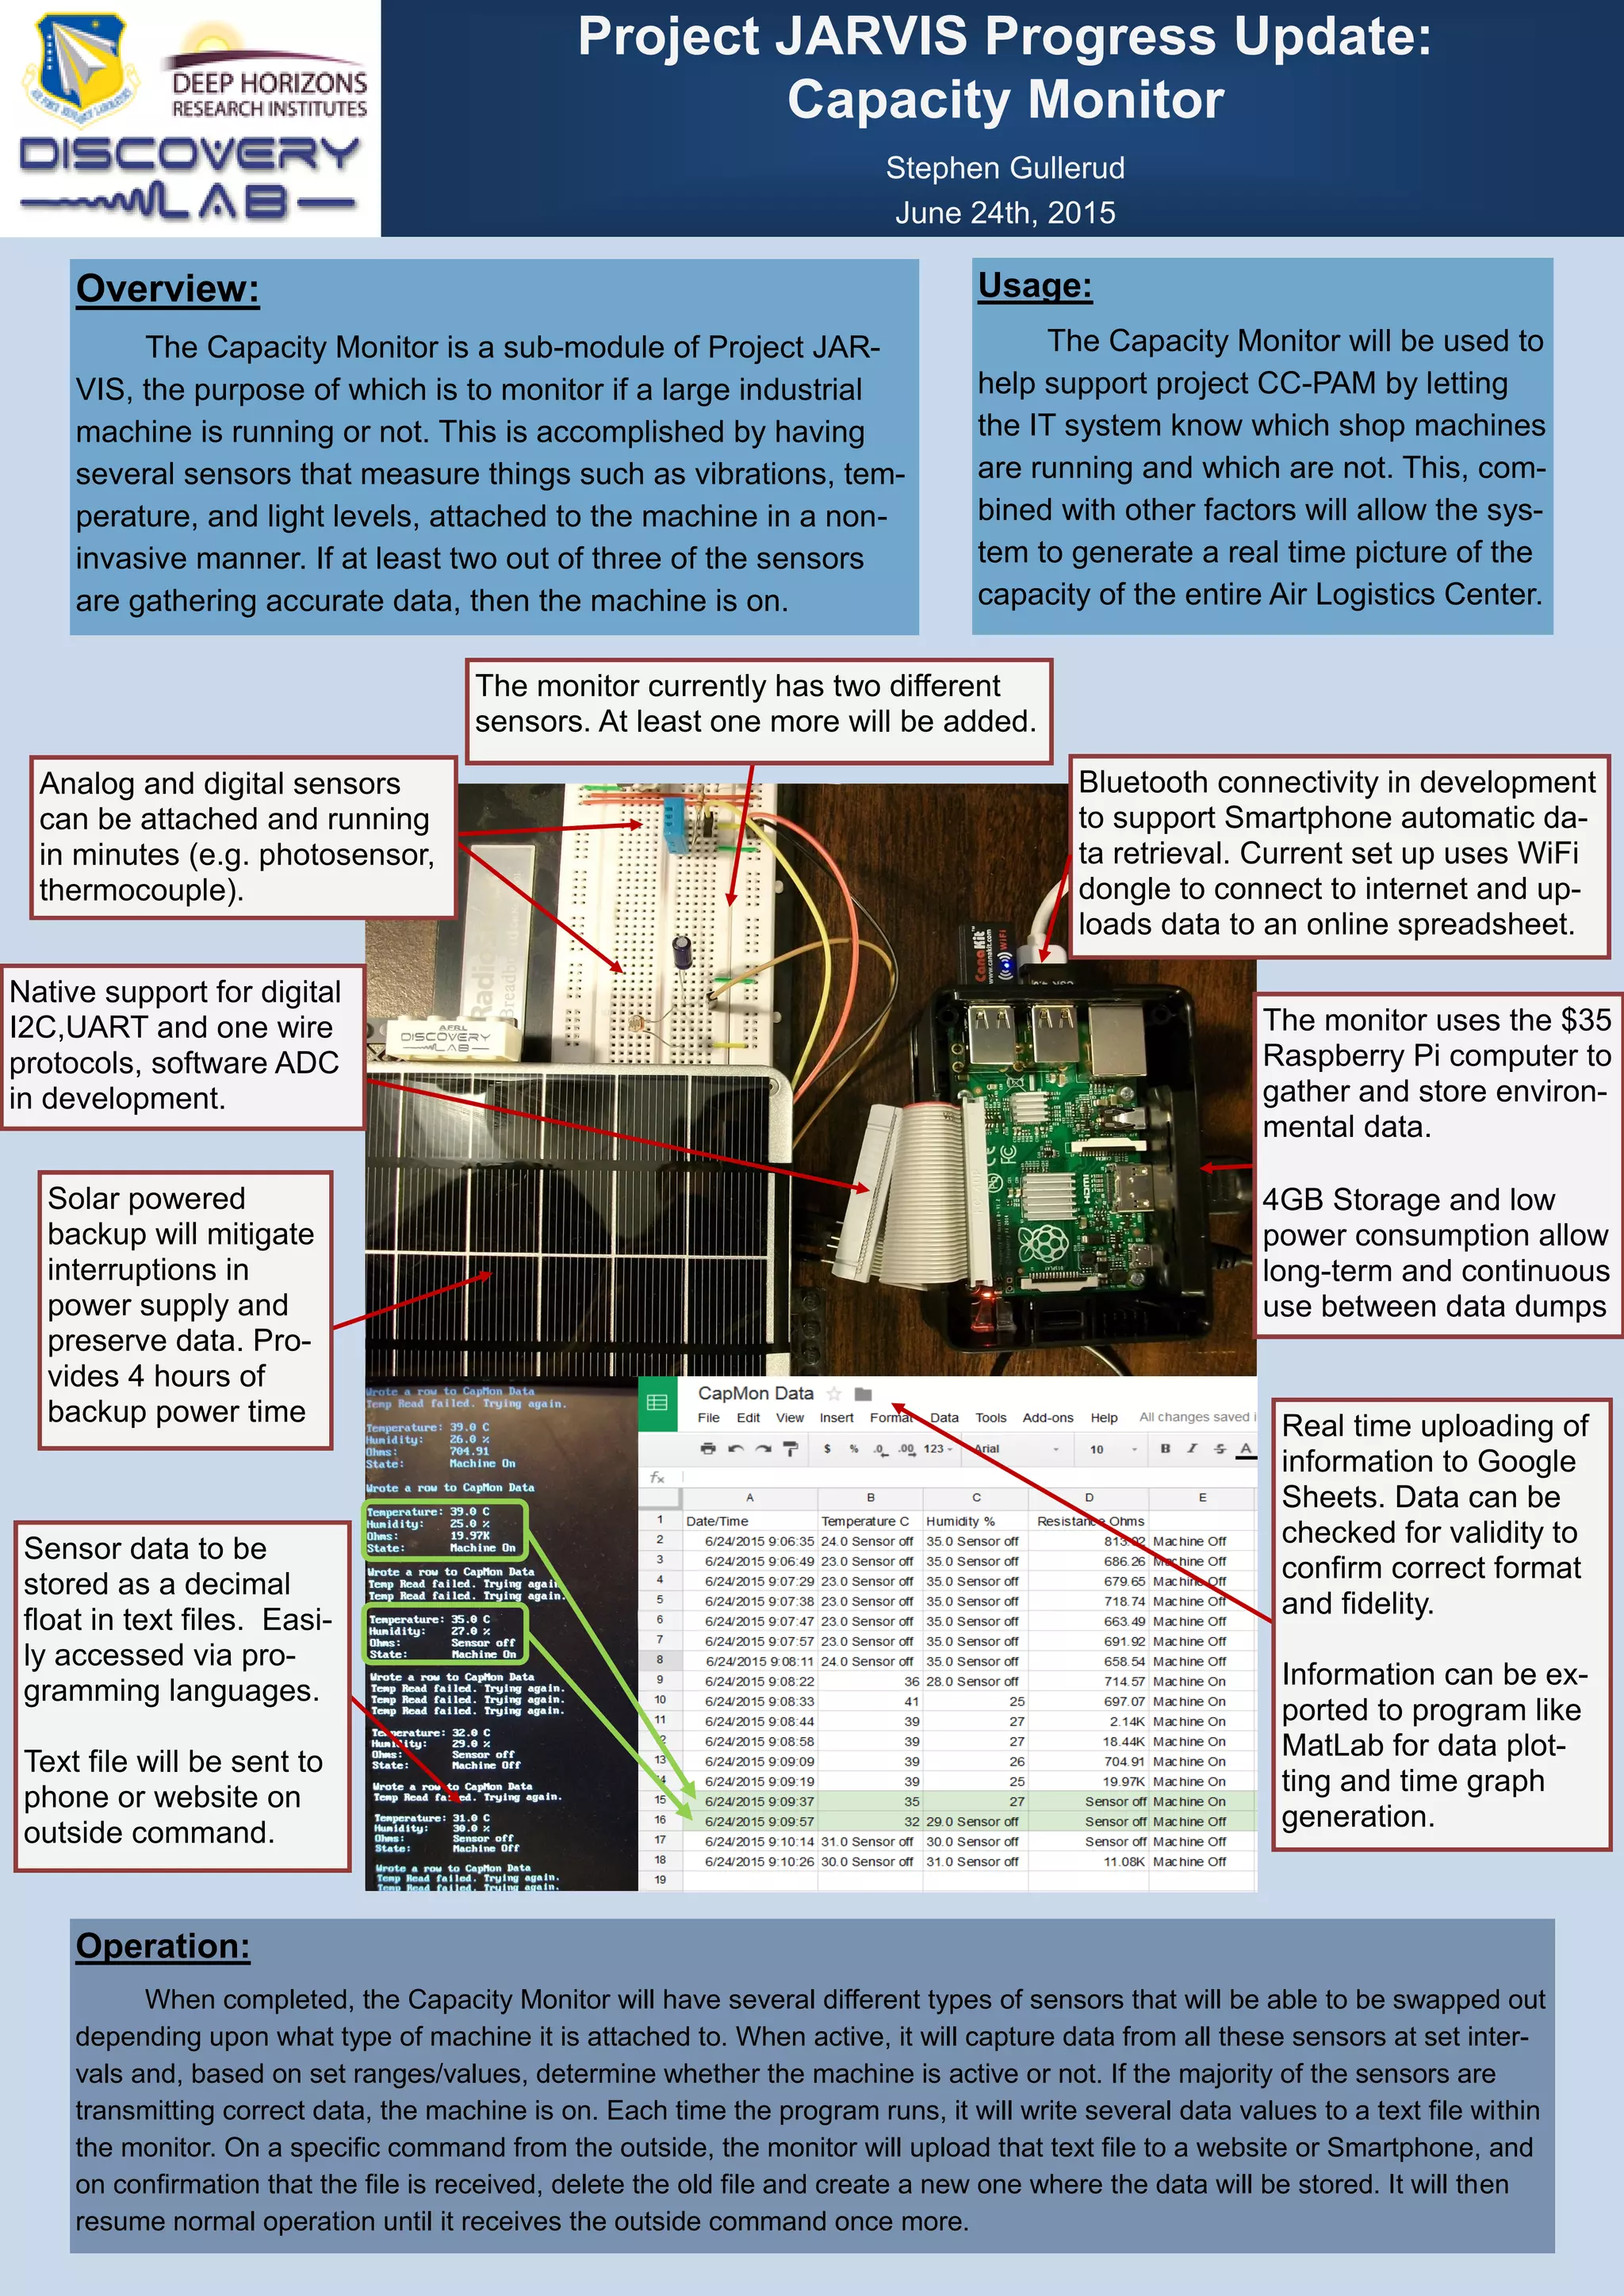
Project JARVIS Progress Update:
Capacity Monitor
Stephen Gullerud
June 24th, 2015
Usage:
The Capacity Monitor will be used to
help support project CC-PAM by letting
the IT system know which shop machines
are running and which are not. This, com-
bined with other factors will allow the sys-
tem to generate a real time picture of the
capacity of the entire Air Logistics Center.
Overview:
The Capacity Monitor is a sub-module of Project JAR-
VIS, the purpose of which is to monitor if a large industrial
machine is running or not. This is accomplished by having
several sensors that measure things such as vibrations, tem-
perature, and light levels, attached to the machine in a non-
invasive manner. If at least two out of three of the sensors
are gathering accurate data, then the machine is on.
Bluetooth connectivity in development
to support Smartphone automatic da-
ta retrieval. Current set up uses WiFi
dongle to connect to internet and up-
loads data to an online spreadsheet.
Native support for digital
I2C,UART and one wire
protocols, software ADC
in development.
Operation:
When completed, the Capacity Monitor will have several different types of sensors that will be able to be swapped out
depending upon what type of machine it is attached to. When active, it will capture data from all these sensors at set inter-
vals and, based on set ranges/values, determine whether the machine is active or not. If the majority of the sensors are
transmitting correct data, the machine is on. Each time the program runs, it will write several data values to a text file within
the monitor. On a specific command from the outside, the monitor will upload that text file to a website or Smartphone, and
on confirmation that the file is received, delete the old file and create a new one where the data will be stored. It will then
resume normal operation until it receives the outside command once more.
The monitor currently has two different
sensors. At least one more will be added.
The monitor uses the $35
Raspberry Pi computer to
gather and store environ-
mental data.
4GB Storage and low
power consumption allow
long-term and continuous
use between data dumps
Real time uploading of
information to Google
Sheets. Data can be
checked for validity to
confirm correct format
and fidelity.
Information can be ex-
ported to program like
MatLab for data plot-
ting and time graph
generation.
Sensor data to be
stored as a decimal
float in text files. Easi-
ly accessed via pro-
gramming languages.
Text file will be sent to
phone or website on
outside command.
Solar powered
backup will mitigate
interruptions in
power supply and
preserve data. Pro-
vides 4 hours of
backup power time
Analog and digital sensors
can be attached and running
in minutes (e.g. photosensor,
thermocouple).

CapMonPosterweb

  • 1.
    Project JARVIS ProgressUpdate: Capacity Monitor Stephen Gullerud June 24th, 2015 Usage: The Capacity Monitor will be used to help support project CC-PAM by letting the IT system know which shop machines are running and which are not. This, com- bined with other factors will allow the sys- tem to generate a real time picture of the capacity of the entire Air Logistics Center. Overview: The Capacity Monitor is a sub-module of Project JAR- VIS, the purpose of which is to monitor if a large industrial machine is running or not. This is accomplished by having several sensors that measure things such as vibrations, tem- perature, and light levels, attached to the machine in a non- invasive manner. If at least two out of three of the sensors are gathering accurate data, then the machine is on. Bluetooth connectivity in development to support Smartphone automatic da- ta retrieval. Current set up uses WiFi dongle to connect to internet and up- loads data to an online spreadsheet. Native support for digital I2C,UART and one wire protocols, software ADC in development. Operation: When completed, the Capacity Monitor will have several different types of sensors that will be able to be swapped out depending upon what type of machine it is attached to. When active, it will capture data from all these sensors at set inter- vals and, based on set ranges/values, determine whether the machine is active or not. If the majority of the sensors are transmitting correct data, the machine is on. Each time the program runs, it will write several data values to a text file within the monitor. On a specific command from the outside, the monitor will upload that text file to a website or Smartphone, and on confirmation that the file is received, delete the old file and create a new one where the data will be stored. It will then resume normal operation until it receives the outside command once more. The monitor currently has two different sensors. At least one more will be added. The monitor uses the $35 Raspberry Pi computer to gather and store environ- mental data. 4GB Storage and low power consumption allow long-term and continuous use between data dumps Real time uploading of information to Google Sheets. Data can be checked for validity to confirm correct format and fidelity. Information can be ex- ported to program like MatLab for data plot- ting and time graph generation. Sensor data to be stored as a decimal float in text files. Easi- ly accessed via pro- gramming languages. Text file will be sent to phone or website on outside command. Solar powered backup will mitigate interruptions in power supply and preserve data. Pro- vides 4 hours of backup power time Analog and digital sensors can be attached and running in minutes (e.g. photosensor, thermocouple).