Download to read offline
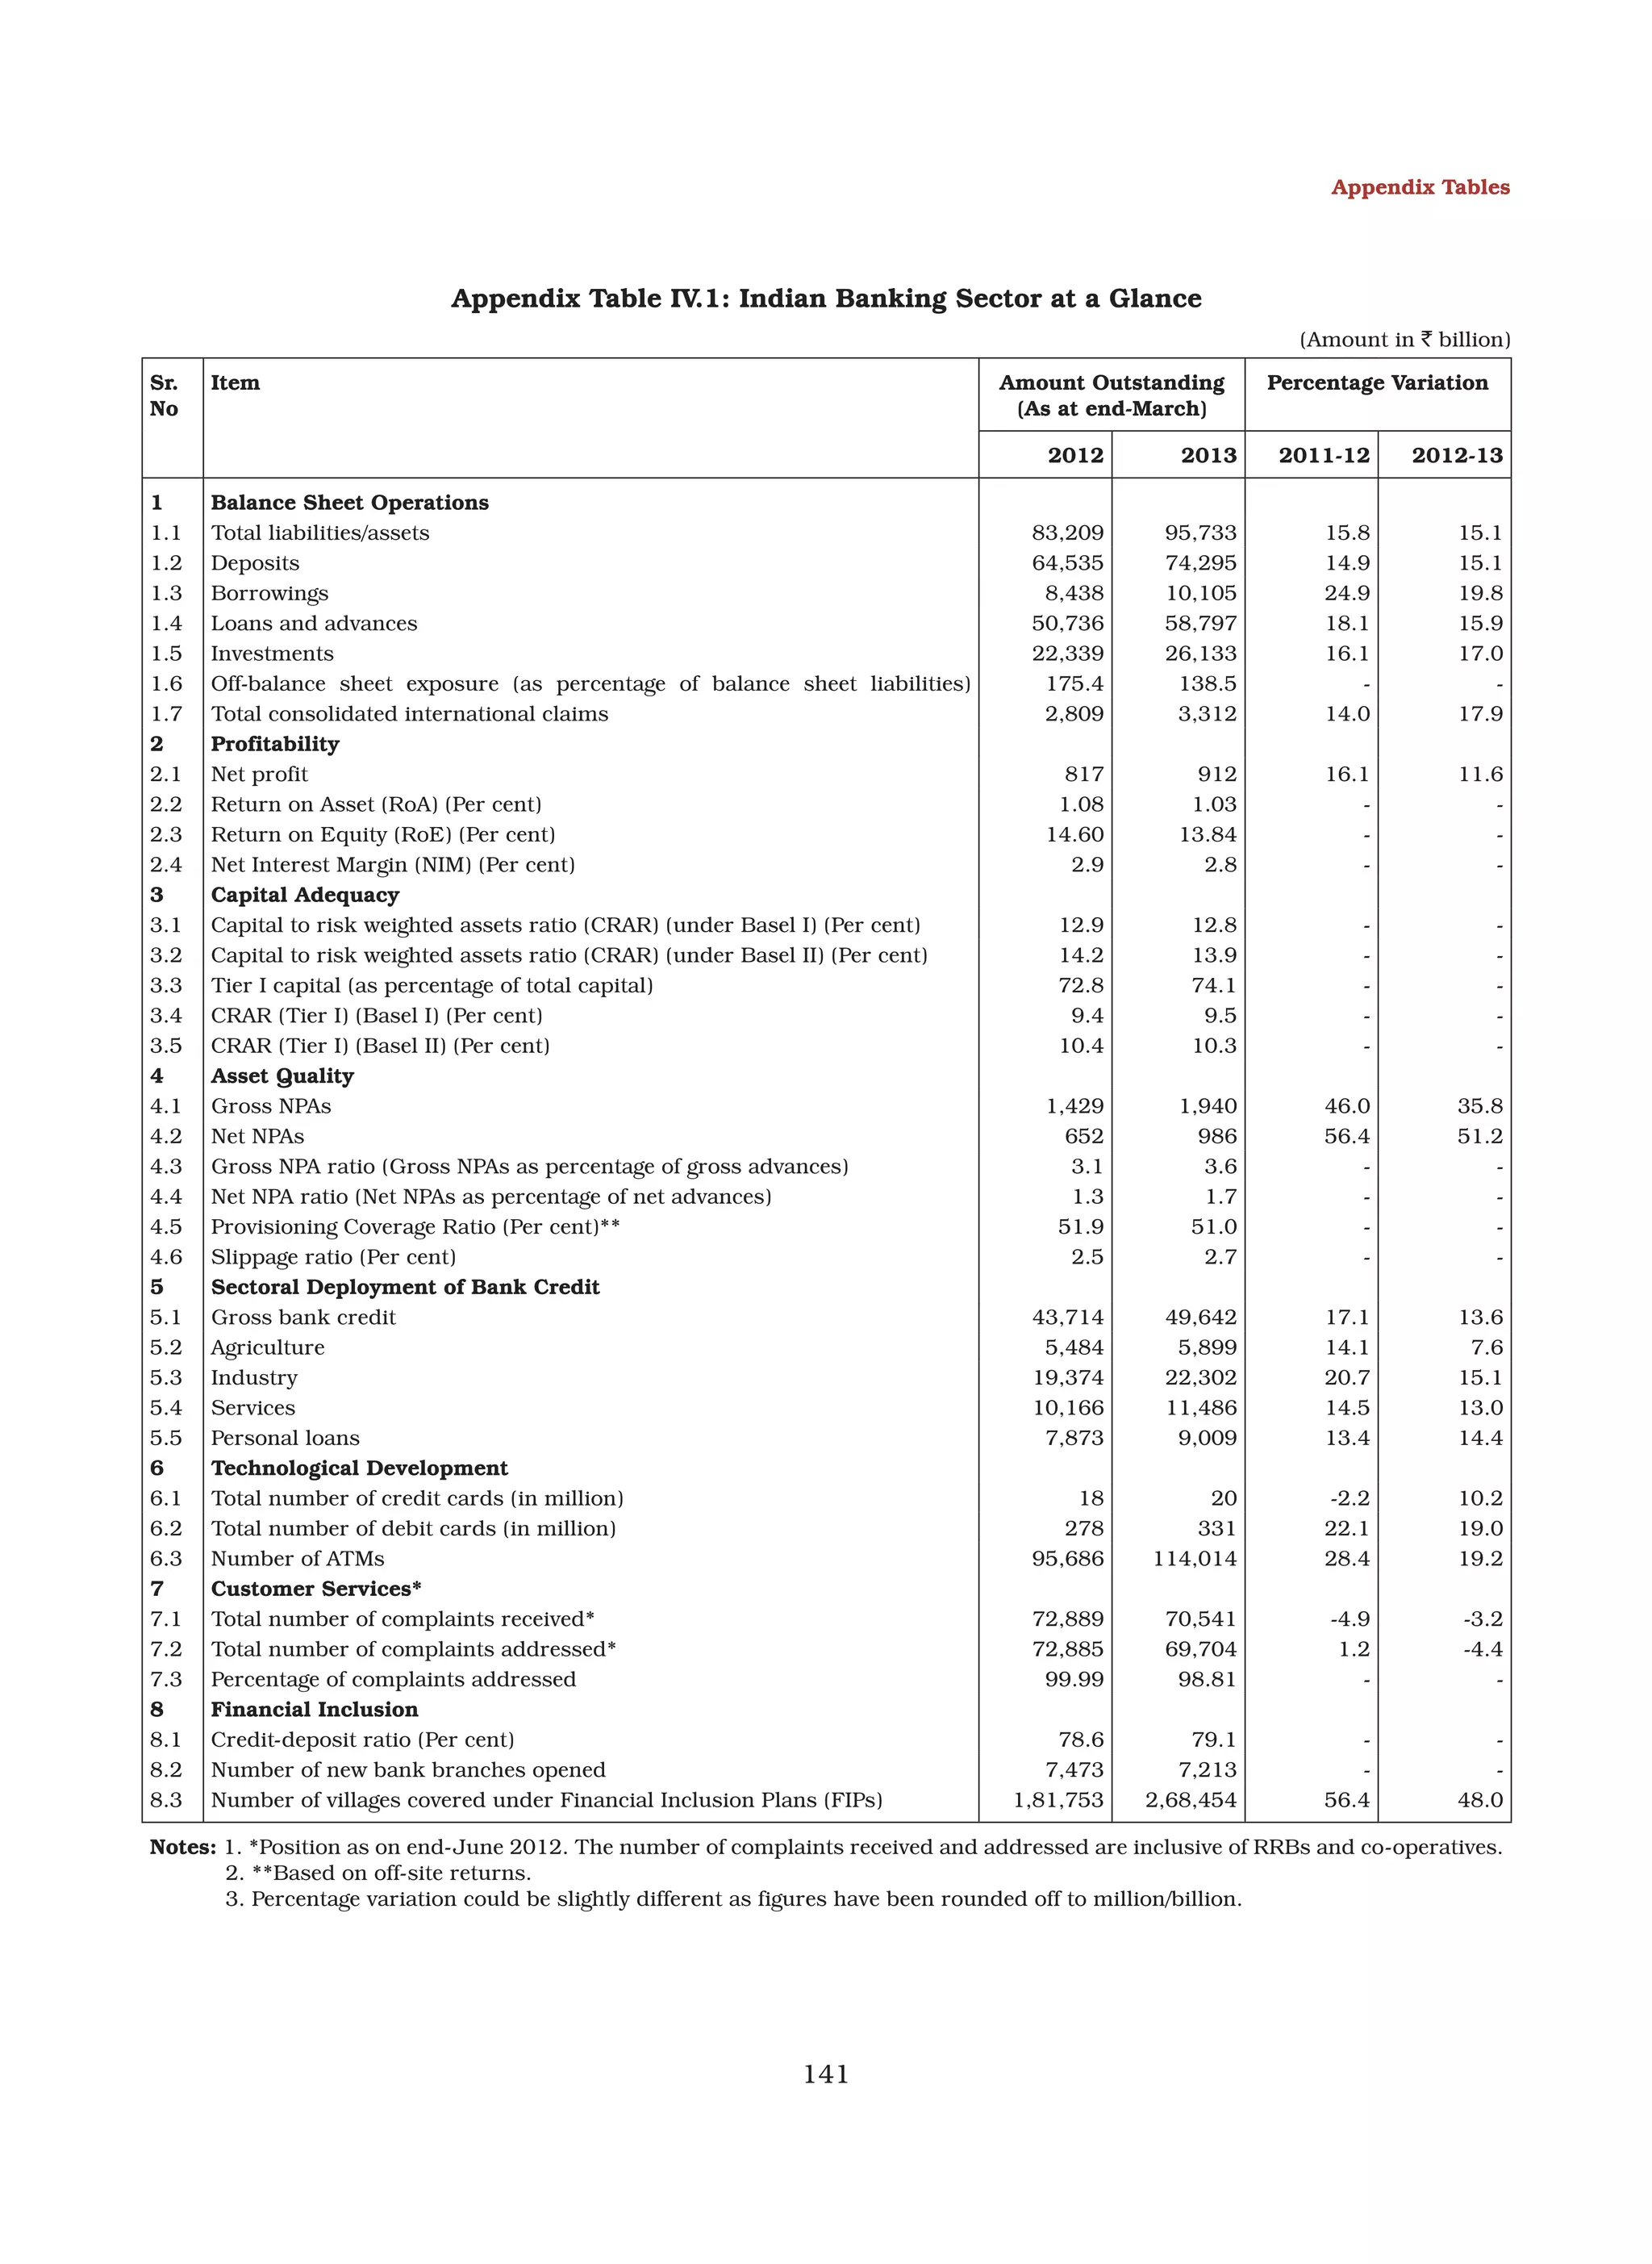

This table provides an overview of key metrics of the Indian banking sector as of end-March 2012 and end-March 2013. Some of the key figures shown include total assets reaching $95.7 trillion in 2013, deposits of $74.3 trillion, and gross loans of $58.8 trillion. Non-performing assets stood at 3.6% of gross advances in 2013. The capital adequacy ratio under Basel II was 13.9% in 2013, meeting regulatory requirements. Financial inclusion initiatives have expanded access, with over 268 million villages now covered under such plans.


