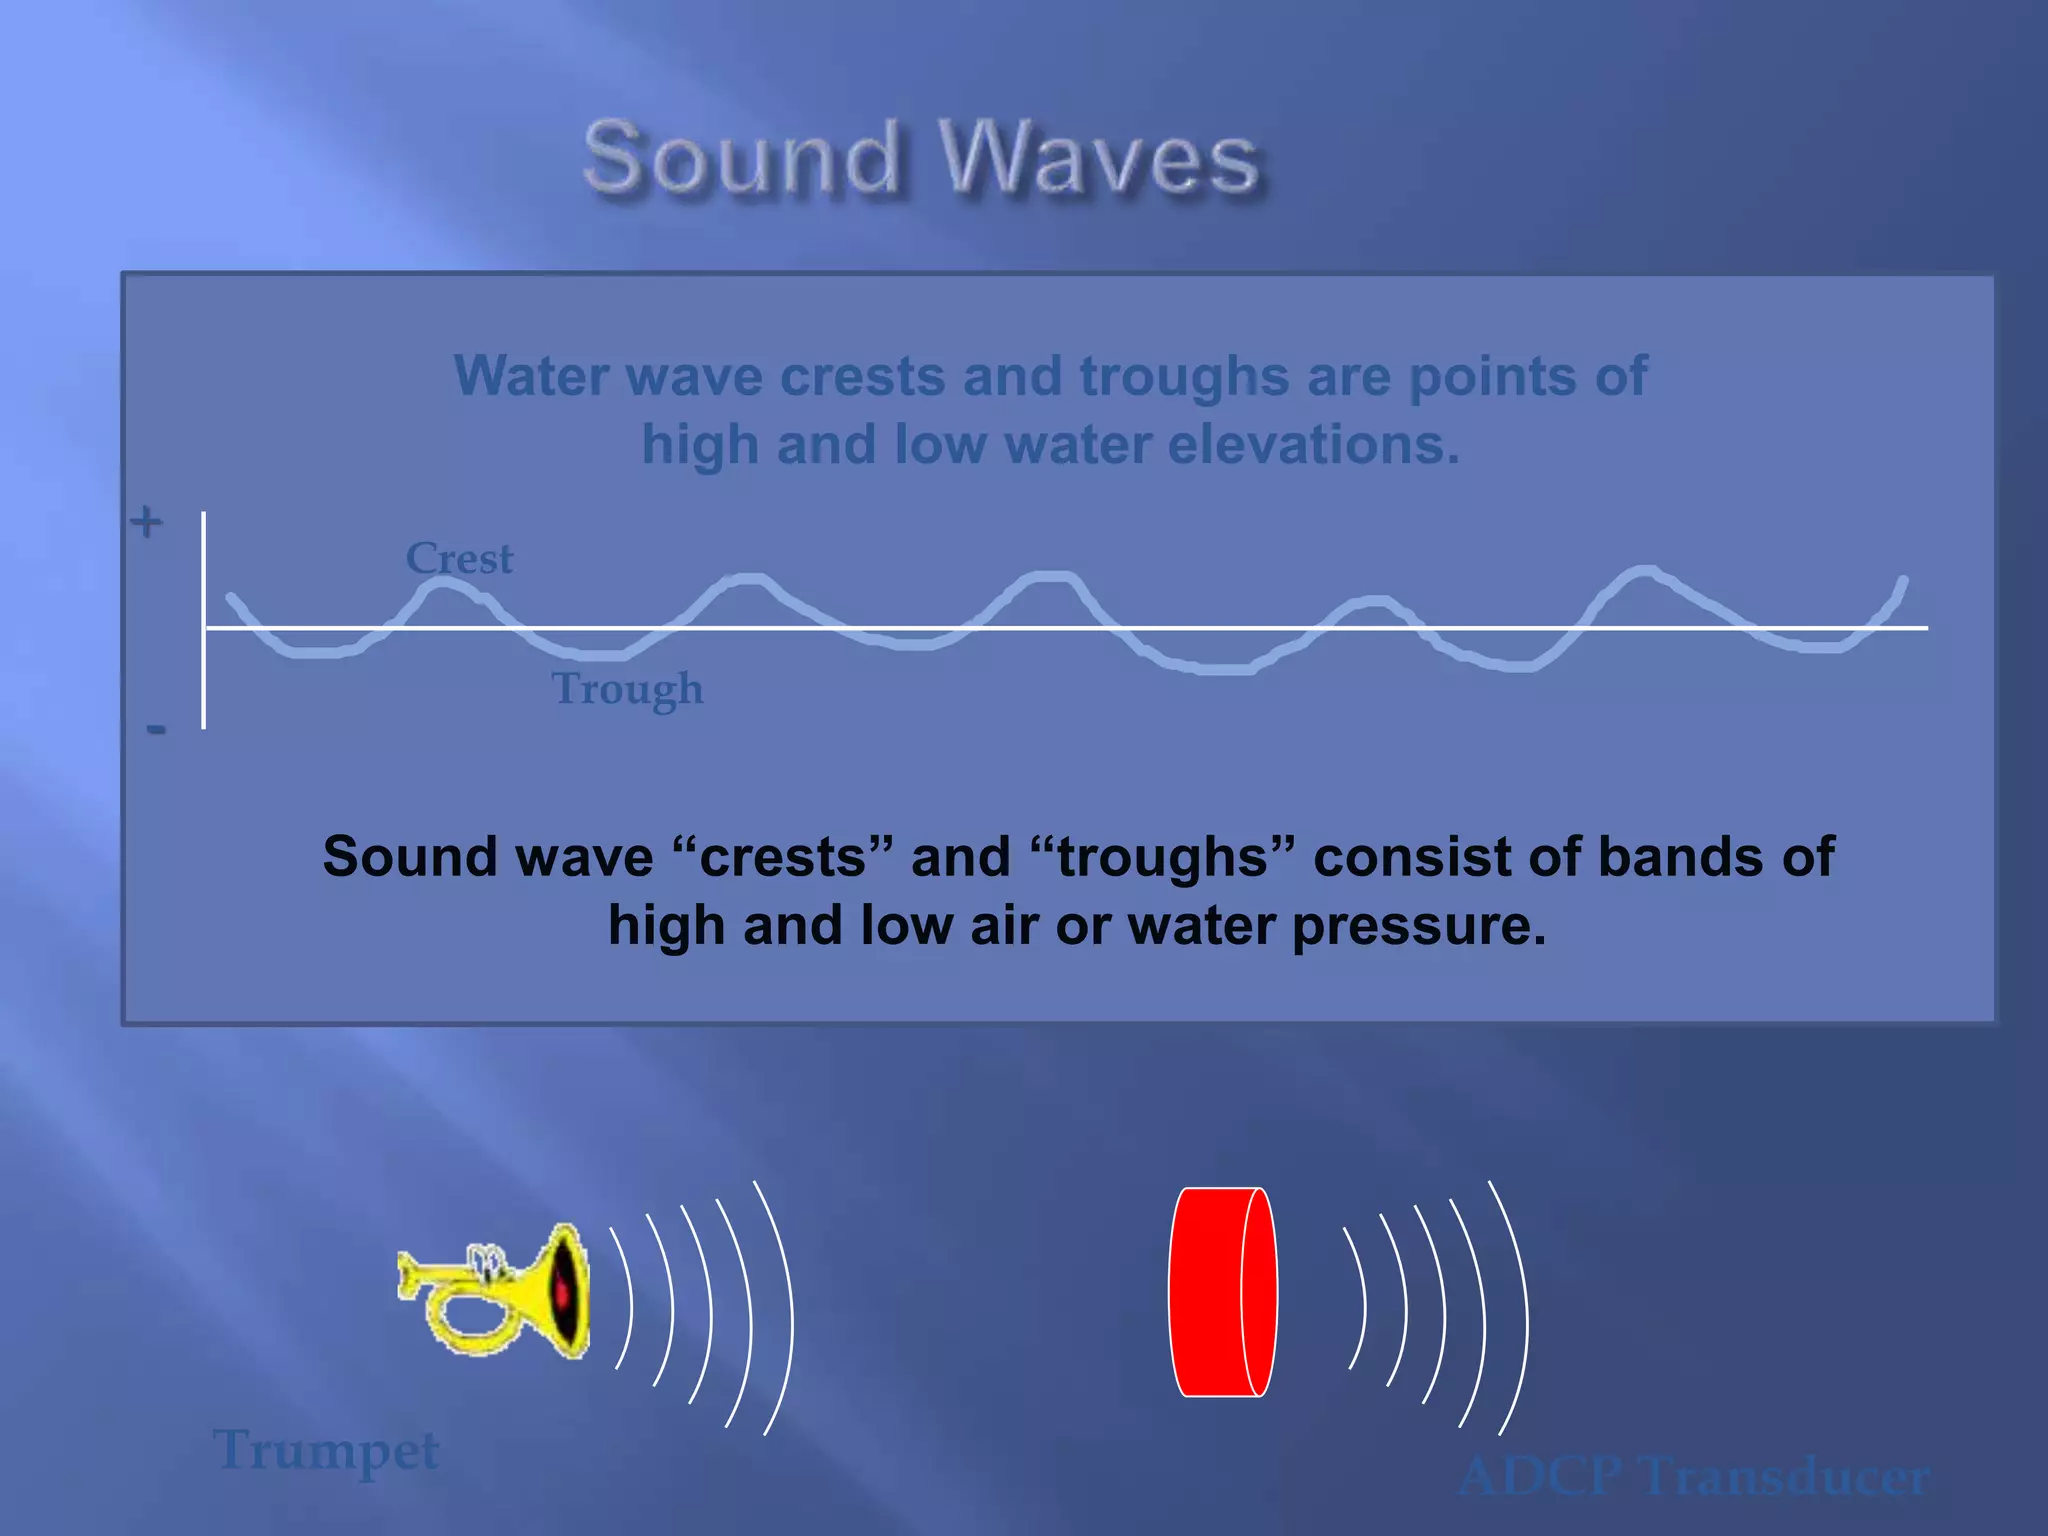
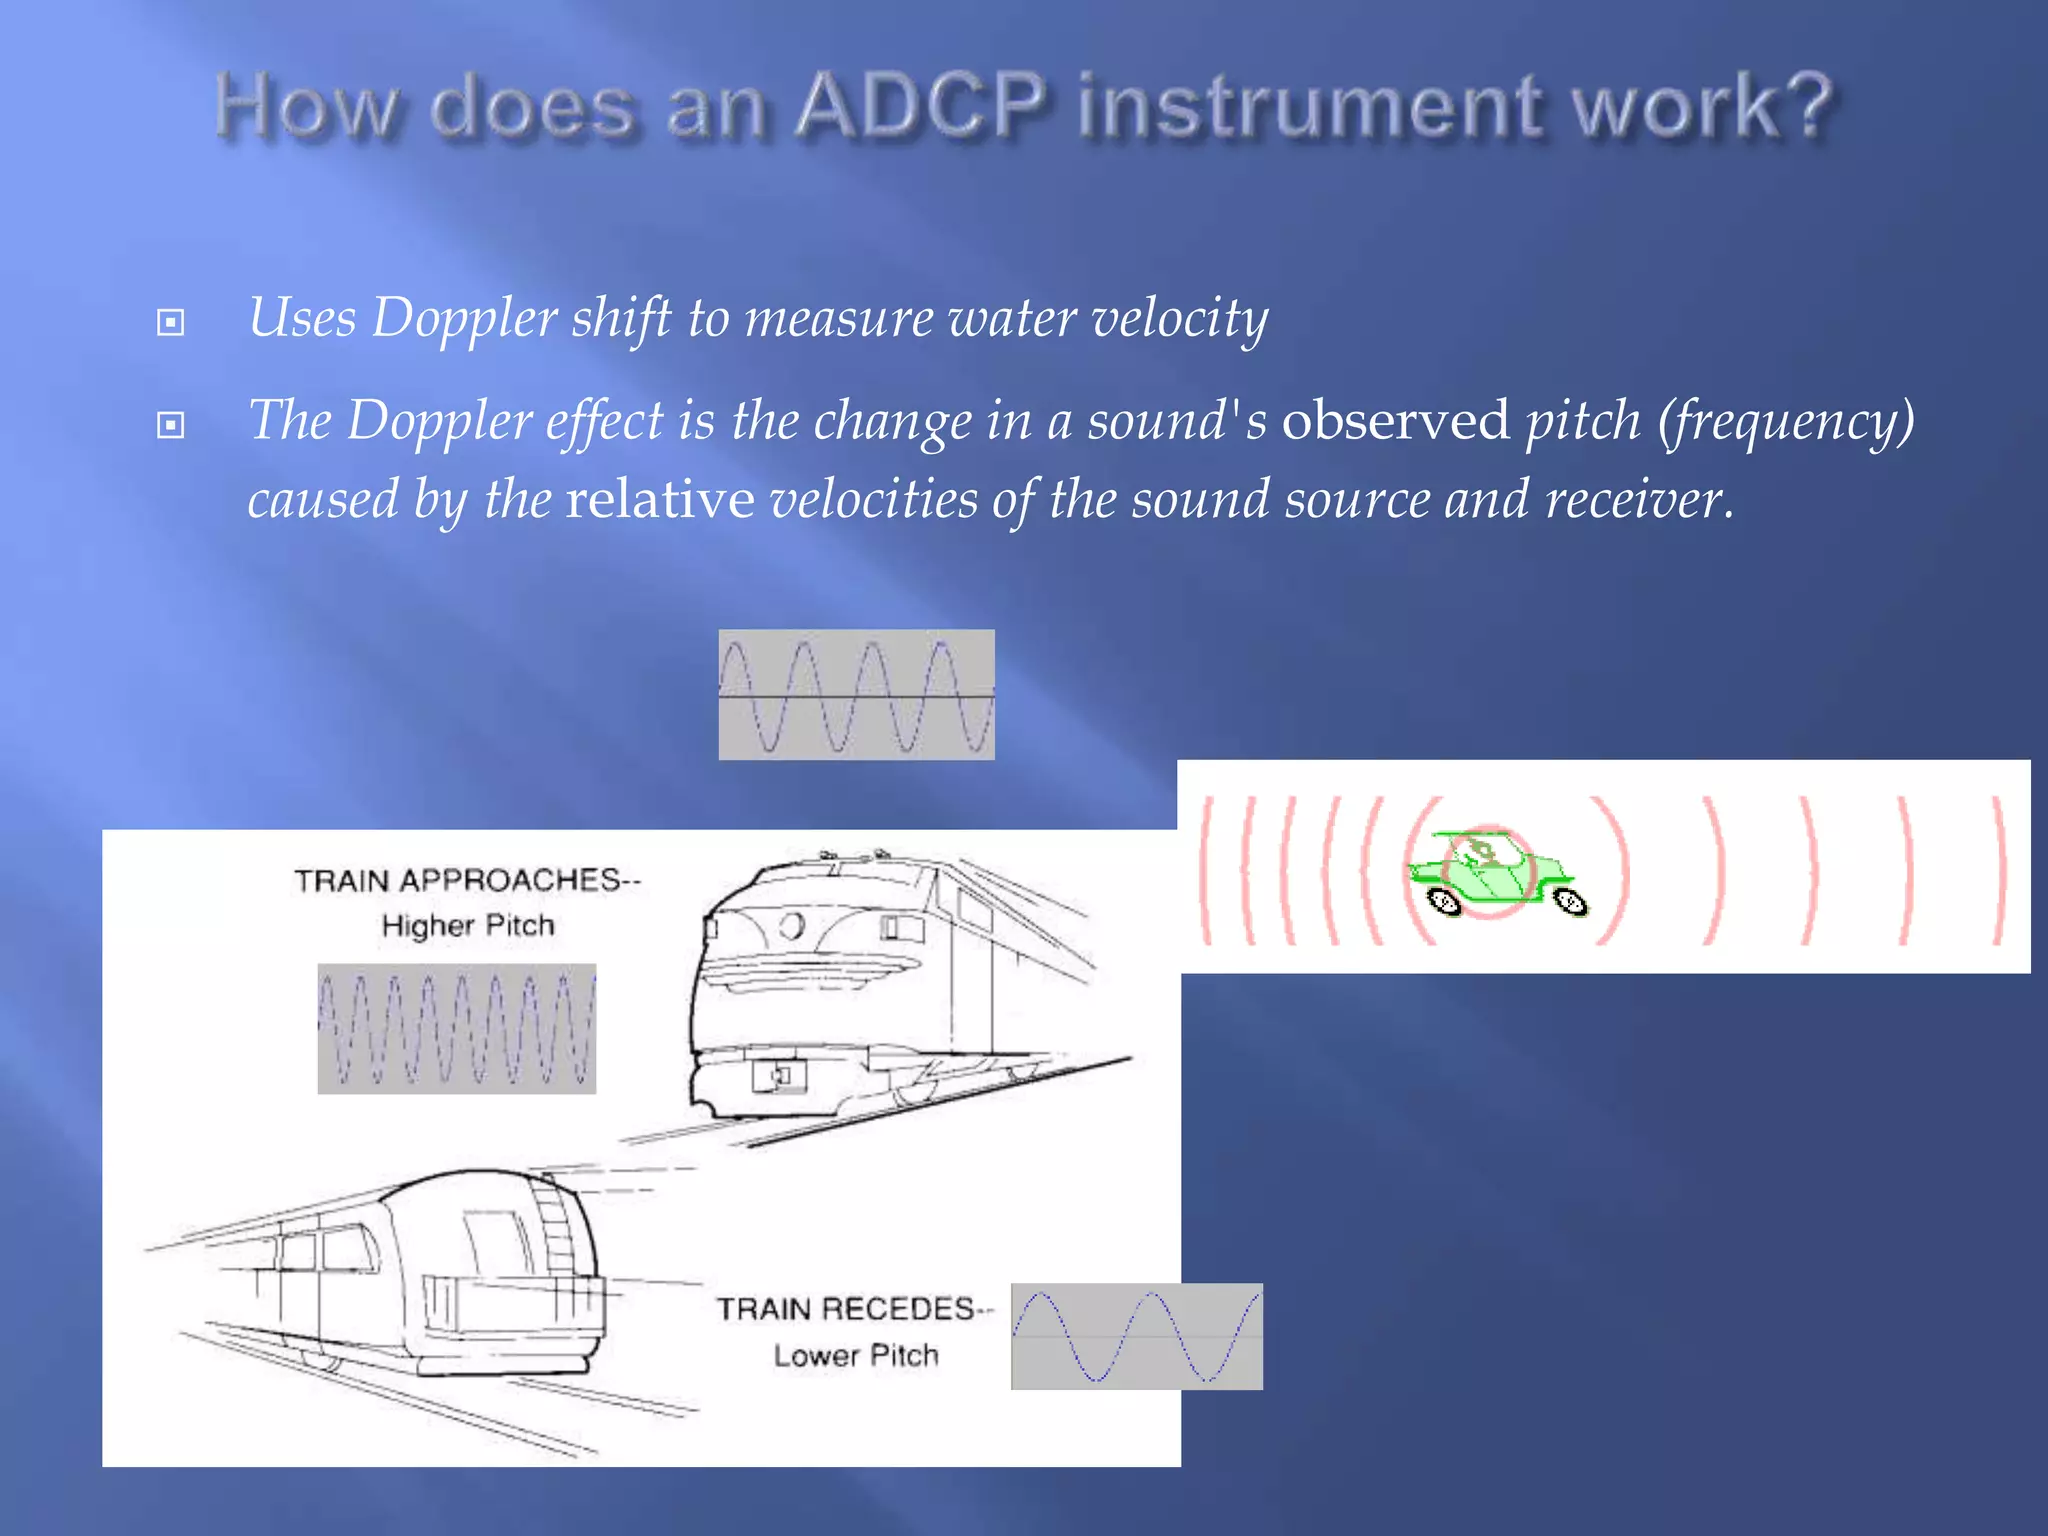
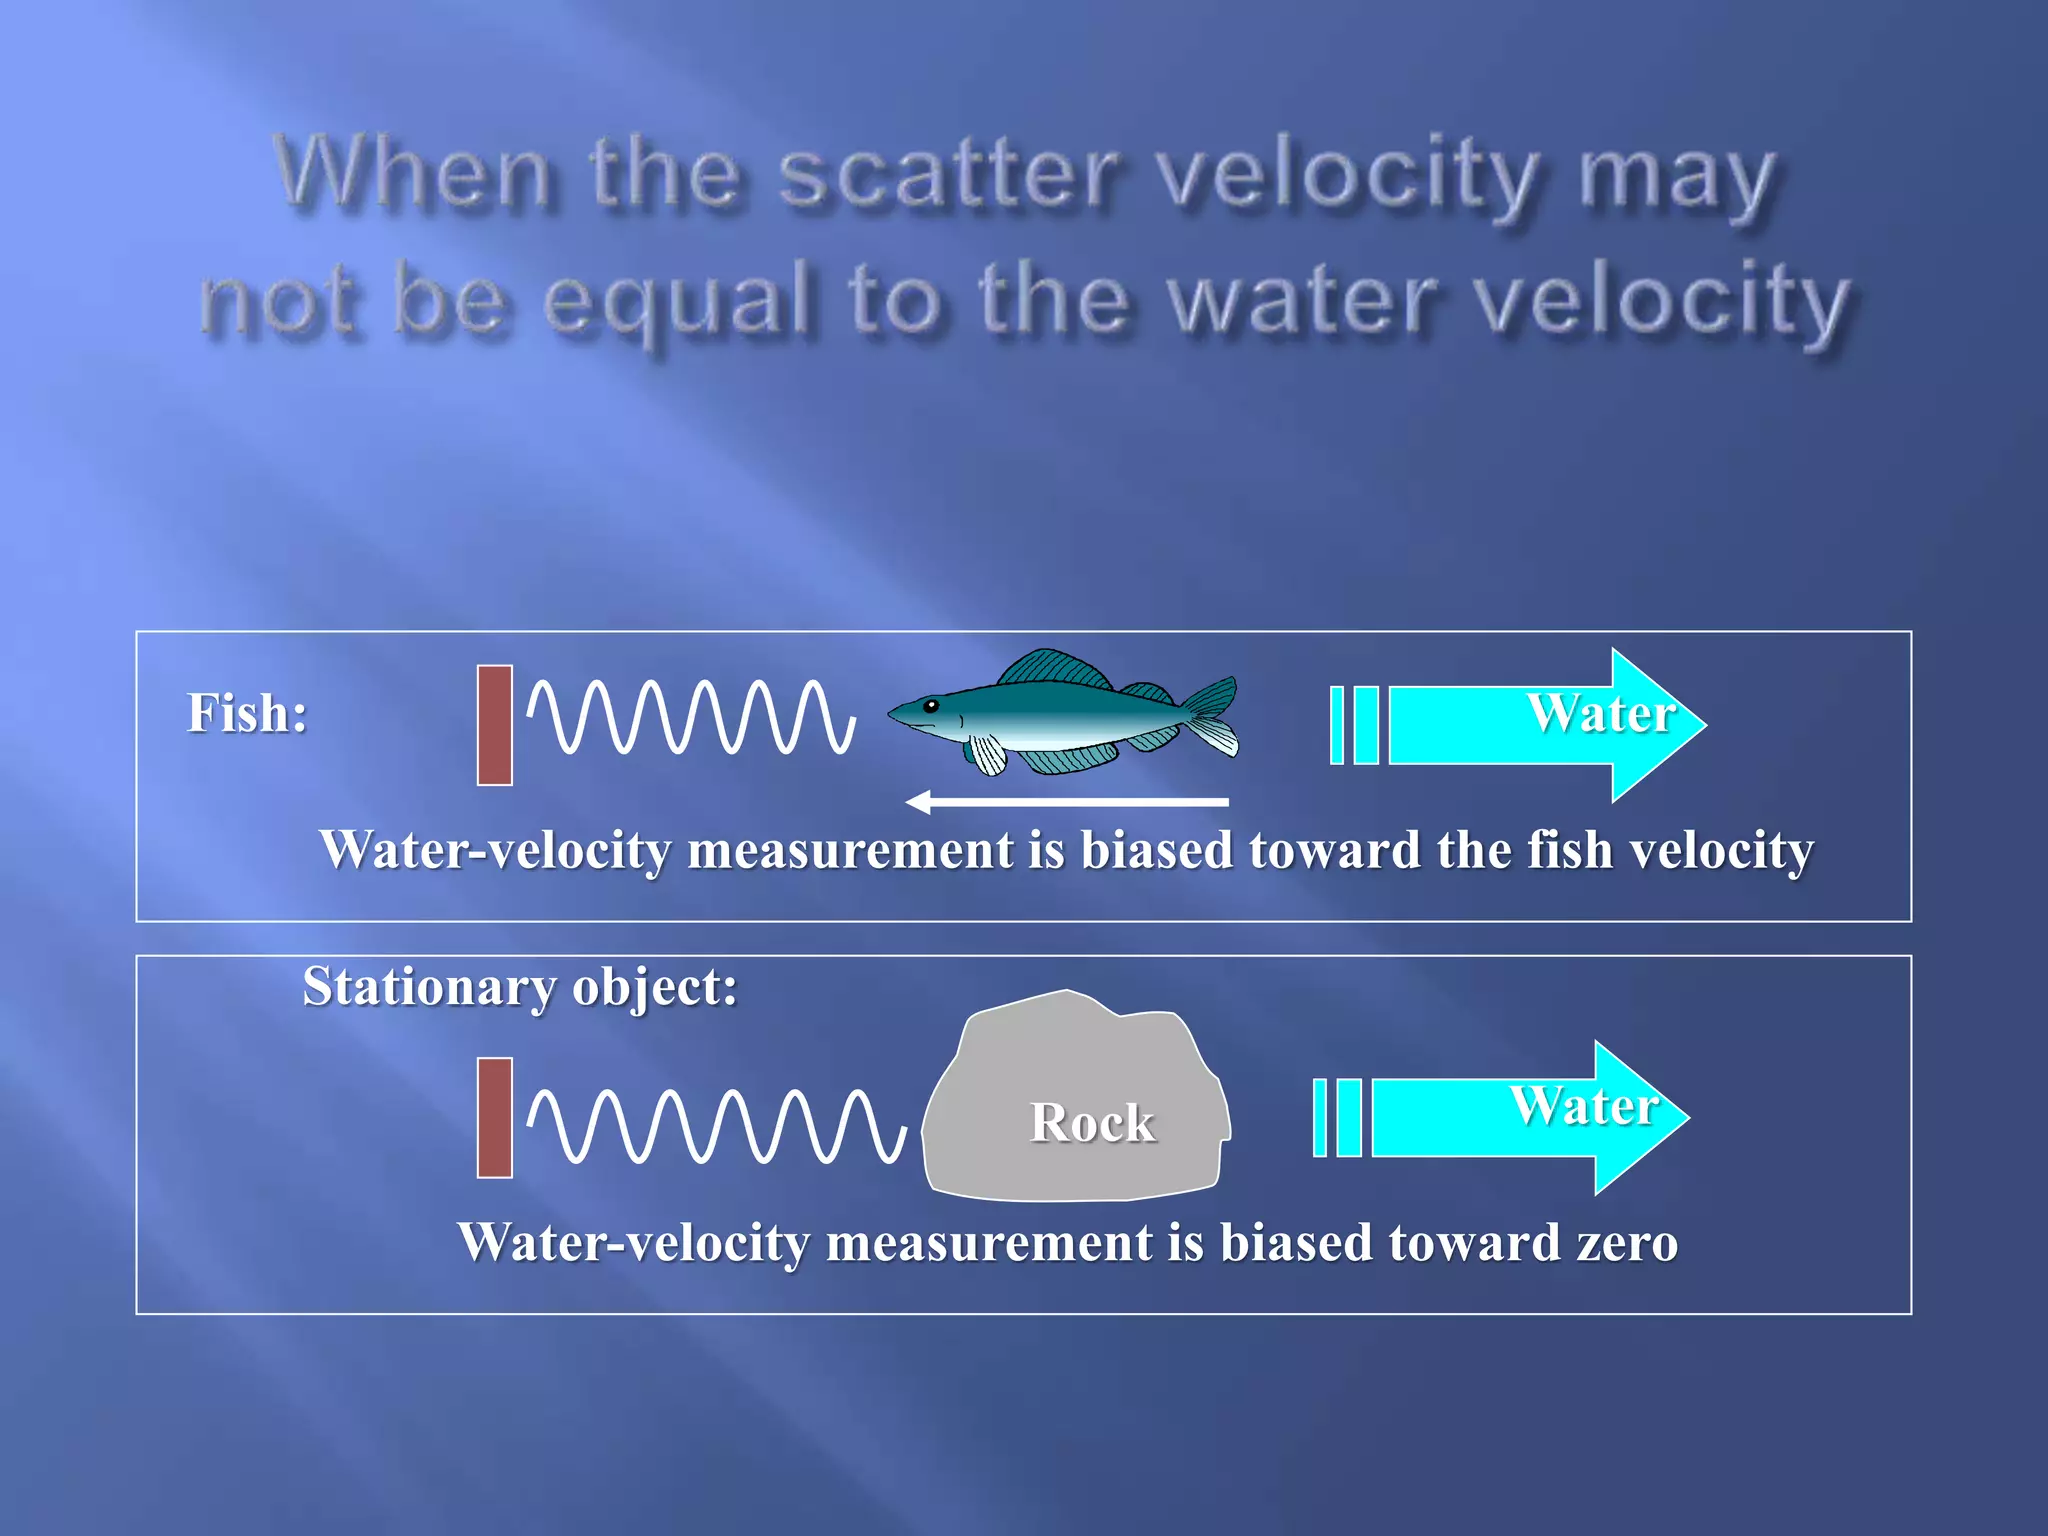
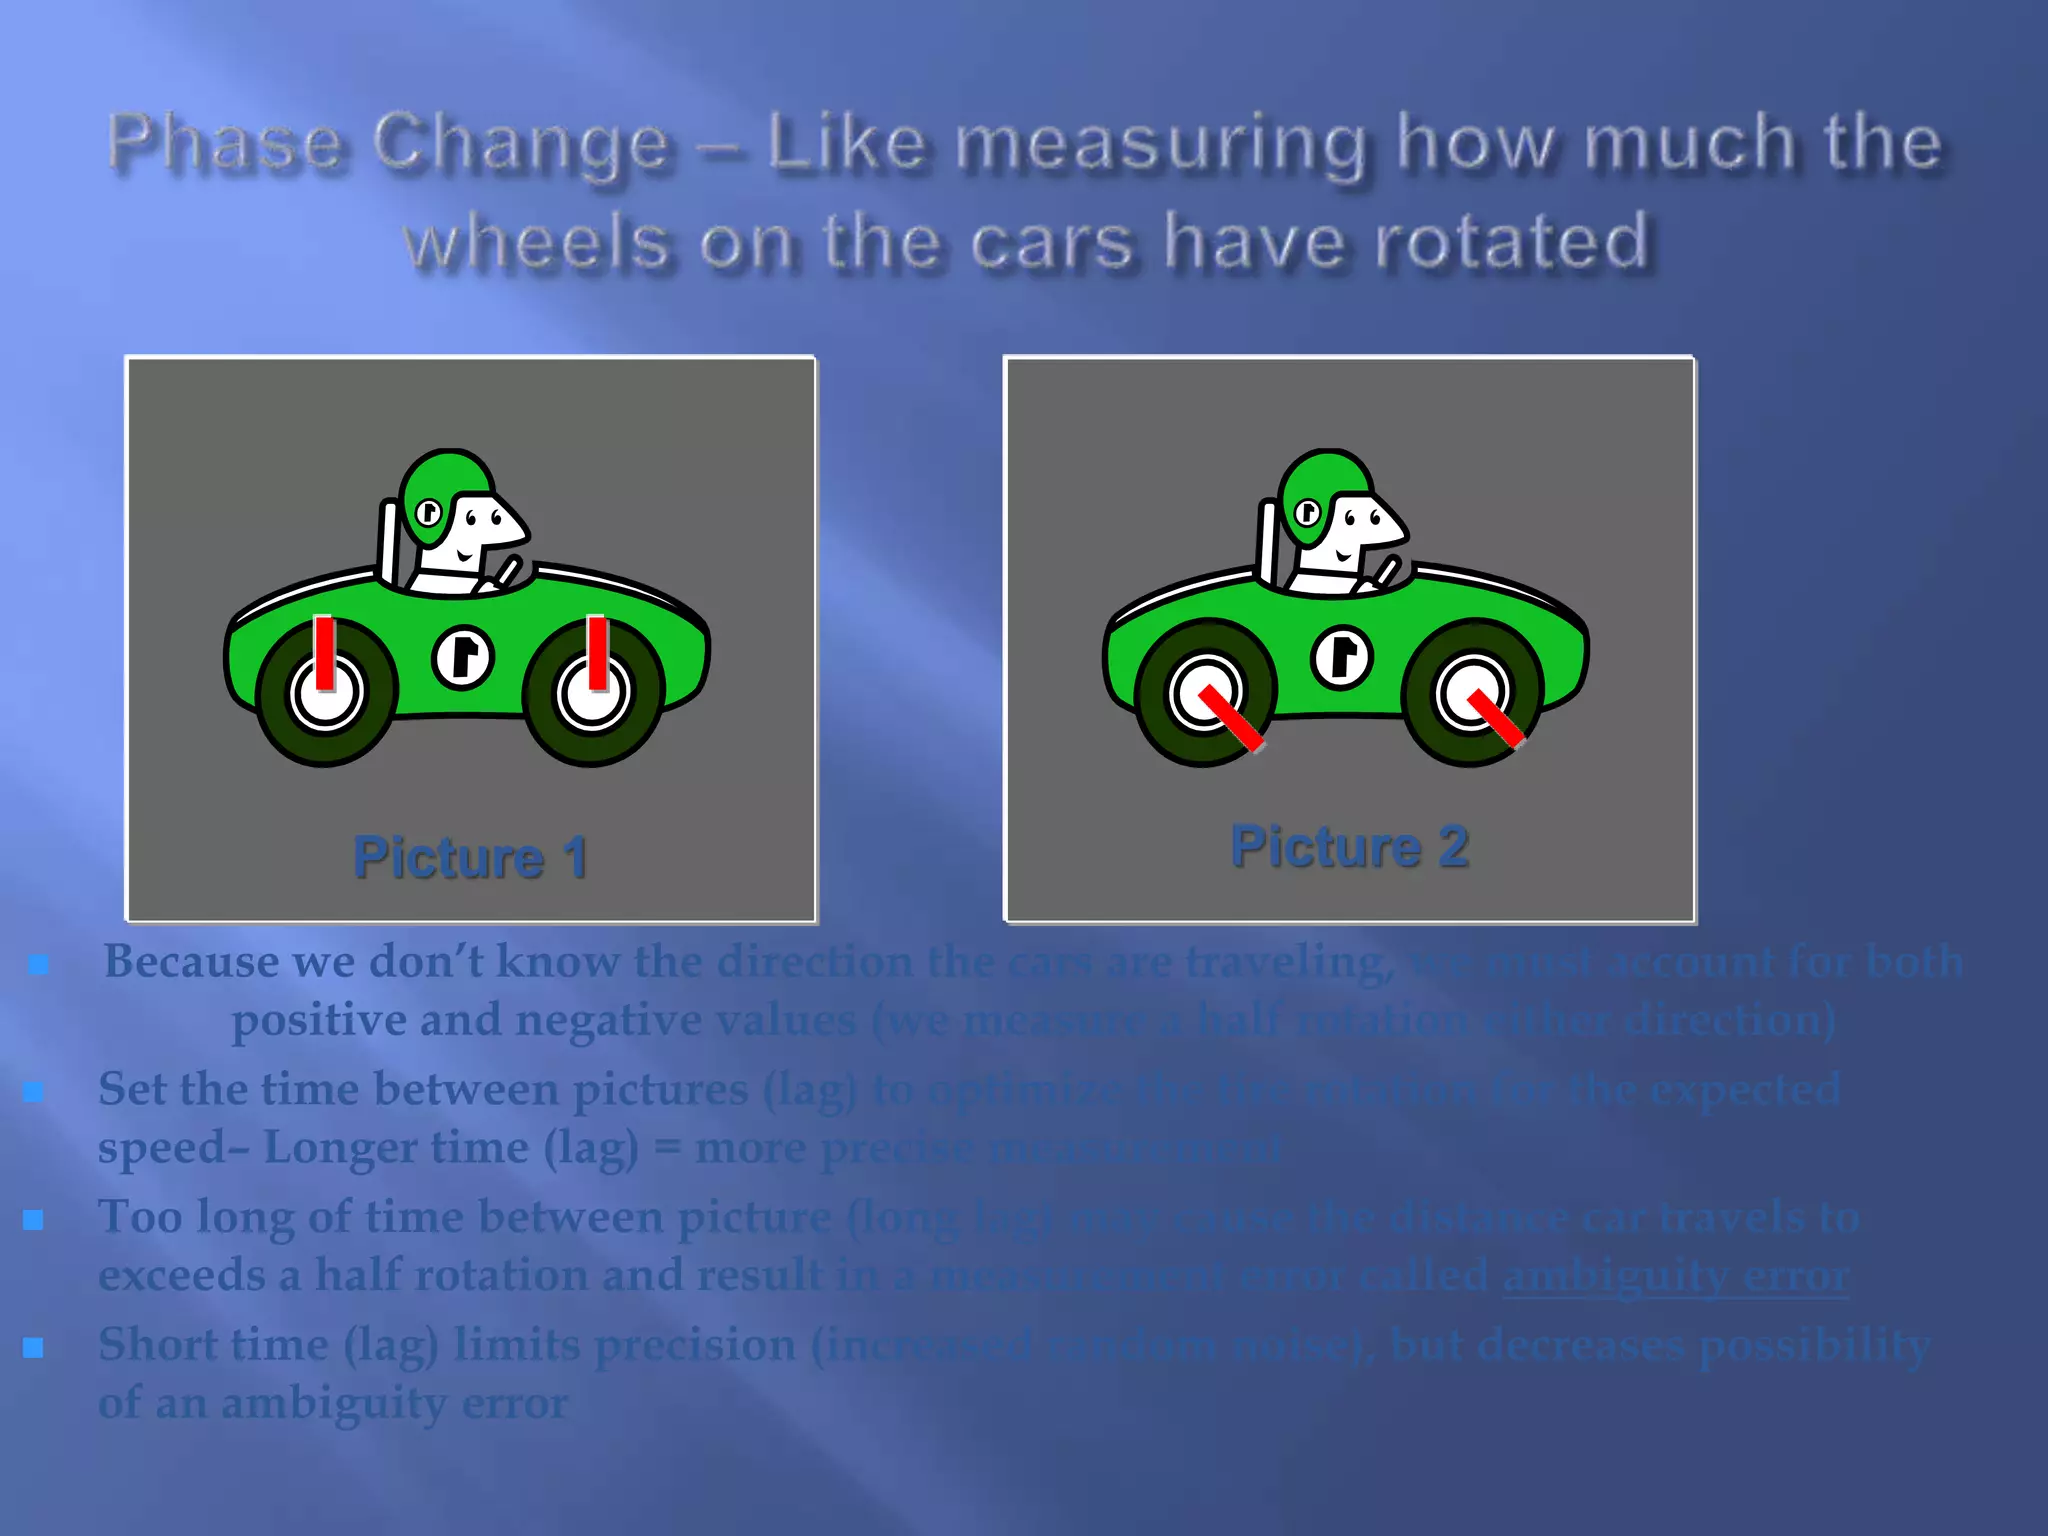
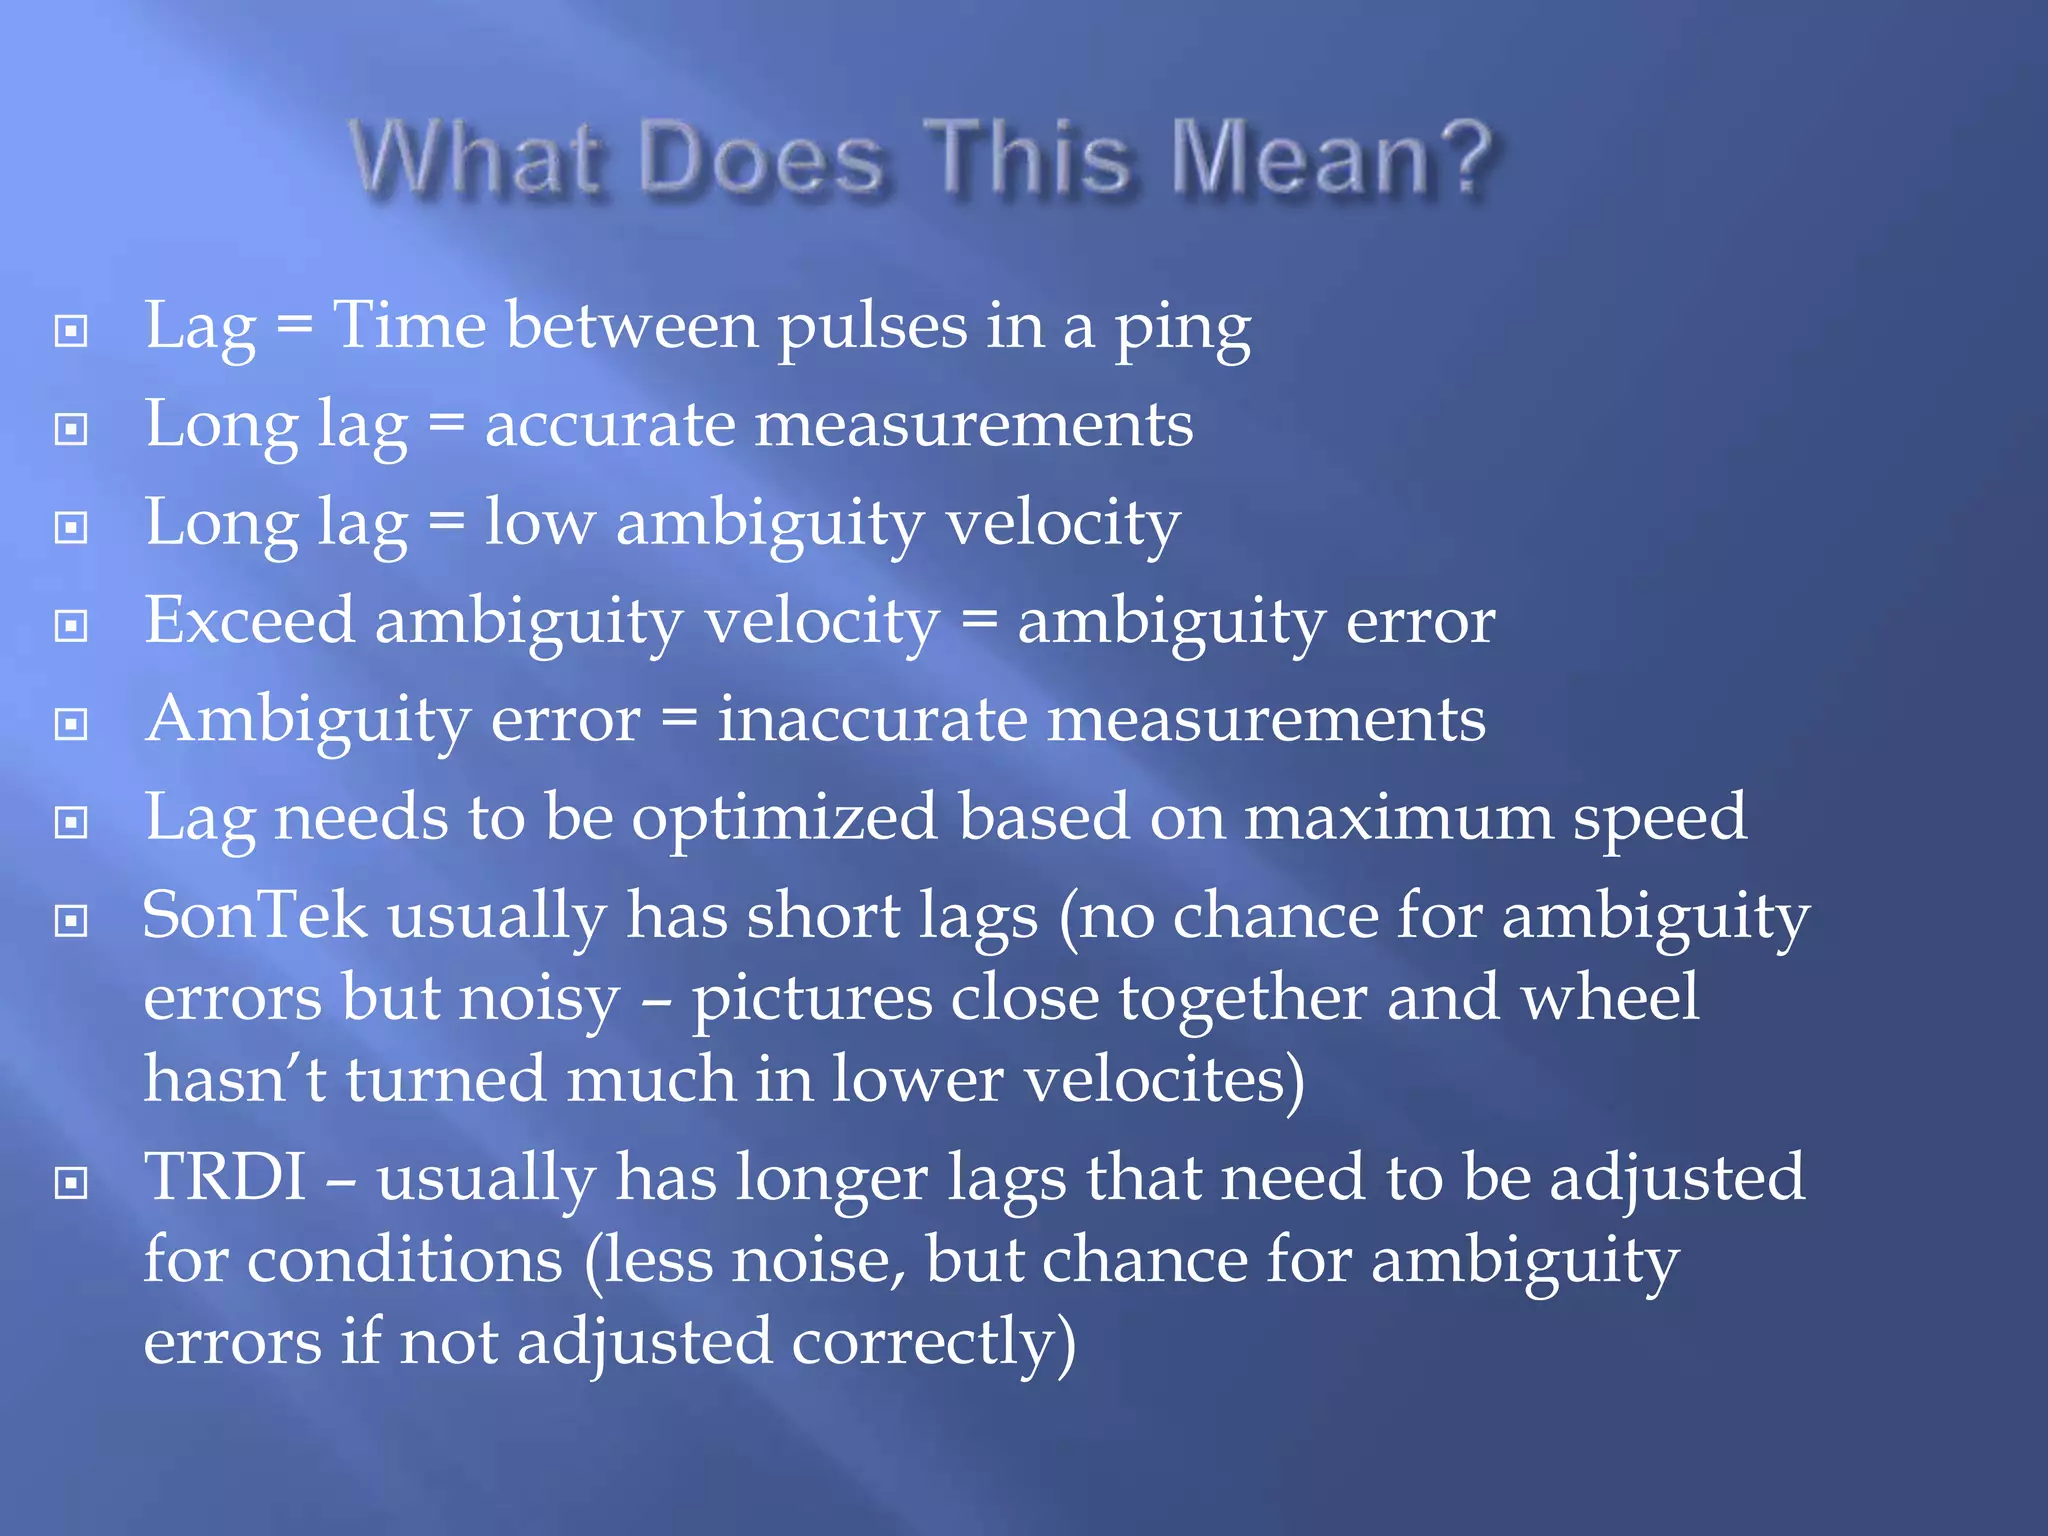
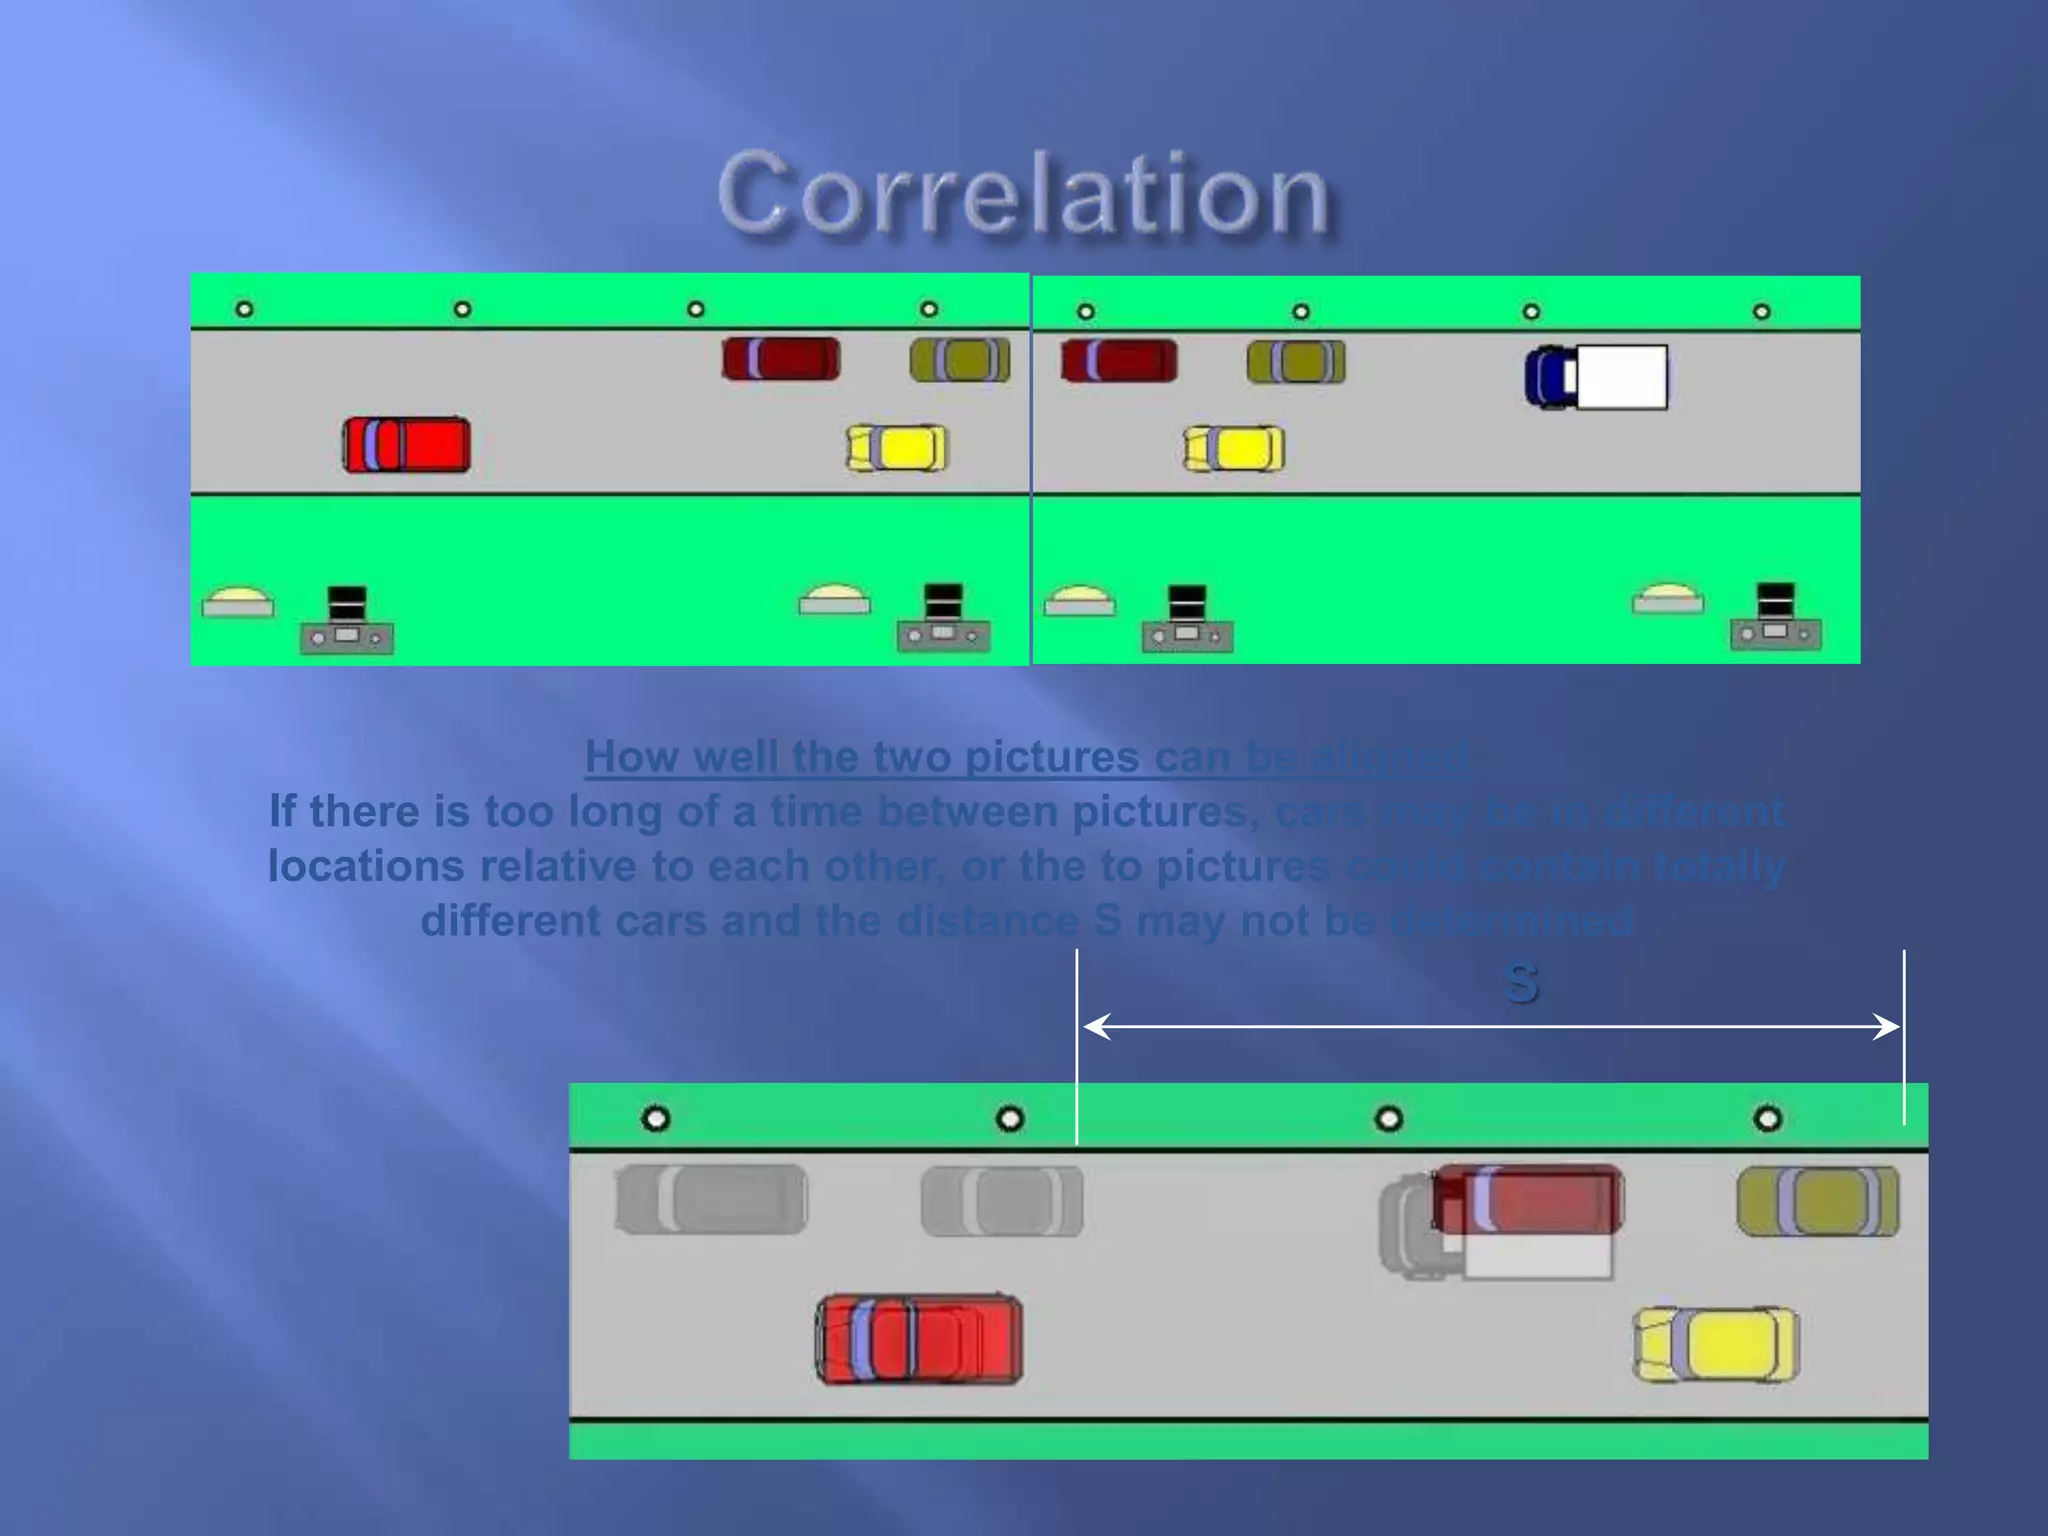
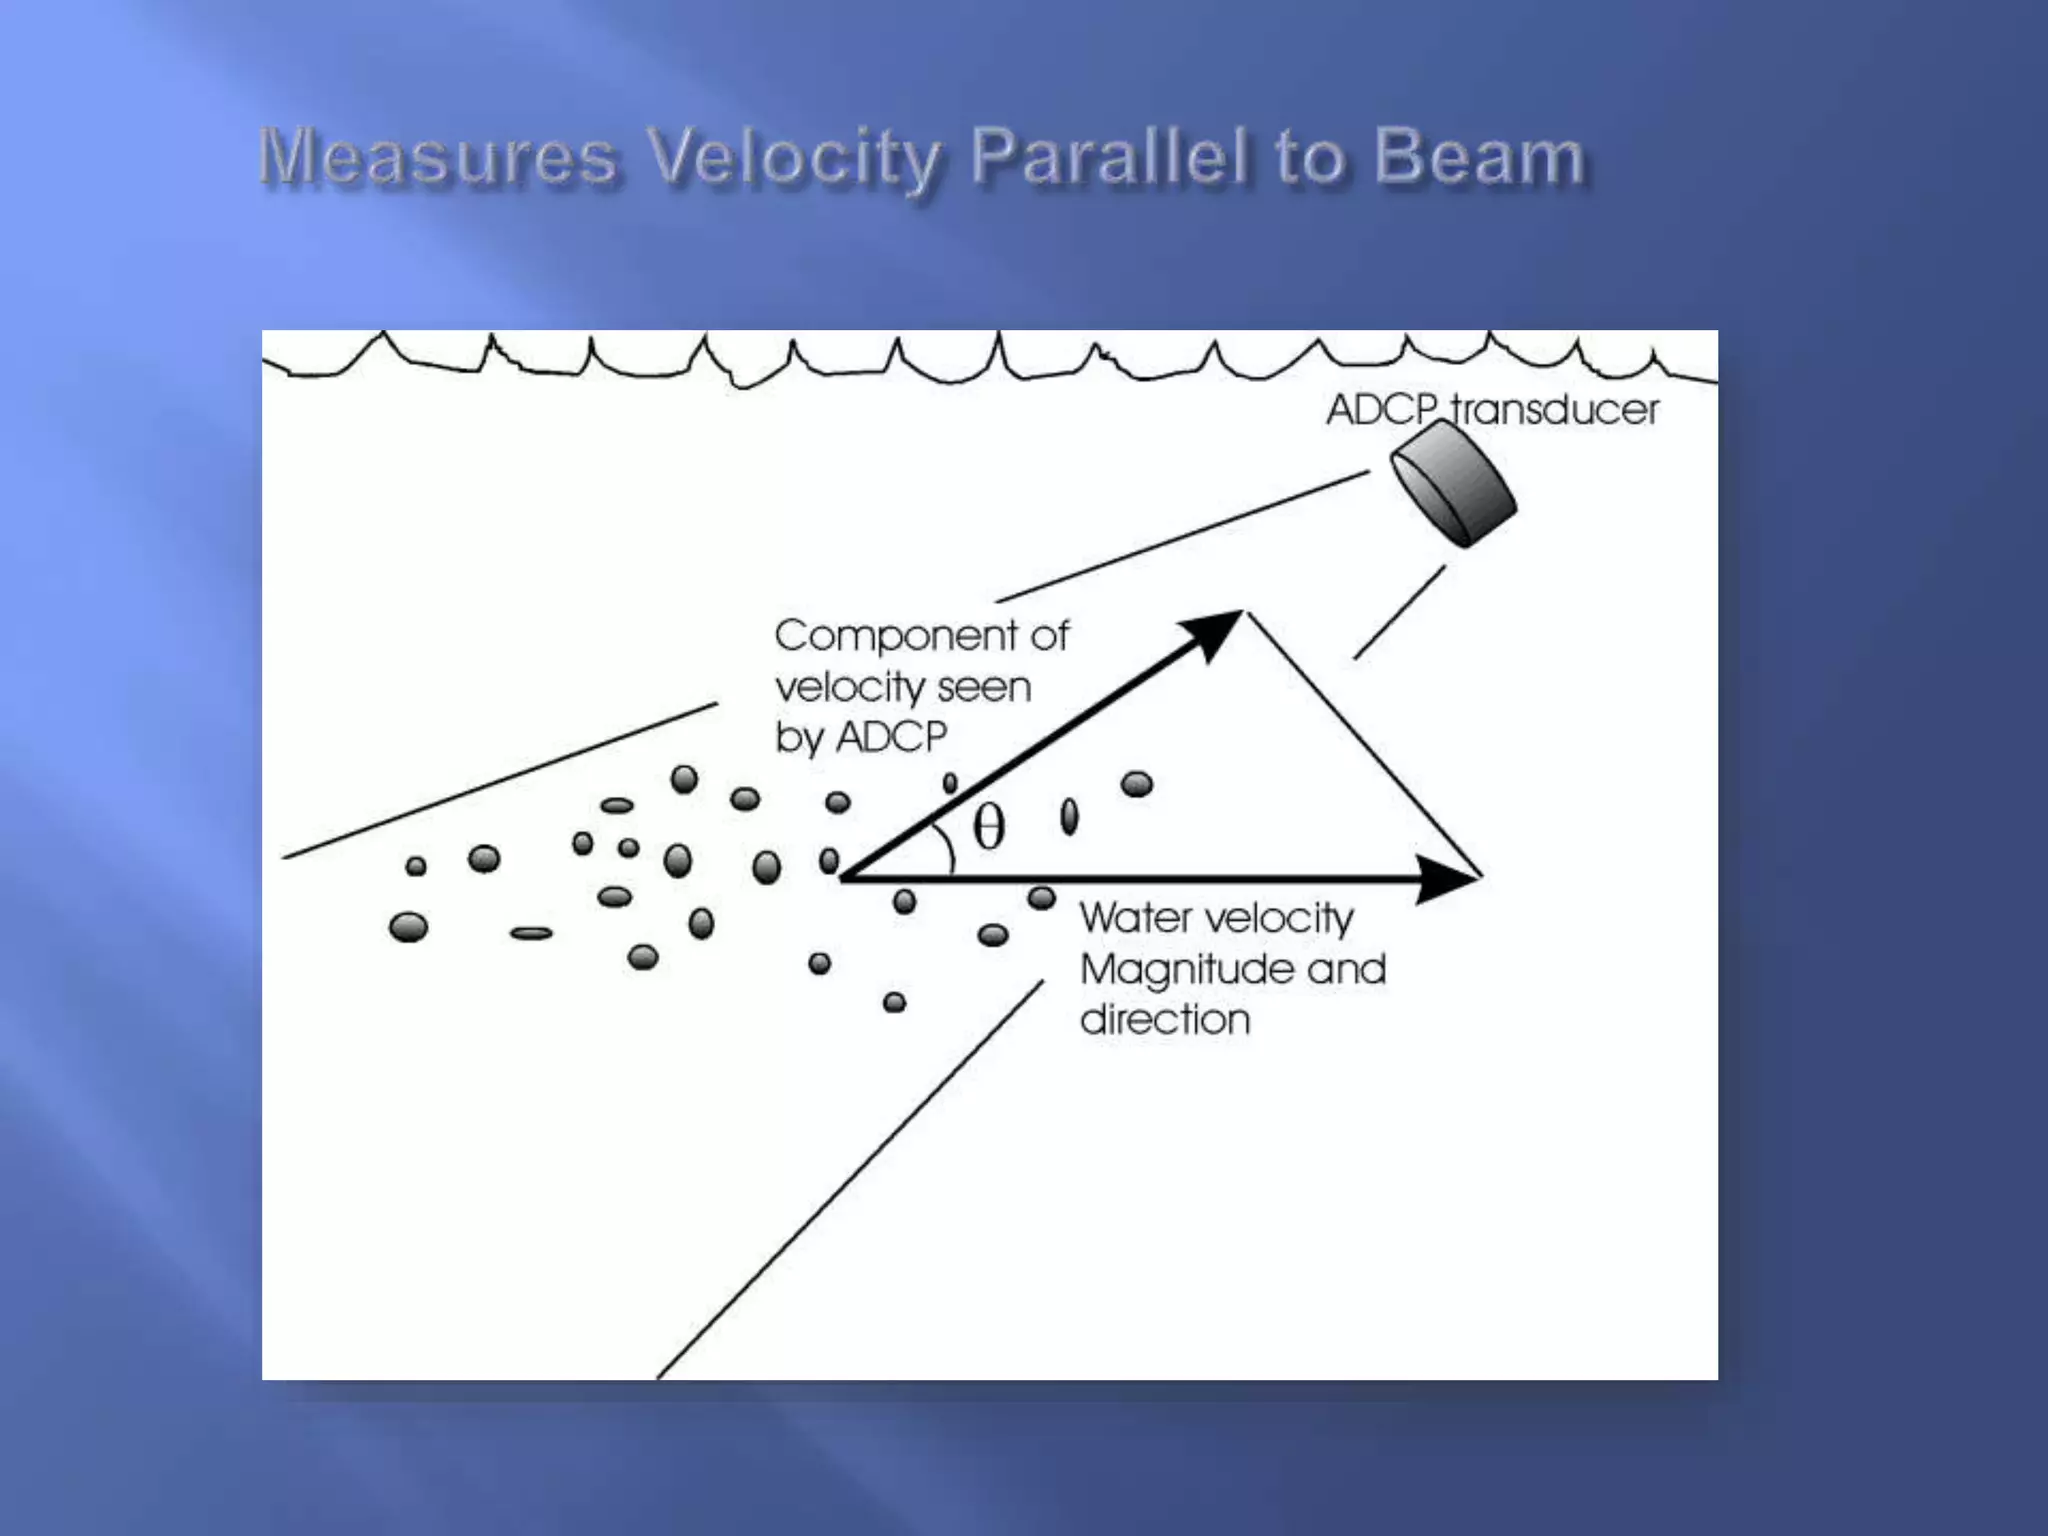
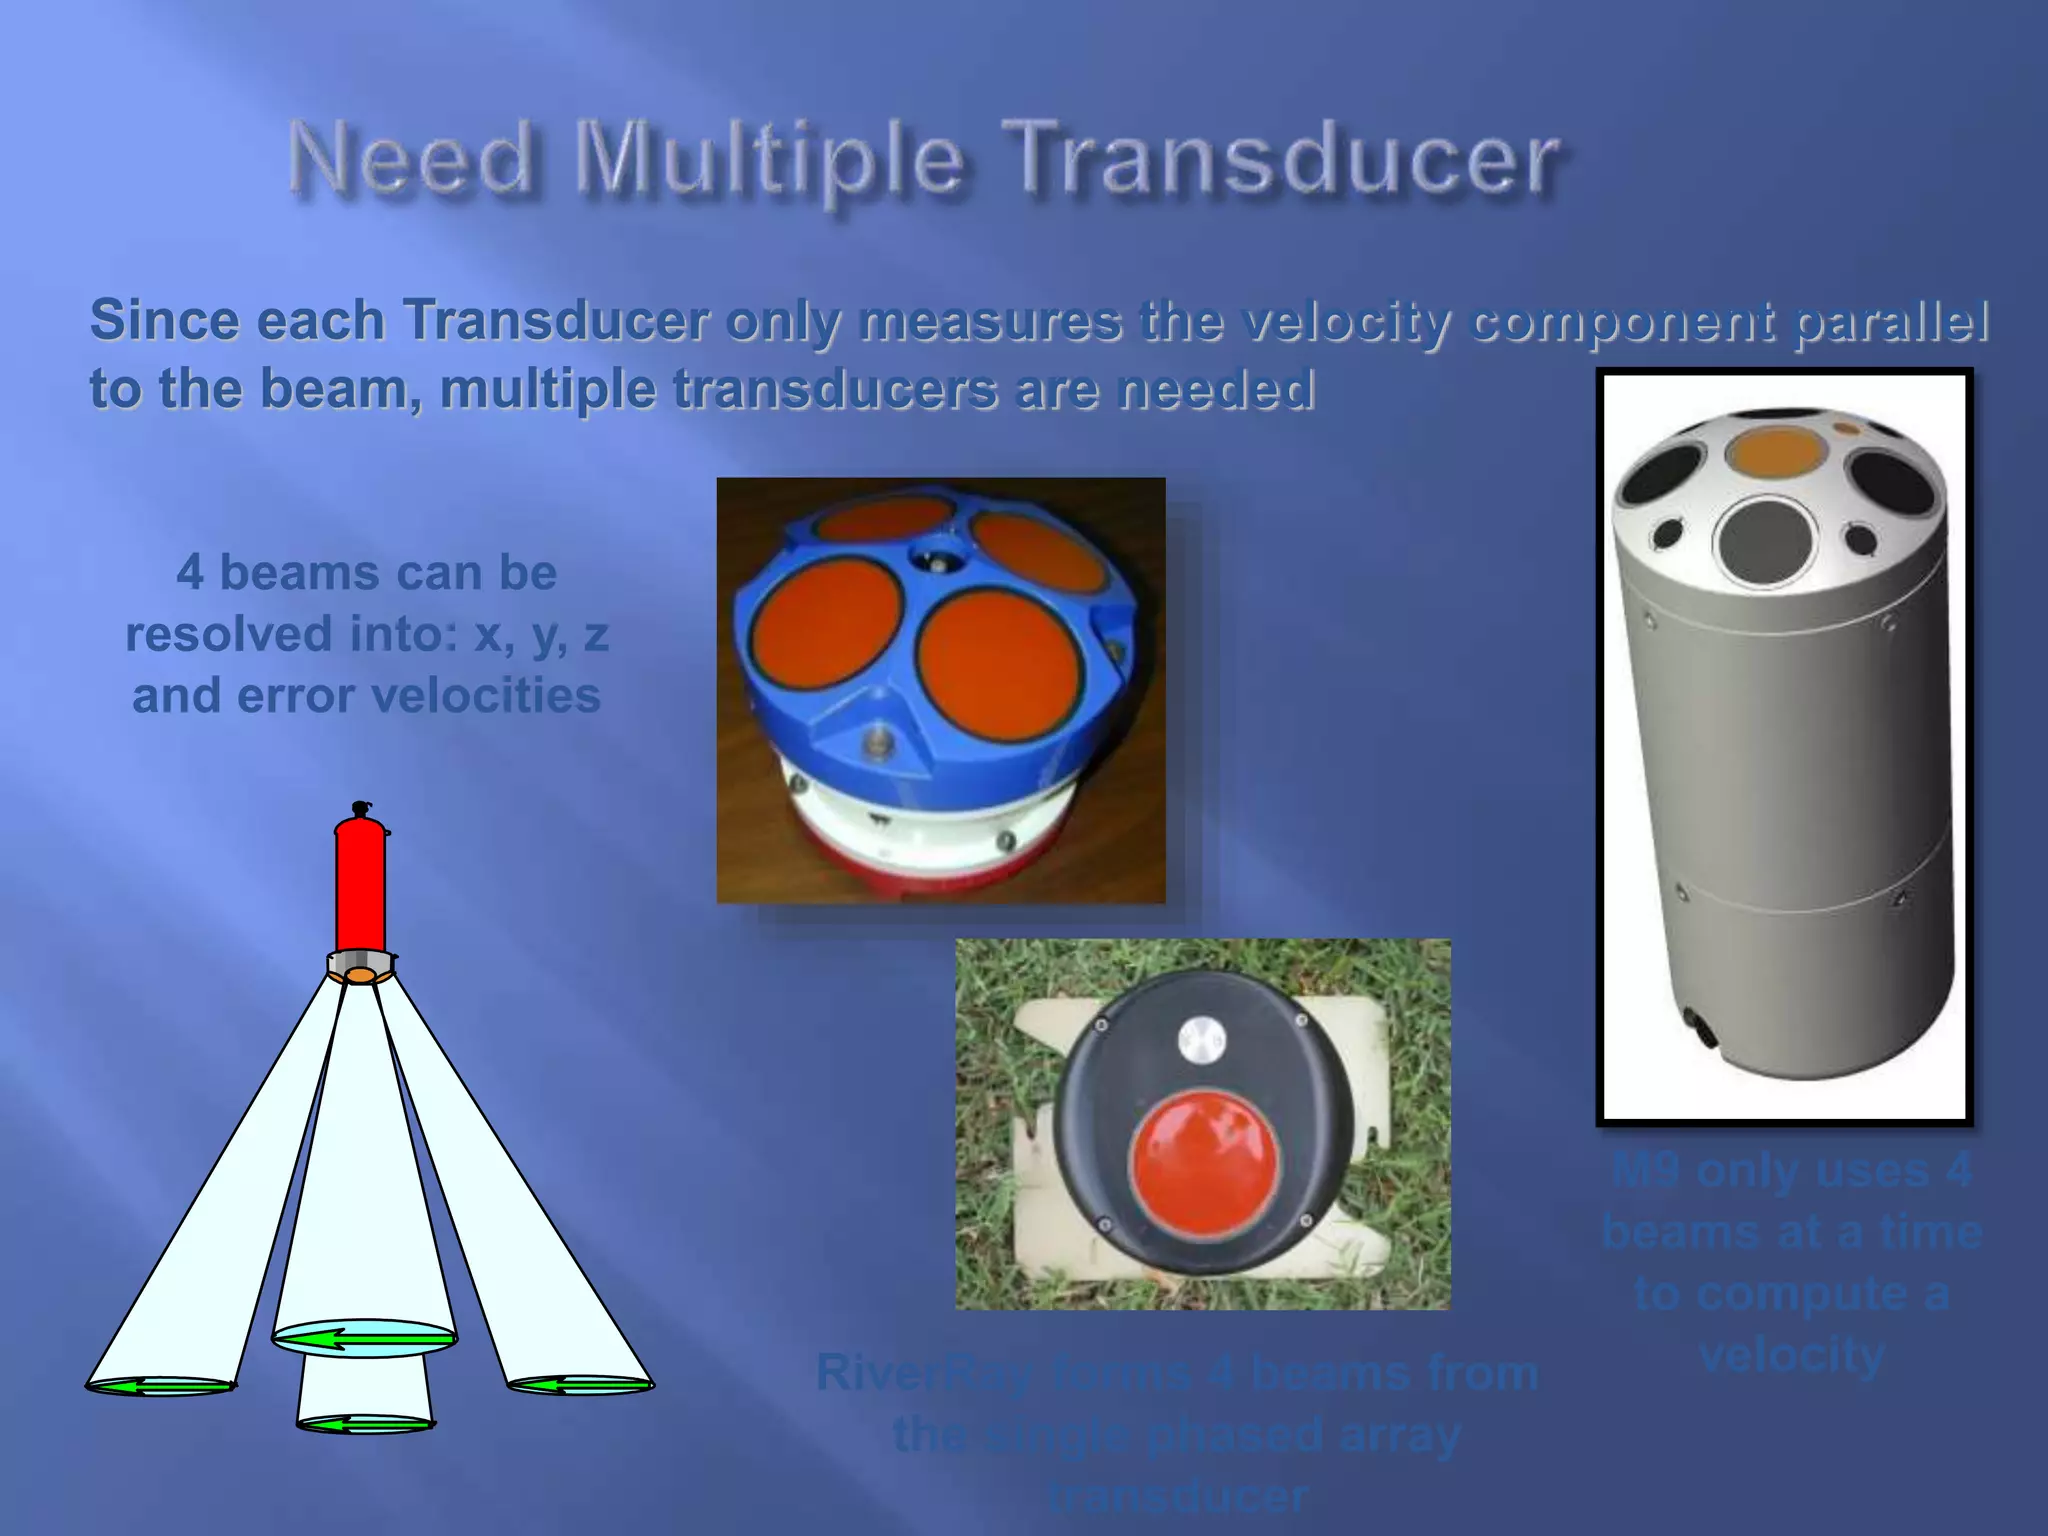
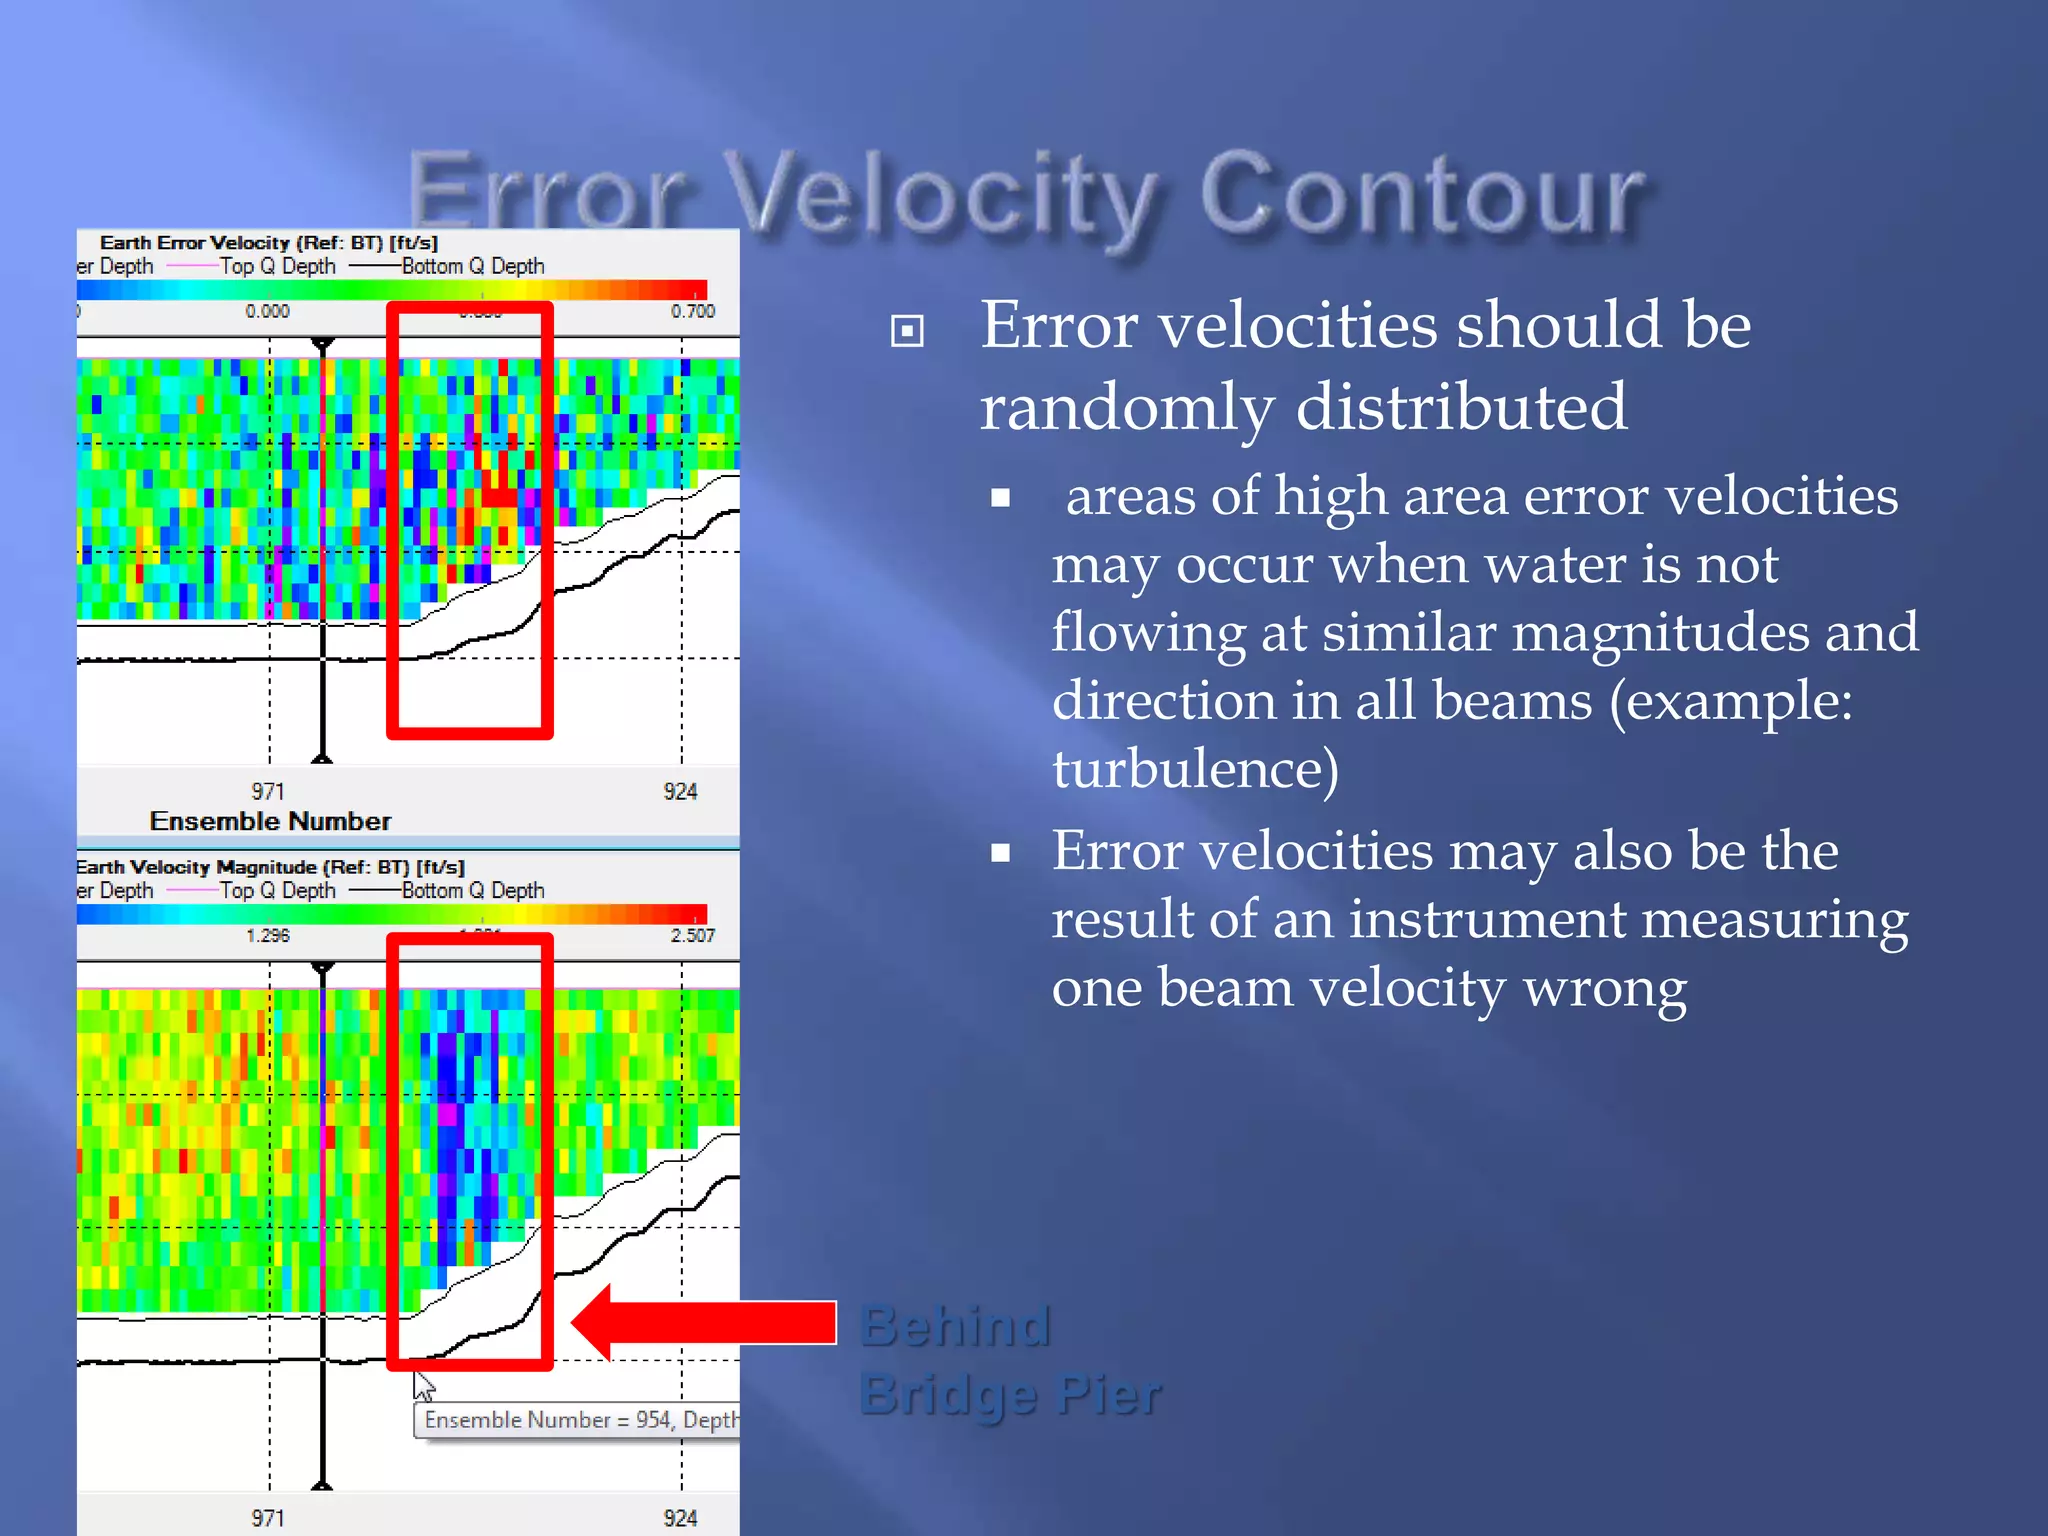
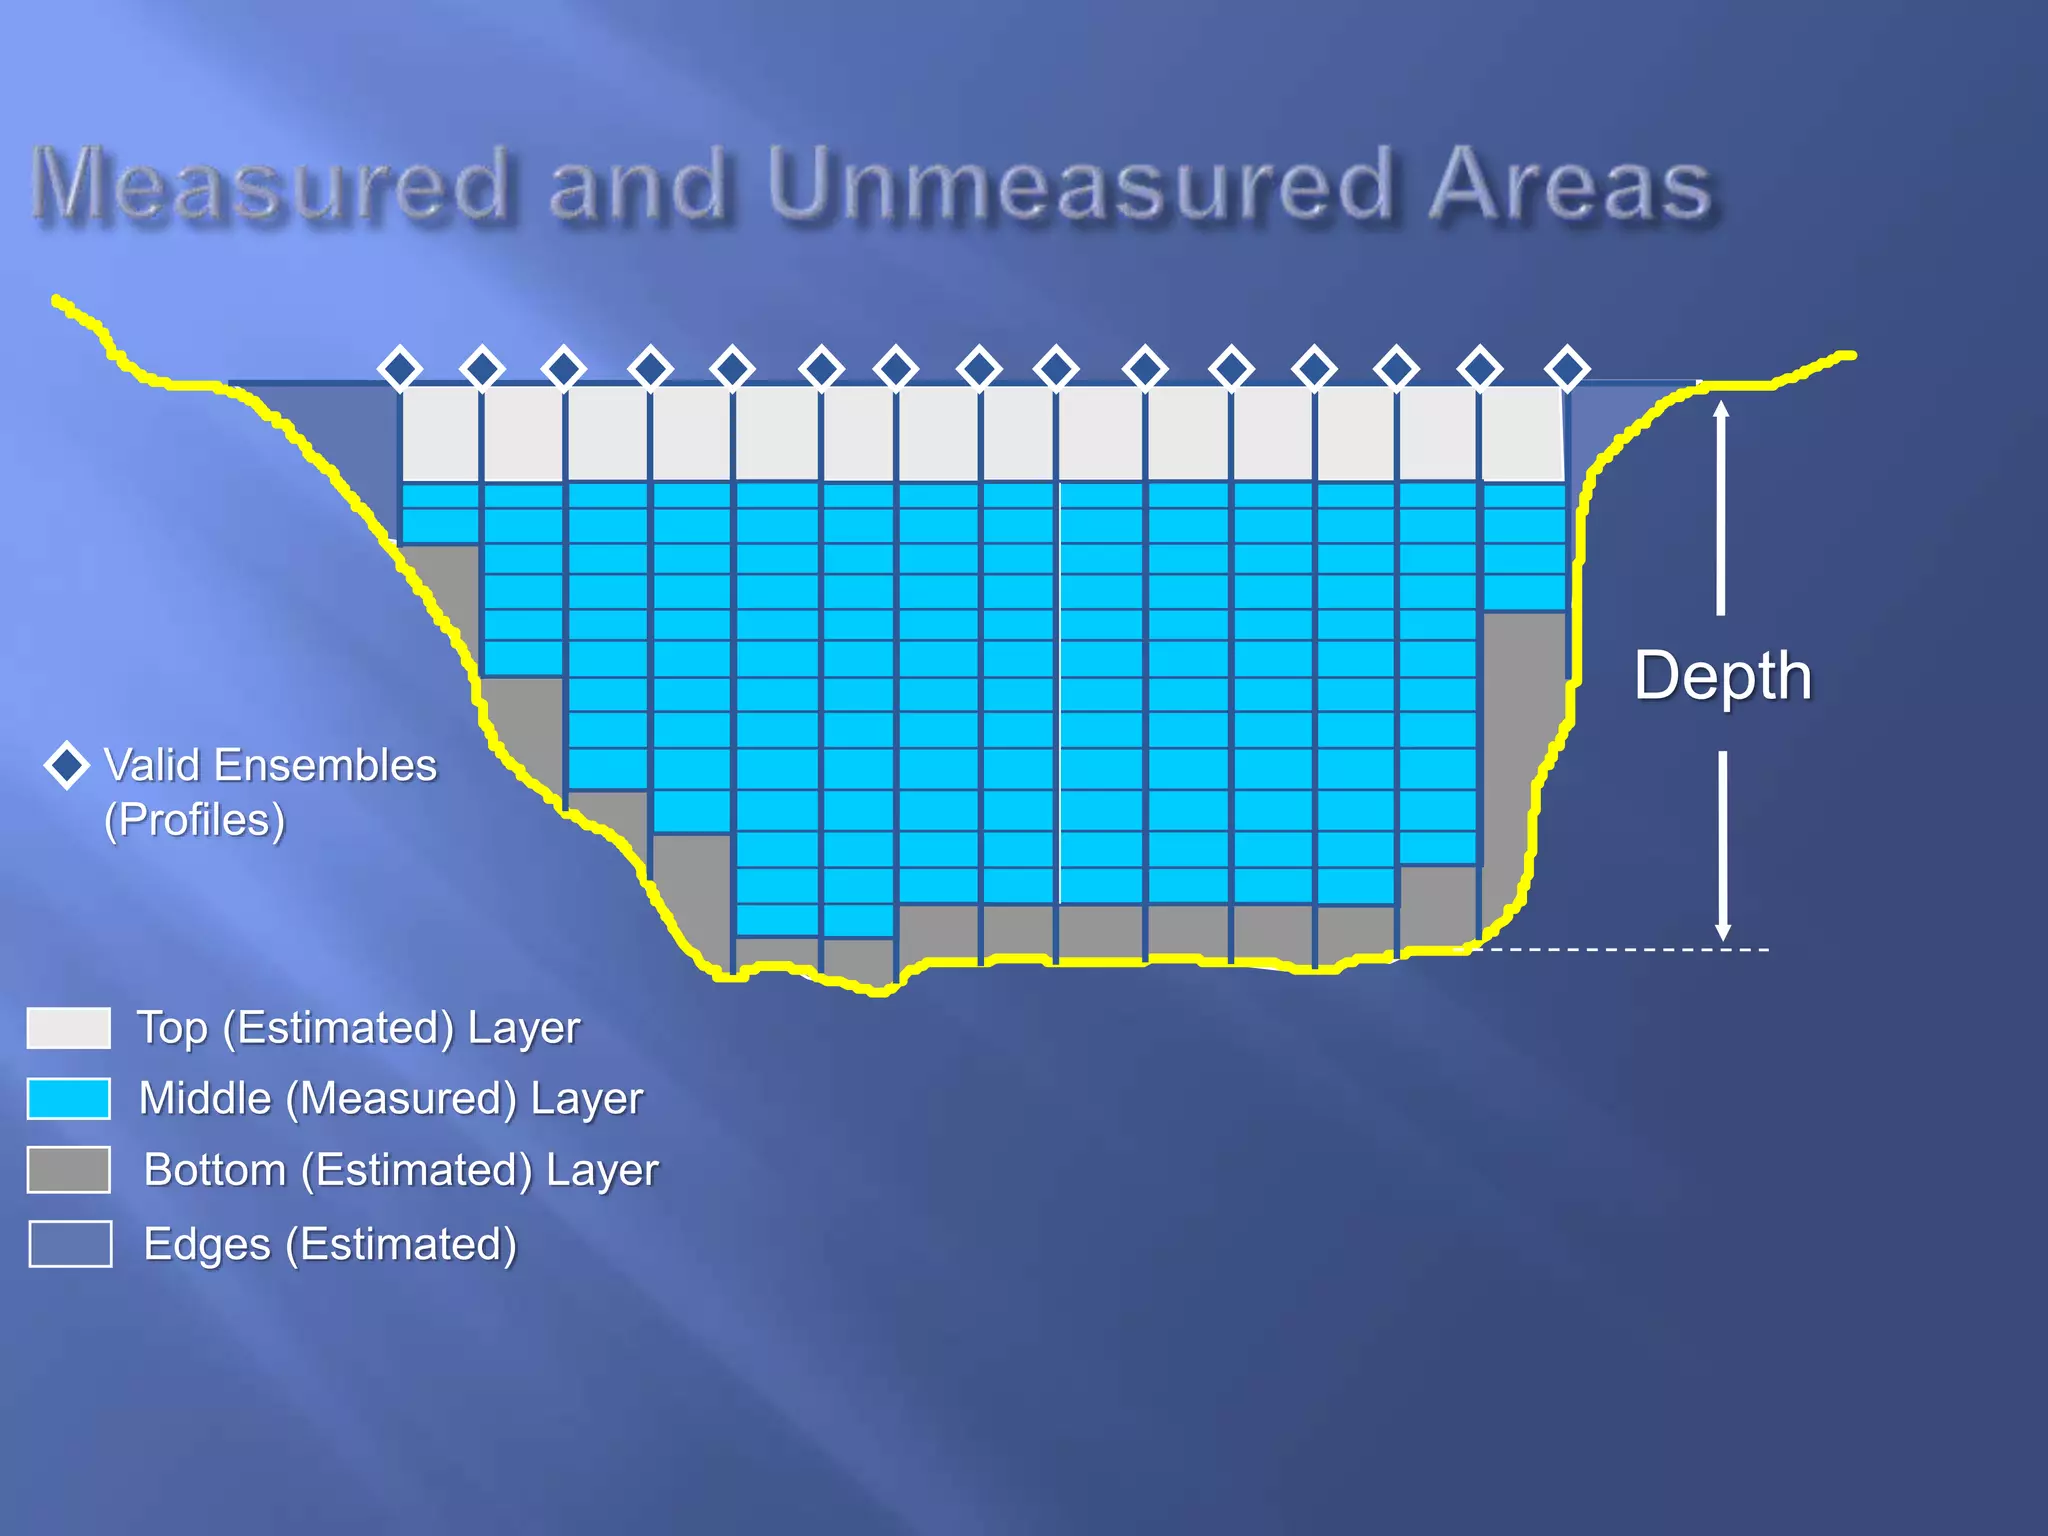
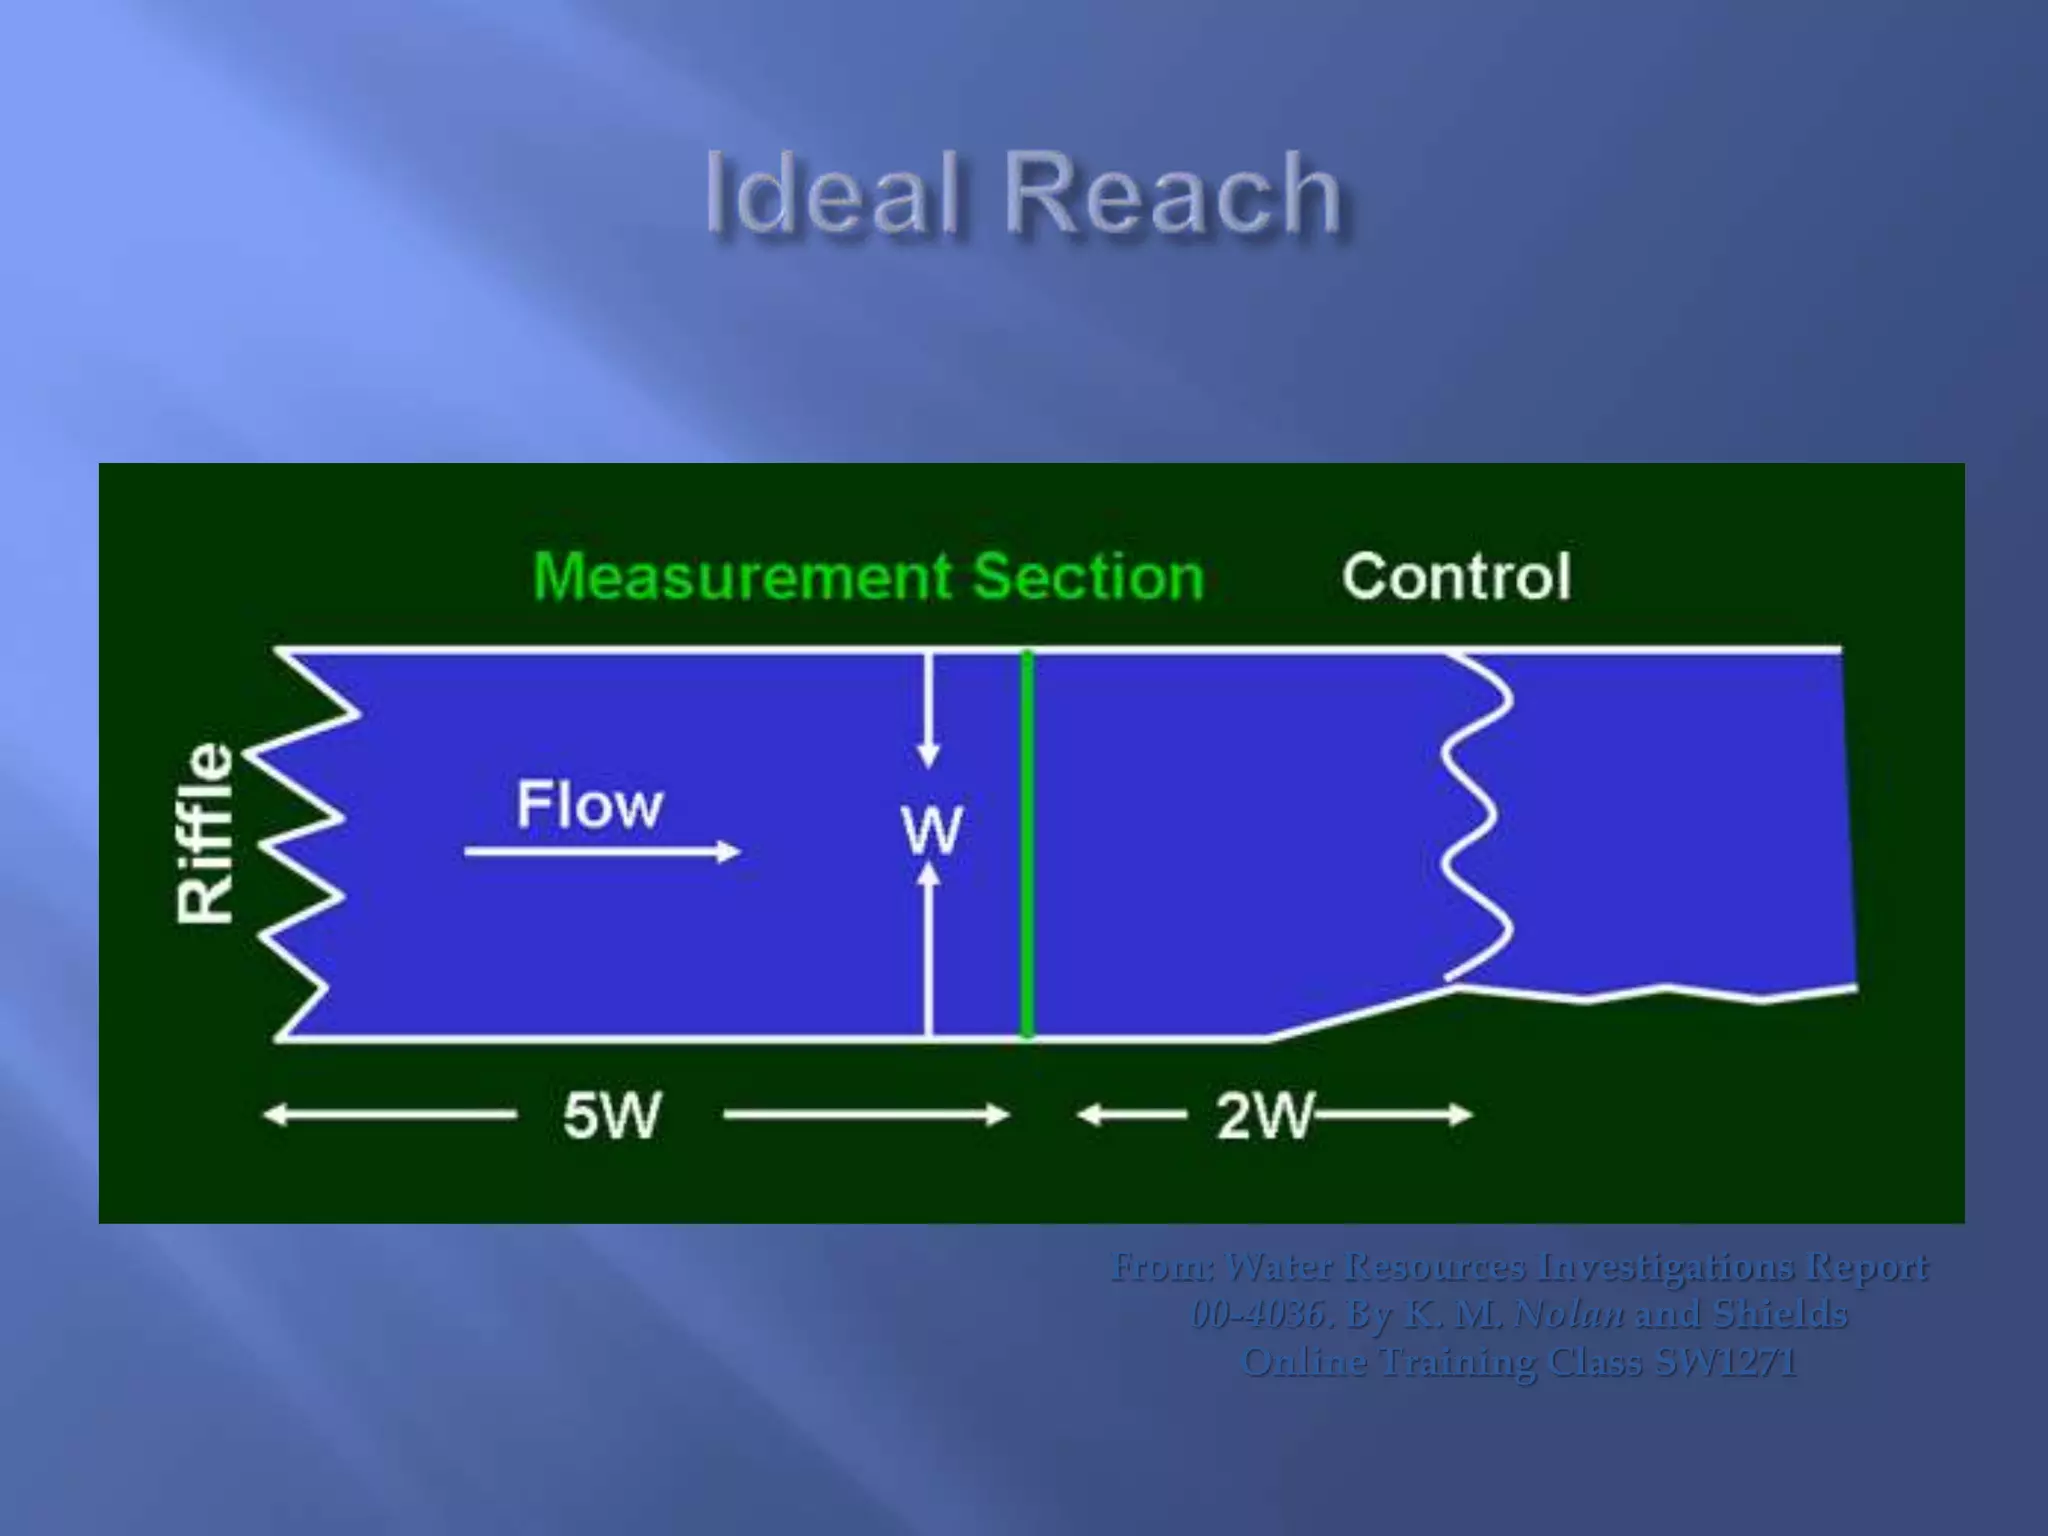
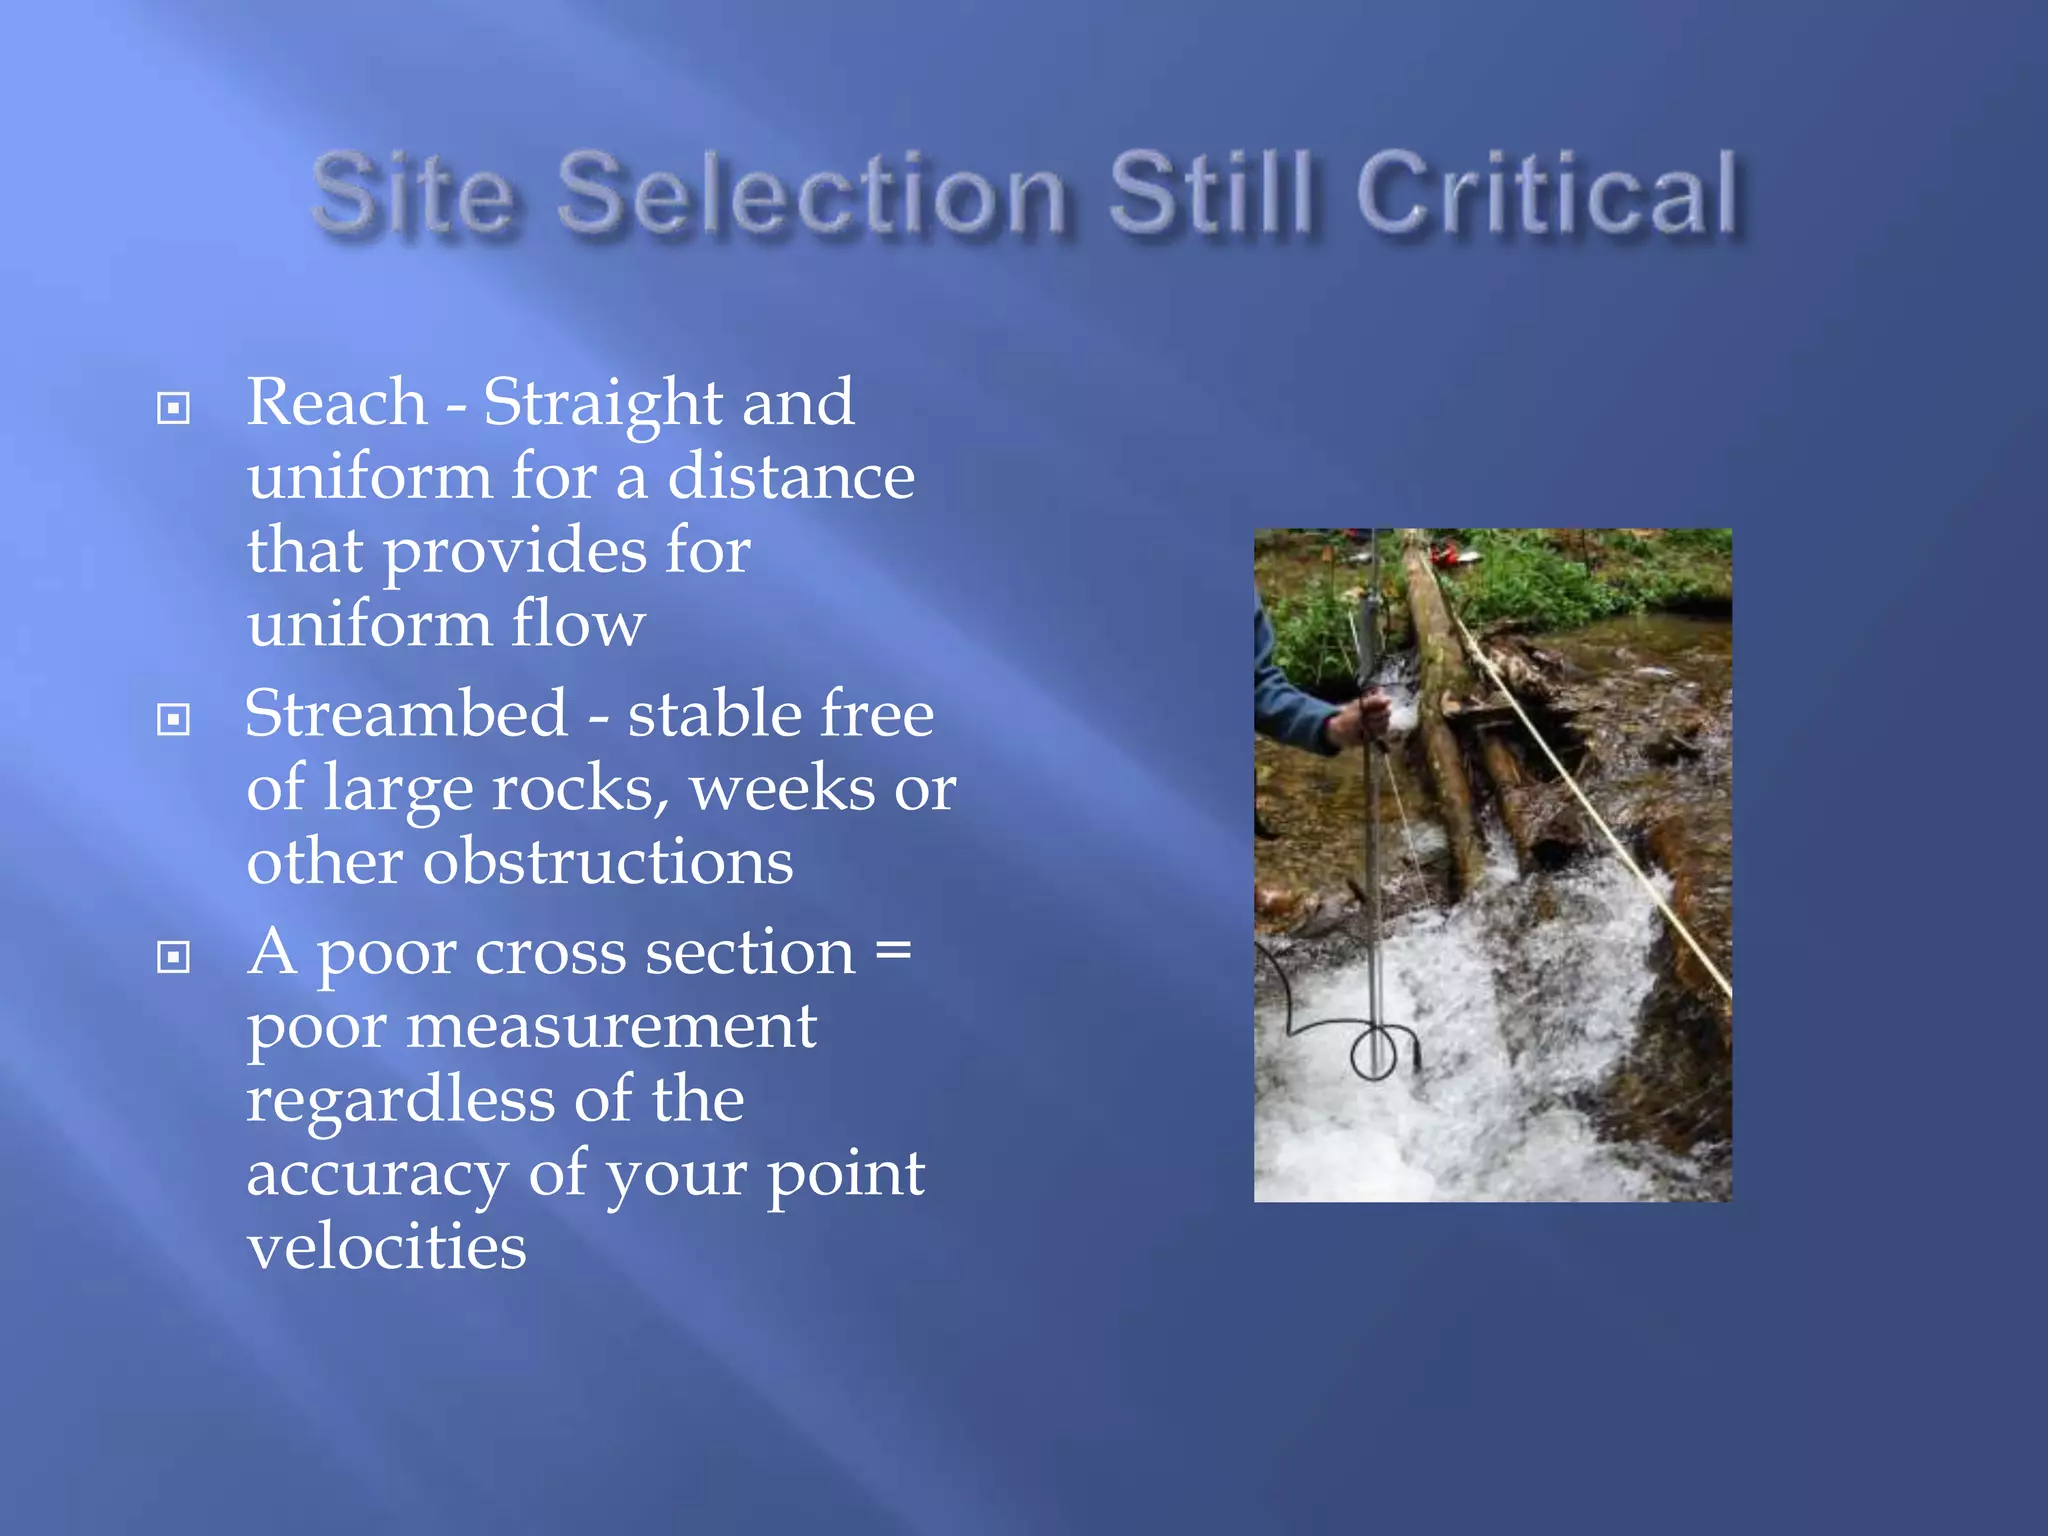
This document provides an overview of a training on acoustic measuring equipment held by the USGS in Klamath Falls and Chiloquin, Oregon in September 2011. It discusses the history of acoustic Doppler technology from early speed logs to modern ADCPs and flow trackers. The training covered the basic principles of how acoustic Doppler instruments work using Doppler shifts to measure water velocity, factors that affect accuracy, and methods for collecting and processing data to compute streamflow. Proper site selection and cross section setup were emphasized as important for obtaining accurate discharge measurements.
Simple, basic principles and techiniques for flow measurement.
college presentation
Please like and leave a comment if it was useful.
Also leave suggestions, if any.
It will help me improve.
Simple, basic principles and techiniques for flow measurement.
college presentation
Please like and leave a comment if it was useful.
Also leave suggestions, if any.
It will help me improve.
Delineating faults using multi-trace seismic attributes: Example from offshor...iosrjce
Techniques for delineating faults have been applied to a 3D seismic data acquired over parts of
offshore Niger Delta. The volumetric dip and azimuth of the seismic traces was first computed directly from the
seismic reflection data. Noise cancellation techniques were then applied to the data to highlight overall
structural dip trend. An attribute that highlight seismic discontinuities based on trace-trace similarity was then
computed over a user-defined window using the seismic reflectivity and smoothened dip data as input. The dip
and similarity volumes reveal a structural framework consisting of a major NE-SW trending lineament
separating two zones of contrasting structural styles. In the northern part of the lineament, deformation is
compressional, with NNE-SSW to N-S trending thrusts and folds. In the south, deformation is characterized by a
network of predominantly NW-SE trending extensional faults. Although the structural trend is clearly evident in
the computed dip volumes, estimating multi-trace similarity along structural dips has significantly improved the
ability to recognize faults in the data
DSD-INT 2017 Vegetated Flow Simulation using Delft3D for a Large-scale Outdoo...Deltares
Presentation by Un Ji, Korea Institute of Civil Engineering and Building Technology (KICT), Korea, at the Delft3D - User Days (Day 1: Hydrodynamics), during Delft Software Days - Edition 2017. Monday, 30 October 2017, Delft.
TOPICS COVERED:-
How SONAR works
Factors that affect the performance of a sonar unit
Factors that affect underwater acoustic propagation
in the ocean
Principles of sonar
Application of sonar.
Significance of frequency
Conclusion…
Evaluation of Morphometric Parameters Derived from CartoDEM and Aster GDEM wi...Dr Ramesh Dikpal
From three different sources viz. survey of India topographic map (1:50,000), CartoDEM (10 mts) and Aster GDEM (30 mts) morphometric parameters are derived and evaluated. Manually digitized the drainage network from toposheets and extracted drainage network system from CartoDEM and Aster GDEM using ArcGIS 10.2 software. Basic, derived and shape parameters are considered for basin analysis. The mean bifurcation ratio of the given basin for CartoDEM & Aster GDEM are having nearby values and also indicates some sort of geological control, high stream frequency (Fs) is indicative of high relief and low infiltration capacity of the bedrock pointing towards the increase in stream population with respect to increase in drainage density, low drainage density (Dd) leads to coarse drainage texture, value of Lg for topographic, CartoDEM and Aster GDEM data indicating very fine texture & fine texture respectively. From the shape parameters the Kumudvathi watershed indicates it is sub-circular and elongated. The results from the high resolution data will have the nearby values and less of % variation, whereas in low resolution data % of variation is more and will not meet criteria.
Dive into the innovative world of smart garages with our insightful presentation, "Exploring the Future of Smart Garages." This comprehensive guide covers the latest advancements in garage technology, including automated systems, smart security features, energy efficiency solutions, and seamless integration with smart home ecosystems. Learn how these technologies are transforming traditional garages into high-tech, efficient spaces that enhance convenience, safety, and sustainability.
Ideal for homeowners, tech enthusiasts, and industry professionals, this presentation provides valuable insights into the trends, benefits, and future developments in smart garage technology. Stay ahead of the curve with our expert analysis and practical tips on implementing smart garage solutions.
Hello everyone! I am thrilled to present my latest portfolio on LinkedIn, marking the culmination of my architectural journey thus far. Over the span of five years, I've been fortunate to acquire a wealth of knowledge under the guidance of esteemed professors and industry mentors. From rigorous academic pursuits to practical engagements, each experience has contributed to my growth and refinement as an architecture student. This portfolio not only showcases my projects but also underscores my attention to detail and to innovative architecture as a profession.
Transforming Brand Perception and Boosting Profitabilityaaryangarg12
In today's digital era, the dynamics of brand perception, consumer behavior, and profitability have been profoundly reshaped by the synergy of branding, social media, and website design. This research paper investigates the transformative power of these elements in influencing how individuals perceive brands and products and how this transformation can be harnessed to drive sales and profitability for businesses.
Through an exploration of brand psychology and consumer behavior, this study sheds light on the intricate ways in which effective branding strategies, strategic social media engagement, and user-centric website design contribute to altering consumers' perceptions. We delve into the principles that underlie successful brand transformations, examining how visual identity, messaging, and storytelling can captivate and resonate with target audiences.
Methodologically, this research employs a comprehensive approach, combining qualitative and quantitative analyses. Real-world case studies illustrate the impact of branding, social media campaigns, and website redesigns on consumer perception, sales figures, and profitability. We assess the various metrics, including brand awareness, customer engagement, conversion rates, and revenue growth, to measure the effectiveness of these strategies.
The results underscore the pivotal role of cohesive branding, social media influence, and website usability in shaping positive brand perceptions, influencing consumer decisions, and ultimately bolstering sales and profitability. This paper provides actionable insights and strategic recommendations for businesses seeking to leverage branding, social media, and website design as potent tools to enhance their market position and financial success.
7 Alternatives to Bullet Points in PowerPointAlvis Oh
So you tried all the ways to beautify your bullet points on your pitch deck but it just got way uglier. These points are supposed to be memorable and leave a lasting impression on your audience. With these tips, you'll no longer have to spend so much time thinking how you should present your pointers.
Can AI do good? at 'offtheCanvas' India HCI preludeAlan Dix
Invited talk at 'offtheCanvas' IndiaHCI prelude, 29th June 2024.
https://www.alandix.com/academic/talks/offtheCanvas-IndiaHCI2024/
The world is being changed fundamentally by AI and we are constantly faced with newspaper headlines about its harmful effects. However, there is also the potential to both ameliorate theses harms and use the new abilities of AI to transform society for the good. Can you make the difference?
Expert Accessory Dwelling Unit (ADU) Drafting ServicesResDraft
Whether you’re looking to create a guest house, a rental unit, or a private retreat, our experienced team will design a space that complements your existing home and maximizes your investment. We provide personalized, comprehensive expert accessory dwelling unit (ADU)drafting solutions tailored to your needs, ensuring a seamless process from concept to completion.
Unleash Your Inner Demon with the "Let's Summon Demons" T-Shirt. Calling all fans of dark humor and edgy fashion! The "Let's Summon Demons" t-shirt is a unique way to express yourself and turn heads.
https://dribbble.com/shots/24253051-Let-s-Summon-Demons-Shirt
You could be a professional graphic designer and still make mistakes. There is always the possibility of human error. On the other hand if you’re not a designer, the chances of making some common graphic design mistakes are even higher. Because you don’t know what you don’t know. That’s where this blog comes in. To make your job easier and help you create better designs, we have put together a list of common graphic design mistakes that you need to avoid.
Book Formatting: Quality Control Checks for DesignersConfidence Ago
This presentation was made to help designers who work in publishing houses or format books for printing ensure quality.
Quality control is vital to every industry. This is why every department in a company need create a method they use in ensuring quality. This, perhaps, will not only improve the quality of products and bring errors to the barest minimum, but take it to a near perfect finish.
It is beyond a moot point that a good book will somewhat be judged by its cover, but the content of the book remains king. No matter how beautiful the cover, if the quality of writing or presentation is off, that will be a reason for readers not to come back to the book or recommend it.
So, this presentation points designers to some important things that may be missed by an editor that they could eventually discover and call the attention of the editor.
Book Formatting: Quality Control Checks for Designers
3919841 (1).ppt
1. Introduction
to Acoustic
Measuring
Equipment
Klamath Falls and
Chiloquin, OR
September, 19 – 23,
2011
U.S. Geological Survey
TEchnical training in Support of
Native American Relations
(TESNAR) - 2011
Mark Uhrich, USGS, Portland, OR (mauhrich@usgs.gov)
Marc Stewart, USGS, Central Point, OR (mastewar@usgs.gov)
Glen Hess, USGS, Portland, OR (gwhess@usgs.gov)
2. Ocean going boats used “speed logs” to measure speed of the
boat.
“The first commercial ADCP, produced in the mid-1970’s,was an
adaptation of a commercial speed log” (Rowe and Young, 1979).
1980s Doppler technology continue to involve
Early 1990s ADCP become more widespread in the USGS and
other agencies.
2012 Acoustic based instruments become the most common
instrument type used in the USGS (Flowtrackers and ADCPs)
3. 3
Much of the material in the presentation is
borrowed from USGS Hydroacoustic Classes
5. Ceramic transducers send and receive
pulses of sound
Center transducer transmits the
sound, while the transducers on the
arms are receivers
Location of velocity measurement is
called the sample volume
Sample volume is located about 4
inches from the transmitting
transducer
Measures velocity based on the
Doppler shift
7. Crest
+
-
Trough
Water wave crests and troughs are points of
high and low water elevations.
Sound wave “crests” and “troughs” consist of bands of
high and low air or water pressure.
Trumpet ADCP Transducer
8. Uses Doppler shift to measure water velocity
The Doppler effect is the change in a sound's observed pitch (frequency)
caused by the relative velocities of the sound source and receiver.
9. fD = Doppler Shifted Frequency
fS = Source Frequency (frequency of ADCP)
V = Velocity of scatterers in water
C = Speed of Sound (dependent on water
char.)
fD = fS * V/C
10. V = fD / 2fS * C
V = water velocity =
scatterer velocity
Important
We assume that, on average, scatterer velocity
equals water velocity
Violation of this assumption will lead to errors
in water velocity computation.
Note: The 2 in the equation is result of two Doppler shifts, one
as the sound goes out and another as it returns
11. Water-velocity measurement is biased toward the fish velocity
Water
Fish:
Water
Stationary object:
Rock
Water-velocity measurement is biased toward zero
12. A temperature error of 4o C or salinity error of 12 ppt will
result in a 1% velocity error
The instrument must have an accurate temperature
sensor and must be configured for the correct salinity
Rule of thumb: Specific conductance generally below 5000
uS/cm should not significantly affect C
Policy: All acoustic instruments must have independent
temperature check
(within 2 degrees C)
V = (fD /2fS *)C
Important
Speed of sound (C) must be computed
accurately by the instrument.
13. Picture at
time T2
Picture at
time T1
S
V=S/(T2-T1)
To measure velocity,
ADCPs listen to the
returns at two
separate times
14. Usually ADCPs use PHASE CHANGE to measure the speed,
instead of measuring the change in frequency of the wave (how
far the cars have travelled)
Phase is the fraction of
a wave cycle elapsed
relative to a point – or
when thought of as the
wheel on the left, how
much it has rotated
15. Because we don’t know the direction the cars are traveling, we must account for both
positive and negative values (we measure a half rotation either direction)
Set the time between pictures (lag) to optimize the tire rotation for the expected
speed– Longer time (lag) = more precise measurement
Too long of time between picture (long lag) may cause the distance car travels to
exceeds a half rotation and result in a measurement error called ambiguity error
Short time (lag) limits precision (increased random noise), but decreases possibility
of an ambiguity error
Picture 1 Picture 2
16. Lag = Time between pulses in a ping
Long lag = accurate measurements
Long lag = low ambiguity velocity
Exceed ambiguity velocity = ambiguity error
Ambiguity error = inaccurate measurements
Lag needs to be optimized based on maximum speed
SonTek usually has short lags (no chance for ambiguity
errors but noisy – pictures close together and wheel
hasn’t turned much in lower velocites)
TRDI – usually has longer lags that need to be adjusted
for conditions (less noise, but chance for ambiguity
errors if not adjusted correctly)
17.
18. S
How well the two pictures can be aligned
If there is too long of a time between pictures, cars may be in different
locations relative to each other, or the to pictures could contain totally
different cars and the distance S may not be determined
19.
20. Produce sound waves (pulses) and then listen to returning sound
waves
ceramic element protected with a urethane coating
ADCPs use the same transducer to both transmits and receive the
pulses.
21.
22. 4 beams can be
resolved into: x, y, z
and error velocities
Since each Transducer only measures the velocity component parallel
to the beam, multiple transducers are needed
RiverRay forms 4 beams from
the single phased array
transducer
M9 only uses 4
beams at a time
to compute a
velocity
24. Error velocities should be
randomly distributed
areas of high area error velocities
may occur when water is not
flowing at similar magnitudes and
direction in all beams (example:
turbulence)
Error velocities may also be the
result of an instrument measuring
one beam velocity wrong
Behind
Bridge Pier
25. How the pulses are transmitted into the water
and sampled can vary and be optimized for the
conditions
This configuration is commonly called “water
mode”
Some of the newer ADCPs automatically adjust
the configurations for the environment on the
fly
Until recently the majority of ADCPs currently
in use must be set up prior to data collection
26. cell 1
cell 2
cell 3
echo echo echo echo
Transmitting
start end
Gate
1
Gate
2
Gate
3
Gate
4
Time
Blank
Bin 1
Bin 2
Bin 3
Bin 4
Distance
From
ADCP
cell 4
Blanking
A B C
28. The faster the boat travels,
the faster the velocity of the water relative to the ADCP.
29. ADCP’s can also measure the speed of the instrument
or boat by measuring the Doppler shift of a pulse off of
the bottom
This is called bottom tracking and assumes that the
streambed is stationary
Sediment transport on or near the streambed can affect
the Doppler shift of the bottom-tracking pulses, which
can result in the measured boat velocity being biased in
the opposite direction of the sediment movement. This
is referred to as a Moving Bed condition
30. Bottom Track pulses are also used to measure
depth
Typically 4 beam depths are averaged
SonTek also can use a vertical beam dedicated
to depth
31. A single pass across the river is called a transect, a
discharge measurement is usually comprised of
multiple transects averaged together
32. Measured Q = ∑(V x A)
V = Velocity perpendicular to
boat path for the ensemble
A = Depth Cell Size x Width
Width = boat speed x time
since last valid ensemble
32
Assumption made: the measured boat and water velocities are
representative of the boat and water velocities since the last valid
data. The longer it has been since the last valid data, the greater
the error may be in this assumption
The above is equal to the cross product of the boat and water speed x
depth cell size and the time since last ensemble, which is how
software computes Q in a depth cell
35. Velocity cross product (X-value), ft2/s2
f1
f3
f4
f5
fn
f2
Measured
Estimated
Power fit
Free surface
Distance
from
the
bed
(Z),
feet
Q in the top and
bottom unmeasured
areas is estimated for
each ensemble, based
on the measured data
The typical method is
to use a power fit of
the measured data,
but other options are
available when this is
not valid
36. 0 0
(-) (+)
(-) (+)
Distance
from
the
bed
(Z),
feet
Unidirectional Flow Bi-directional Flow
Velocity cross product (f-value), ft2/s2
Distance
from
the
bed
(Z),
feet
37. Range
from
Bottom
Range
from
Bottom
Water Velocity Water Velocity
Depending on direction, wind can either cause the profile to bend
either way at the water surface
The magnitude of this may cause the standard power
fit to be a poor choice for top extrapolation, in this case the
software has options to only use data near the
surface for estimating the top Q
38. dm=last measured depth
dm
Measured by ADCP
Measured by User
L = distance from last
ensemble to edge of water
L
The averaged measured velocity is
multiplied by the averaged
measured depth, the measured
length, and finally by a coefficient
to account for the shape of the
edge (.35 for triangle and .91 for
square)
Average multiple
ensembles to get
an accurate depth
and velocity
MEASURE the
edge distance.
Vm = last measured velocity
Vm
39. From: Water Resources Investigations Report
00-4036. By K. M. Nolan and Shields
Online Training Class SW1271
40. Right Q
Left Q
Bottom Q
Middle Q
Total Q = Left Q + Right Q + Top Q + Bottom Q + Middle Q
Top Q
41. From: Water Resources Investigations Report
00-4036. By K. M. Nolan and Shields
Online Training Class SW1271
Reach - Straight and uniform for a
distance that provides for uniform
flow
Streambed - stable free of large
rocks, weeks or other obstructions
A poor cross section = poor
measurement regardless of the
accuracy of your point velocities
42. Reach - Straight and
uniform for a distance
that provides for
uniform flow
Streambed - stable free
of large rocks, weeks or
other obstructions
A poor cross section =
poor measurement
regardless of the
accuracy of your point
velocities
Editor's Notes
Here are some of the commonly used ADCP’s.
What is an ADCP?
First its acoustic, meaning that it uses sound to make its measurements.
It uses sound to measure velocity using the Doppler shift principle. Whether you realize it or not you are familiar with this principal. It is what changes the pitch of the horn on a passing car or train. A sound approaches you the sound waves or compressed and you hear a higher pitch. When the sound is moving away the sound waves or stretched an you hear a sound with a lower frequency.
Using this technology through water the ADCP measures the velocity of the water.
The ADCP measures profiles of water velocity, rather than sampling the water column at discrete points.
Now we will discuss the basic concepts of how hydroacoustic instruments work.
You are probably familiar with water waves. Water waves have crests and troughs which are high and low water elevations.
[CLICK]
Sound waves are similar but their crests and troughs are areas of high and low pressure in whatever medium the sound is traveling through, which in the cause of an adcp is the water in the stream[CLICK]
The frequency of the sound may be audible to the human ear such as the sound of a trumpet.
[CLICK]
Or it may be a frequency that we cannot hear such as the sound transmitted from a transducer.
Hydroacoustic instruments can use the change in frequency, called Doppler shift, to determine speed.
I am sure you have heard the pitch of a siren on a police car, ambulance, fire truck or horn on a train sound higher in pitch as it approached you and lower in pitch as it drove past and away from you.
This change in sound caused by the vehicle coming towards you and then passing you and driving away from you is the Doppler shift.
As a sound source travels towards you, the sound waves are compressed and the sound you hear has a higher pitch or frequency than the sound actually being transmitted.
Conversely, as a sound source travels away from you the sound waves are stretched and the sound you hear has a lower pitch are frequency than the sound actually being transmitted. By measuring the change in sound frequency and knowing the frequency of the sound being transmitted the speed of the sound source can be computed.
Note: either the source of the sound or the sink (listener) can move or both.
GOOD link to more info on the doppler shift:
http://imagine.gsfc.nasa.gov/YBA/M31-velocity/Doppler-shift-3.html
The equation for computing the velocity of the sound source from the Doppler shifted sound frequency is shown here.
We know source frequency and Speed of sound (based on our instrument and the salinity and temperature of the water)
The instrument can measure the doppler shifted frequency
Therefore, we can compute Velocity
As we have already mentioned, hydroacoustics instruments do not measure the velocity of the water because pure water is acoustically transparent, but measures the velocity and direction of small particles and organisms, called scatterers, in the water column. We assume water velocity = scatterer velocity. If this assumption does not hold we introduce errors into our water velocity computations.
Examples where the scatterer velocity is not equal to water velocity. (Click) In case 1 the fish is the scatterer– the velocity of the fish is measured, and the fish may be moving in a completely different speed and direction than the water. (Click) A large stationary object such as a rock will bias velocities toward the speed of the object which is zero.
Speed of sound must be computed accurately to get the velocity measurement right. In the equation for speed of sound underwater, temperature is the largest factor affecting C. Therefore temperature must be accurately measured by the instrument at the transducer head to accurately compute C. Salinity is another Important
factor.
(Click)
A temperature error of 2 degrees celsius or a salinity error of 5 ppt would result in approximately a 1 percent error in measured velocity.
We are going to measure the speed of an automobile on a road using a strobe light and a high speed camera. Consider road at night with cars moving at a steady rate of speed. The posts have been installed within the camera’s field-of-view and are a known distance apart. A strobe light is actuated and while the road is illuminated the camera takes two high-speed photographs. When the investigator examines the photograph negatives he finds that by lining up or synchronizing the images of the cars on the two photographic negatives he can determine the distance traveled by the cars by measuring the apparent shift in position of the reference posts. He can then calculate auto speeds by dividing the distance between the posts by the lag-time between the two photos.
If the strobe flashes become acoustic pulses, the cars become reflective particles in the water column, and the pictures become the received reflected signals, this scenario becomes roughly analogous to the workings of a narrow-band ADCP system.
The drawback with such a system is that the strobe pulse dissipates very fast and the two photos must be taken within a very short interval (while the same cars are still illuminated by the single strobe). This means that time lags are very short, and the distance traveled by the cars (reflectors) is very short, and therefore, the car speeds cannot be measured very precisely. Because of the above-mentioned limitations, velocity measurements made using the narrow band technology are noisy.
A more accurate measurement could be made if the time lag could be longer, however, just like the strobe, the acoustic energy dies out very quickly. The time lag cannot be longer than the pulse length and in fact must be much shorter. But for a more accurate measurement we need to make the time lag longer.
The above animation shows a rotating wheel. On the wheel there is a blue blob
which goes round and round. When viewed 'flat on' we can see that the blob is
moving around in a circle at a steady rate. However, if we look at the wheel
from the side we get a very different picture. From the side the blob seems to
be oscillating up and down. If we plot a graph of the blob's position (viewed
from the side) against time we find that it traces out a sinewave shape which
oscillates through one cycle each time the wheel completes a rotation. Here,
the sine-wave behavior we see when looking from the side 'hides' the underlying
behavior which is a continuous rotation.
GIF from http://www.st-and.ac.uk/~www_pa/Scots_Guide/info/signals/complex/round.gif
Usually the ADCPs use PHASE CHANGE to measure the speed, instead of simply measuring the change in frequency (or how far the cars have travelled.
Phase Change is like measuring
Because we don’t know the direction the cars are traveling, we must account for both positive and negative values (we measure a half rotation either direction)
Set the time between pictures (lag) to optimize the tire rotation for the expected speed– Longer time (lag) = more precise measurement
Too long of time between picture (long lag) may cause the distance car travels to exceeds a half rotation and result in a measurement error called ambiguity error
Short time (lag) limits precision (increased random noise), but decreases possibility of an ambiguity error
how much the wheels on the cars have rotated
So what does all of this mean? What do you need to understand from this information.
First long lags lead to accurate measurements. However, in Doppler just like in life nothing is free.
Long lags result in a low ambiguity velocity, therefore, limiting the maximum velocity that can be measured.
If the ambiguity velocity is exceed, there is an ambiguity error, which will be a significant error in your data and cause inaccurate velocities and maybe discharges.
Therefore, we need to optimize the lag (ambiguity velocity) based on the maximum speed of the water and boat.
Ambiguity errors are usually very obvious in single ping data.
[CLICK]
In the stick-ship plot ambiguity errors result in very high velocities often in the wrong direction.
[CLICK]
A contour plot of the error velocity can also be used to find ambiguity errors. Remember that the error velocity should be randomly distributed, however, it is clear from this plot that there are vertical strips. These are caused by ambiguity errors.
Back to our highway analogy, the correlation corresponds to how well the cars from the two pictures can be aligned.
Hydroacoustic instruments use transducers to transmit and receive sound waves. A transducer consists of a ceramic element that is caused to deform or vibrate by application of an electrical current. The ceramic element is usually protected by urethane. The transducers used in ADCPs are monostatic, meaning they both transmit and receive sound waves.
Hydroacoustic instruments and only measure velocity of the scatterers parallel to the beam. This is also called a radial velocity.
If the scatterers in this diagram are moving in the direction of the large arrow, only the component of the vector parallel to the acoustic beam would be measured.
What velocity would we measure if we pointed a transducer straight down in the water column? Only the vertical velocity, because the horizontal velocity would be perpendicular to the beam. This is why the ADCP has multiple transducers that are tilted in different directions.
ADCP’s can only measure the velocity components parallel to the beams present in the ADCP. However, if we assume that the velocity is the same in each beam then we can use trigonometric relations to resolve the beam velocities into something more useful to use, velocity in the horizontal (x and y) and vertical (z) directions. Therefore, beam velocities from three beams are necessary. Sontek typically only produces three beam systems and thus can measure the x, y, and z components of the velocity field. RDI however, produces four beam systems. The fourth beam is not required to compute the horizontal and vertical velocities but it does allow the computation of what has been called the error velocity.
The redundancy within the 4 transducers (only 3 would be needed for 3D vectors) is Since the doppler shift is directional and each beam is only measuring a small component of velocity parallel to the beams, when the radial velocities are resolved into horizontal and vertical components, the assumption is made that all beams are measuring a homogeneous volume of water (seeing the same velocity magnitude and direction). Remember the instrument is looking at the individual beams not the entire volume of water contained inside the boundary of the four beams.
What are the potential sources of error?
A vortex or eddy in one beam
Random errors
Some instruments have an additional fourth beam. The fourth beam is not required to compute the horizontal and vertical velocities but it does allow the computation of what has been called the error velocity, which is the difference in vertical velocity for the beam pairs.
The error velocity gives a an indication of flow homogeneity and is an indicator of the validity of the assumptions used to compute the horizontal and vertical velocity components.
This graph explains how observations are compartmented into bins.
Bins cover sections of the probed depth. They represent information about the average velocity for specific areas within the cross-section.
In this graph, we see how information for a single transducer is organized to create the Bins.
Vertically, the distance from the ADCP increases towards the top.
Horizontally, time increases towards the right.
In A, the transducers start to transmit signals in the water.
The signal travels diagonally in this graph. It gets further away from the ADCP and time goes by. Already, signals are echoed back but the transducers are not listening.
In B, the ADCP stops transmitting. A period of rest is then required to let vibrations in the transducers calm down. Only then will they be used to listen. This represents the blanking distance.
In C, the ADCP is ready to start listening to echos. All the information obtained after C is then correlated and averaged until Gate 1 is reached. The information for the area covered forms the Bin 1 data.
Then, information obtained after Gate 1 is also correlated and averaged until Gate 2. This represent the Bin 2 data.
The process continues for the following bins.
ADCP’s can be deployed from a boat and measure velocity profiles. It is similar to having a whole string of velocity meters deployed. The cup meters measures the velocity in discrete layers. The ADCP performs a similar processes small parts of the entire echo individually thus producing multiple velocity measurements. The layers are frequently referred to as a depth cell or bin.
The water velocity measured by an ADCP deployed on a moving boat is the velocity of the water passing by the ADCP, which we will refer to as the relative water velocity (it is relative to the instrument). This relative water velocity includes the velocity of both the boat and water. Therefore, as the boat moves faster, the relative water velocity measured by the ADCP increases. Since we are interested in the actual water velocity referenced to a fixed location, the velocity of the boat must be measured and removed from the relative water velocity measured by the ADCP.
ADCP’s can also measure the speed of the instrument or boat by measuring the doppler shift of a pulse off of the bottom
This is called bottom tracking and assumes that the streambed is stationary
Sediment transport on or near the streambed can affect the Doppler shift of the bottom-tracking pulses, which can result in the measured boat velocity being biased in the opposite direction of the sediment movement. This is referred to as a Moving Bed condition
ADCP Discharge Measurement
Discharge is the total volume of water flowing through a given cross-section of water per unit of time. With an ADCP and WinRiver the total volume discharge is computed for each ADCP ensemble (vertical profile) from a moving boat. There is no need to stop and make individual measurements.
ADCP Measures Flow through some arbitrary surface
An important feature of this system is that discharge can be measured over an irregular path. Instead of measuring flow through a PLANE like we do with Price AA measurements, with an ADCP we are measuring flow through a SURFACE (you may think of it as an irregular shaped weir). If you project the ship track onto the bed, imagine a surface rising vertically above that projected ship track. The SOFTWARE (WinRiver) is computing flow through THAT surface, the hardware measures the velocity, depth, and ship track.
In this picture, we see rectangles which are the representation of measured Depth Cells.
The different colors represent the different velocity of the flow passing through these surface areas.
For each of these surface elements, the discharge can then be easily calculated.
It is the product of the average flow velocity perpendicular to the surface and the surface area.
Q = Velocity x Area.
The total Q for the measured area is then the summation of every partial discharge over every bin.
But as we will see, there are unmeasured sections, and to obtain the total discharge over an entire cross section, the data that is not available will have to be modeled in order to complete the picture.
Unfortunately the ADCP is unable to measure the entire water column.
At the top, the ADCP must be immersed in the water and there is a blanking distance below the transducer where data cannot be collected. The blanking distance is a result of the transducers being both the sound source and sink (speaker and microphone). Think of a Chinese gong. When it is stuck it continues to vibrate and send out sound for a period of time. The operation of the transducers are similar. When power is sent to the transducers they vibrate to send the sound into the water column. These transducers cannot be used to listen to the backscattered acoustic energy until the ringing (vibration) has died down to a level that will not contaminate the received acoustic energy. The distance that the sound moves during this period is the blanking distance.
The ADCP also cannot measure all the way to the streambed. When acoustic transducers produce sound, most of the energy is transmitted in the main beam. Unfortunately there are also side lobes that contain less energy that propagate from the transducer as well. These side lobes are not a problem in most of the water column because they are such low energy. However, when the side lobe strikes the streambed, the streambed is a good reflector of this acoustic energy and much of the energy is reflect back to the transducer. Because of the slant of the beams the acoustic energy in the main beam is reflecting off of scatters in the water column near the bed at the same time that the side lobe is reflecting from the streambed. The energy in the main beam reflected from these scatters in the water column is relative low compared to the energy sent out from the transducer and the energy in the side lobe returned from the streambed is sufficient to contaminate the energy from the main beam near the bed. Therefore, there is an area near the bottom that cannot be measured due to side lobe interference. This distance is computed as (1-cos(system angle))*100. So for a 20 degree system it is 6% of the range from the transducer.
The middle, light blue is where the ADCP measures velocity and directly computes discharge
The top layer (gray) is where the velocities can not be measured, due to the ADCP draft and blanking distance
The bottom layer is estimated do to side lobe interference
The edges are too shallow to measure and also need to be estimated.
What assumption could we make to estimate the top and bottom discharges? What assumption is made in cup meter measurements?
We could assume a logarithmic velocity profile. [CLICK] [CLICK] An alternative is to use the 1/6th power law is essentially the same as the logarithmic profile but is computationally easier to fit to the data.
This provides a much better estimate of the discharge in the bottom unmeasured area.
The ADCP software defaults to a 1/6th power, but depending on the shape of the measured data other powers can be entered by the user.
There are other methods that are software specific and will be discussed later.
This
Using the power curve in unidirectional flow conditions is very common, however, using the power fit in bidirection flow (salinity, temperature, and wind-induced) condition can produce erroneous results. [CLICK] The power curve does not fit the data at all and even predicts a bottom discharge with the wrong sign.
It is recommended that when the depths near the shore become too shallow for two good bins in the profile that the transect be stopped and the discharge in the edge be estimated from the available information. So what information is available? [CLICK] the ADCP has the depth of the last ensemble [CLICK] and the velocities in the last ensemble [CLICK]. To ensure accurate depths and velocities it is recommended that the boat be held in position and 10 ensembles be collected, [CLICK] which will be automatically averaged in WinRiver. We also have access to a value that [CLICK] can be measured by the user, [CLICK] the distance from the end of the transect to the edge of water. [CLICK] it is important that this distance be measured. Visual estimates are typically too short and will lead to inaccurate discharges.
[CLICK] Now what else to we know? First, just like at the bottom [CLICK] we know the velocity has to go to zero at the bank. Second, [CLICK] if we assume either a triangular or rectangular edge we can compute the missing area using the depth from the ADCP and the distance we measured to shore. Third, we know that Q=AV.
The diagram summarizes attributes of an ideal measurement section, as previously described. Ideally, the measuring section should be 5 channel widths below the most upstream riffle and approximately 2 channel widths above the control
We have explained how the “Middle Q” or measured discharge is computed and how the unmeasured discharge information is modeled and estimated. Throughout our exploration of the process, we have seen that even though the analysis of data requires advanced physics, the application of the principles for the discharge computation is relatively simple.
The ultimate goal of this presentation was to understand how Acoustic Doppler Current Profilers (ADCPs) acquire and process data to measure discharge. The last remaining step is the computation of the total discharge and this is straight forward:
Once the middle section data is obtained and once information about the cross section edge shape, distances to shore and instrument draft is provided, the software can then compute the sum of all discharge sections for the cross section. This value is a simple summation of the Left, Right, Top, Bottom and Middle Qs.
Based on this review of ADCP principles, it should now be easier to understand the implications of ADCP implementation procedures described in other lessons and ultimately get the maximum precision from this instrument.
The diagram summarizes attributes of an ideal measurement section, as previously described. Ideally, the measuring section should be 5 channel widths below the most upstream riffle and approximately 2 channel widths above the control