Download as PDF, PPTX

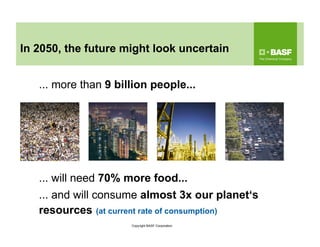
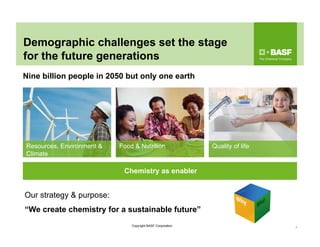
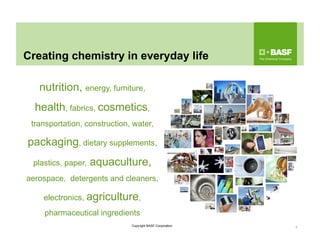
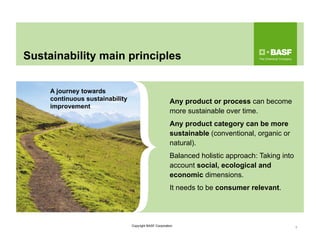
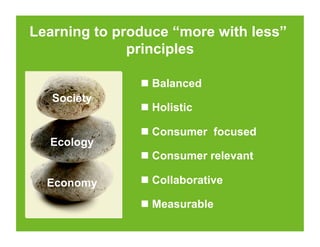
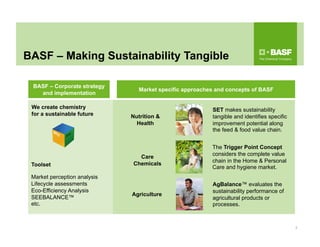
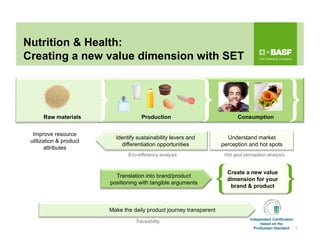
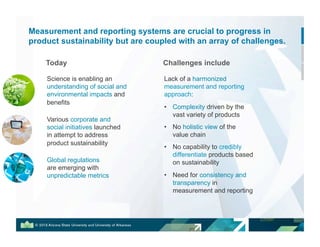
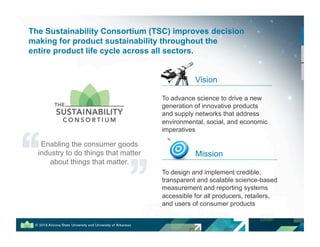
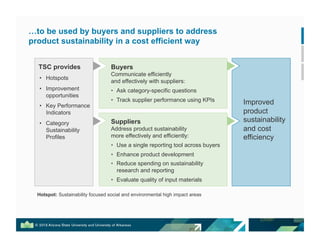
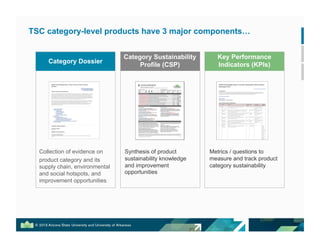
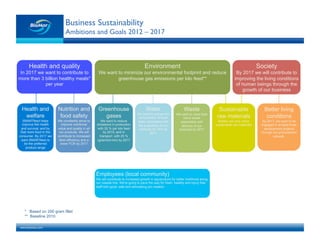
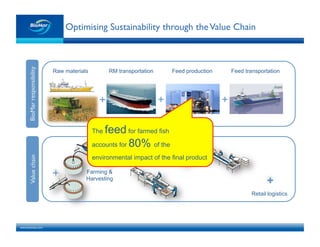

The document discusses the need for sustainable product development to address the challenges of a growing global population and resource consumption. It emphasizes market-based approaches and collaborative strategies focused on scientific measurement and reporting to improve product sustainability across various sectors. Key initiatives from organizations like BASF and the Sustainability Consortium are highlighted as frameworks for driving innovation and accountability in sustainability practices.


![Fmi final gen merch cat man webinar[1]](https://cdn.slidesharecdn.com/ss_thumbnails/fmifinalgenmerchcatmanwebinar1-110209195309-phpapp02-thumbnail.jpg?width=640&height=640&fit=bounds)
![Fmi final gen merch cat man webinar[1]](https://cdn.slidesharecdn.com/ss_thumbnails/fmifinalgenmerchcatmanwebinar1-110209193206-phpapp01-thumbnail.jpg?width=640&height=640&fit=bounds)
![Fmi final fresh cat man webinar[1]](https://cdn.slidesharecdn.com/ss_thumbnails/fmifinalfreshcatmanwebinar1-110209195236-phpapp02-thumbnail.jpg?width=640&height=640&fit=bounds)
![Fmi final beverage cat man webinar[1]](https://cdn.slidesharecdn.com/ss_thumbnails/fmifinalbeveragecatmanwebinar1-110209195203-phpapp01-thumbnail.jpg?width=640&height=640&fit=bounds)
![Fmi final beverage cat man webinar[1]](https://cdn.slidesharecdn.com/ss_thumbnails/fmifinalbeveragecatmanwebinar1-110209193045-phpapp01-thumbnail.jpg?width=640&height=640&fit=bounds)


