Dow Theory - Trend
•
0 likes•428 views

This document presents the results of a sensitivity test on a Dow Theory trend trading strategy. It includes figures showing the profit factor, Sharpe ratio, ulcer performance index, compound annual growth rate, maximum drawdown, percentage of profitable trades, and average win/average loss ratio of the strategy to evaluate its risk-adjusted performance. An equity curve also shows how the strategy performed under the sensitivity test.

Recommended
More Related Content
What's hot
What's hot (13)
Viewers also liked
Recently uploaded
Recently uploaded (20)
Dow Theory - Trend
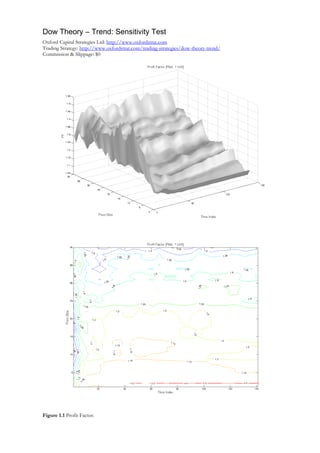
- 1. Dow Theory – Trend: Sensitivity Test Oxford Capital Strategies Ltd: http://www.oxfordstrat.com Trading Strategy: http://www.oxfordstrat.com/trading-strategies/dow-theory-trend/ Commission & Slippage: $0 Figure 1.1 Profit Factor.
- 2. Figure 1.2 Sharpe Ratio.
- 3. Figure 1.3 Ulcer Performance Index.
- 4. Figure 1.4 Compound Annual Growth Rate.
- 5. Figure 1.5 Maximum Drawdown.
- 6. Figure 1.6 Percent Profitable Trades.
- 7. Figure 1.7 Average Win/Average Loss Ratio.
- 8. Figure 1.8 Equity ($): Sensitivity Test.