1. LONG ONLY FUNDS SELECTION
OUTPERFORMANCE AND CONDITIONAL OUTPERFORMANCE VS MORNINGSTAR PEER GROUP
www.alternativesoft.com London: +44 (0)20 7510 2003information@alternativesoft.com
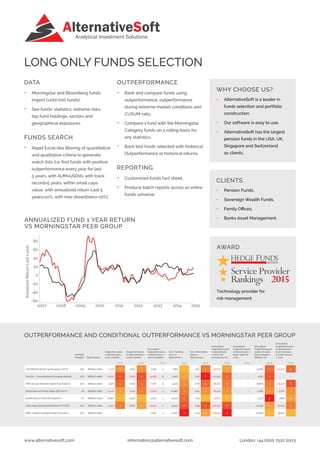
ANNUALIZED FUND 1 YEAR RETURN
VS MORNINGSTAR PEER GROUP
80
60
40
20
0
-20
-40
-60
AnnalizedReturnLast1year
2007 2008 2009 2010 2011 2012 2013 2014 2015
WHY CHOOSE US?
• ➢AlternativeSoft is a leader in
funds selection and portfolio
construction.
• Our software is easy to use.
• AlternativeSoft has the largest
pension funds in the USA, UK,
Singapore and Switzerland
as clients.
CLIENTS
• ➢Pension Funds.
• ➢Sovereign Wealth Funds.
• ➢Family Offices.
• ➢Banks Asset Management.
AWARD
Technology provider for
risk management
Service Provider
Rankings 2015
DATA
• ➢Morningstar and Bloomberg funds
import (>200’000 funds).
• ➢See funds’ statistics, extreme risks,
top fund holdings, sectors and
geographical exposures.
FUNDS SEARCH
• ➢Rapid Excel-like filtering of quantitative
and qualitative criteria to generate
watch lists (i.e. find funds with positive
outperformance every year for last
5 years, with AUM>USD1b, with track
record>5 years, within small caps
value, with annualized return Last 5
years>10%, with max drawdown>-10%).
OUTPERFORMANCE
• ➢Rank and compare funds using
outperformance, outperformance
during extreme market conditions and
CUSUM ratio.
• ➢Compare 1 fund with the Morningstar
Category funds on a rolling basis for
any statistics.
• ➢Back test funds selected with historical
Outperformance or historical returns.
REPORTING
• ➢Customized funds fact sheet.
• ➢Produce batch reports across an entire
funds universe.
Portfolio
Weights Benchmarks
Outperformance
vs Benchmark 1
Last 3 months
Outperformance
vs Benwchmark 1
Last 6 months
Annualized
Outperformance
vs Benchmark 1
since inception
Ann. Tracking
Error vs
Benchmark 1
Ann. Information
Ratio vs
Benchmark 1
Annualized
Outperformance
vs Benchmark
1 Given VIS
increase by +5%
Annualized
Outperformance
vs Benchmark 1
Given High VIX
> 25%
Annualized
Outperformance
vs Benchmark 1
Given Negative
S&P500 <0%
Annualized
Outperformance
vs Benchmark 1
Given Increase
in credit spread
> +0.4%
Rank Rank Rank Rank Rank Rank Rank Rank Rank
S.W. Mitchell Small Cap European UCITS 20% S&P500 Index -1.07% 3 2.10% 3 4.46% 4 7.78% 1 -0.57 4 -64.60% 2 – 10.18% 5 -147.50% 5
Van Eck - Unconstrained Emerging Markets 20% S&P500 Index -6.05% 6 -7.91% 6 -11.83% 6 9.16% 2 -1.20 7 -101.39% 5 – 4.25% 6 –
RWC Europe Absolute Alpha Fund Class B 20% S&P500 Index -3.59% 5 0.03% 5 -7.38% 5 9.43% 3 -0.78 5 -86.73% 4 – 16.85% 4 -174.45% 6
Bankia Banca Privada Índice S&P 500 FI 0% S&P500 Index -0.24% 2 0.14% 4 -0.52% 2 10.96% 4 -0.05 3 -81.43% 3 – 17.18% 3 -5.06% 3
Bankia Banca Privad RV Espana FI 0% S&P500 Index 6.96% 1 9.75% 1 0.43% 1 14.74% 5 0.03 1 -25.81% 1 – 0.77% 7 7.58% 2
Salus Alpha Directional Markets (VT) (UCI) 20% S&P500 Index -2.45% 4 6.62% 2 -14.33% 7 15.15% 6 -0.95 6 -117.35% 6 – 22.33% 2 -30.24% 4
RWC Cautious Absolute Rate & Currency 20% S&P500 Index – – -0.65% 3 17.37% 7 -0.04 2 -128.94% 7 – 43.44% 1 39.65% 1
AlternativeSoftAnalytical Investment Solutions