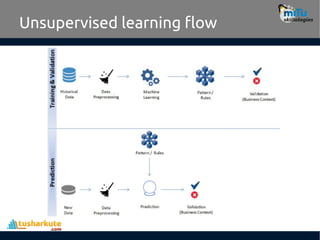
Clustering
• Clustering isan unsupervised learning problem.
• Key objective is to identify distinct groups
(called clusters) based on some notion of
similarity within a given dataset.
• Clustering analysis origins can be traced to the
area of Anthropology and Psychology in the
193’s.
• The most popularly used clustering techniques
are k-means (divisive) and hierarchical
(agglomerative).
4.
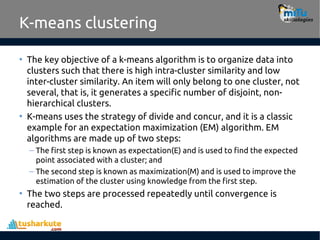
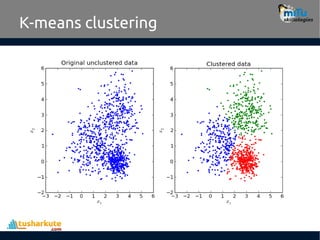
K-means clustering
• Thekey objective of a k-means algorithm is to organize data into
clusters such that there is high intra-cluster similarity and low
inter-cluster similarity. An item will only belong to one cluster, not
several, that is, it generates a specific number of disjoint, non-
hierarchical clusters.
• K-means uses the strategy of divide and concur, and it is a classic
example for an expectation maximization (EM) algorithm. EM
algorithms are made up of two steps:
– The first step is known as expectation(E) and is used to find the expected
point associated with a cluster; and
– The second step is known as maximization(M) and is used to improve the
estimation of the cluster using knowledge from the first step.
• The two steps are processed repeatedly until convergence is
reached.
Generalized algorithm
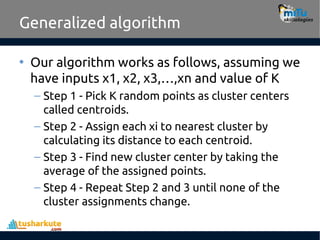
• Ouralgorithm works as follows, assuming we
have inputs x1, x2, x3,…,xn and value of K
– Step 1 - Pick K random points as cluster centers
called centroids.
– Step 2 - Assign each xi to nearest cluster by
calculating its distance to each centroid.
– Step 3 - Find new cluster center by taking the
average of the assigned points.
– Step 4 - Repeat Step 2 and 3 until none of the
cluster assignments change.
7.
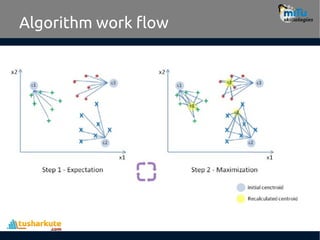
Algorithm work flow
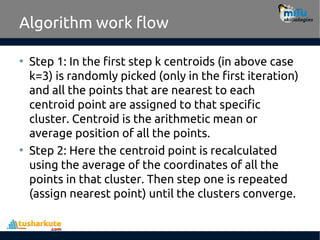
•Step 1: In the first step k centroids (in above case
k=3) is randomly picked (only in the first iteration)
and all the points that are nearest to each
centroid point are assigned to that specific
cluster. Centroid is the arithmetic mean or
average position of all the points.
• Step 2: Here the centroid point is recalculated
using the average of the coordinates of all the
points in that cluster. Then step one is repeated
(assign nearest point) until the clusters converge.
Limitations
• K-means clusteringneeds the number of
clusters to be specified.
• K-means has problems when clusters are
of differing sized, densities, and non-
globular shapes.
• Presence of outlier can skew the results.
10.
Use cases
• K-Meansis widely used for many
applications.
– Image Segmentation
– Clustering Gene Segmentation Data
– News Article Clustering
– Clustering Languages
– Species Clustering
– Anomaly Detection
11.
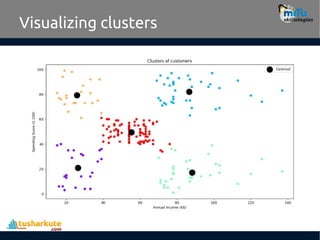
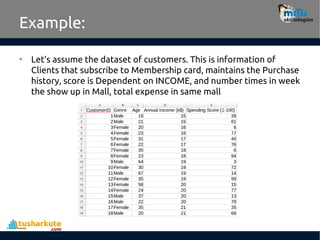
Example:
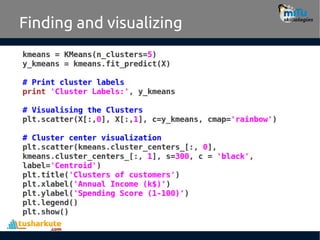
• Let’s assumethe dataset of customers. This is information of
Clients that subscribe to Membership card, maintains the Purchase
history, score is Dependent on INCOME, and number times in week
the show up in Mall, total expense in same mall
How many clusters?
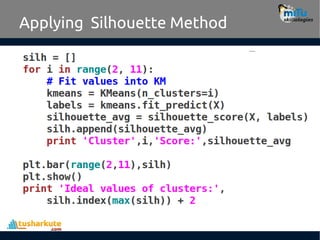
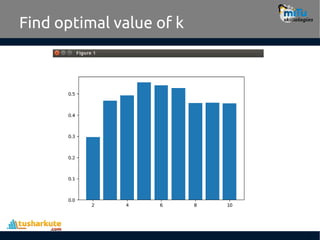
•There are two commonly used methods
to determine the ideal number of clusters
possible in K-means –
–Elbow Method
–Silhouette Method
14.
How many clusters?
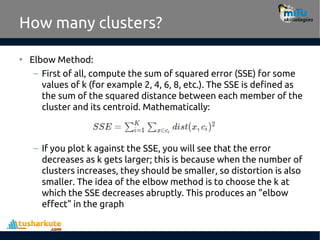
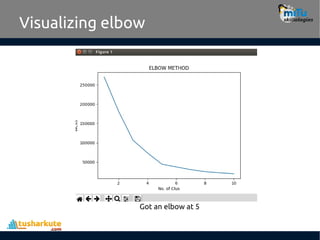
•Elbow Method:
– First of all, compute the sum of squared error (SSE) for some
values of k (for example 2, 4, 6, 8, etc.). The SSE is defined as
the sum of the squared distance between each member of the
cluster and its centroid. Mathematically:
– If you plot k against the SSE, you will see that the error
decreases as k gets larger; this is because when the number of
clusters increases, they should be smaller, so distortion is also
smaller. The idea of the elbow method is to choose the k at
which the SSE decreases abruptly. This produces an "elbow
effect" in the graph
15.
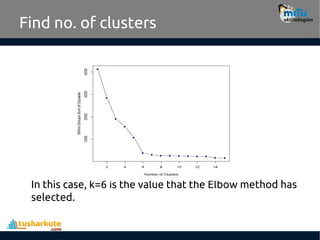
Find no. ofclusters
In this case, k=6 is the value that the Elbow method has
selected.
The Kmeans() function
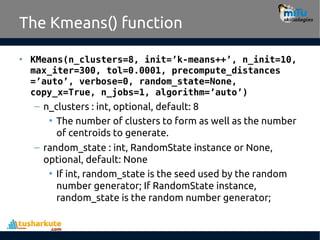
•KMeans(n_clusters=8, init=’k-means++’, n_init=10,
max_iter=300, tol=0.0001, precompute_distances
=’auto’, verbose=0, random_state=None,
copy_x=True, n_jobs=1, algorithm=’auto’)
– n_clusters : int, optional, default: 8
• The number of clusters to form as well as the number
of centroids to generate.
– random_state : int, RandomState instance or None,
optional, default: None
• If int, random_state is the seed used by the random
number generator; If RandomState instance,
random_state is the random number generator;
18.
The Kmeans() functionattributes
• cluster_centers_ : array, [n_clusters, n_features]
– Coordinates of cluster centers
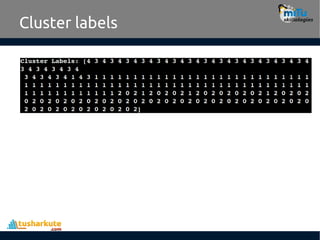
• labels_ : :
– Labels of each point
• inertia_ : float
– Sum of squared distances of samples to their
closest cluster center.
Silhouette Method
• Silhouetteanalysis is a way to measure how close each point in
a cluster is to the points in its neighboring clusters. Its a way to
find out the optimum value for k during k-means clustering.
• Silhouette values lies in the range of [-1, 1]. A value of +1
indicates that the sample is far away from its neighboring
cluster and very close to the cluster its assigned.
• Similarly, value of -1 indicates that the point is close to its
neighboring cluster than to the cluster its assigned.
• A value of 0 means its at the boundary of the distance
between the two cluster. Value of +1 is idea and -1 is least
preferred. Hence, higher the value better is the cluster
configuration.
21.
Silhouette Method
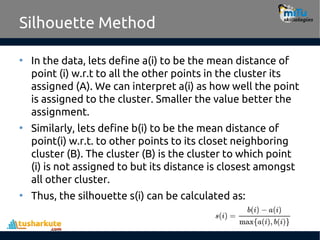
• Inthe data, lets define a(i) to be the mean distance of
point (i) w.r.t to all the other points in the cluster its
assigned (A). We can interpret a(i) as how well the point
is assigned to the cluster. Smaller the value better the
assignment.
• Similarly, lets define b(i) to be the mean distance of
point(i) w.r.t. to other points to its closet neighboring
cluster (B). The cluster (B) is the cluster to which point
(i) is not assigned to but its distance is closest amongst
all other cluster.
• Thus, the silhouette s(i) can be calculated as:
tushar@tusharkute.com
Thank you
This presentationis created using LibreOffice Impress 5.1.6.2, can be used freely as per GNU General Public License
Web Resources
http://mitu.co.in
http://tusharkute.com
/mITuSkillologies @mitu_group
contact@mitu.co.in
/company/mitu-
skillologies

![The Kmeans() function attributes
• cluster_centers_ : array, [n_clusters, n_features]
– Coordinates of cluster centers
• labels_ : :
– Labels of each point
• inertia_ : float
– Sum of squared distances of samples to their
closest cluster center.](https://image.slidesharecdn.com/27-260126221135-9030fd8c/85/27-K-means-Clustering-intermediate-level-pdf-18-320.jpg)
![Silhouette Method
• Silhouette analysis is a way to measure how close each point in
a cluster is to the points in its neighboring clusters. Its a way to
find out the optimum value for k during k-means clustering.
• Silhouette values lies in the range of [-1, 1]. A value of +1
indicates that the sample is far away from its neighboring
cluster and very close to the cluster its assigned.
• Similarly, value of -1 indicates that the point is close to its
neighboring cluster than to the cluster its assigned.
• A value of 0 means its at the boundary of the distance
between the two cluster. Value of +1 is idea and -1 is least
preferred. Hence, higher the value better is the cluster
configuration.](https://image.slidesharecdn.com/27-260126221135-9030fd8c/85/27-K-means-Clustering-intermediate-level-pdf-20-320.jpg)