El documento describe las principales modalidades de educación a distancia, incluyendo su rol del docente, rol del estudiante e implicaciones tecnológicas. Las modalidades son por correo, radio, televisión educativa, centros de autoaprendizaje y en línea. Cada modalidad se caracteriza por diferentes roles de docentes y estudiantes, así como diferentes mecanismos de evaluación y tipos de interacción.
This document outlines the development of an audio enhancement application called Audihance. It includes research on how sound works, the naming and branding of Audihance, and mockups of its social media and website presence. The application aims to adjust sound pressure waves to provide optimal listening experiences for users. Logos and web/social media pages were created to establish the Audihance brand identity.
CEiS aims to be a key partner for new successful businesses in Central and Eastern Europe (CEE) by providing integrated solutions. It identifies businesses that could succeed in CEE and supports them through management consulting, financing assistance, legal/tax advice, and outsourcing/incubator services. CEiS' leadership has extensive experience in management, private equity, and working with companies entering CEE markets. An advisory board provides strategic guidance and ensures high quality client services.
Para criar um canal de afiliados, acesse a aba Divulgação no painel administrativo, clique em Canais de Anúncio e adicione um novo canal, modificando seu nome e código. Em seguida, adicione o código do canal criado ao link de uma peça de e-mail marketing para direcionar tráfego para esse canal específico.
Este documento describe los diferentes factores que deben considerarse en el diseño de una planta, incluyendo el estudio de suelos, niveles y pisos, vías de circulación, puertas, techos, ventanas, ascensores, anclajes de maquinaria y áreas de almacenamiento. El documento proporciona detalles sobre los materiales y especificaciones requeridos para cada uno de estos factores.
6 ict tutorial create a family tree chart in power point 2007Anny Garcia
This document provides instructions for creating a family tree chart in PowerPoint 2007. It describes how to choose the correct slide layout and SmartArt graphic for a hierarchy chart, add and format shapes to represent family members, and link branches to other slides for more details. The steps also cover adding text, deleting shapes, and including a background image while maintaining focus on the family tree chart.
O documento é um plano de aula para o 5° ano do ensino fundamental sobre o tema pHema com os professores Maurício Wesendonck e Elisane de Lourdes Morsch.
The document contains performance data and analysis for an algorithm company from December 2020 to April 2024. It provides financial metrics like sales, operating profit, net income, debt ratio, and EPS on a quarterly and annual basis. It also includes the company's stock price trends, probability of price increases, and recommendations to buy, sell, or hold amounts of the company's stocks. The analysis is from The Algorithm Company Analysis Consulting, which provides investment consulting services but does not guarantee the accuracy of the data and analysis.
This document provides a performance analysis and stock trading strategy for Algorithm (consolidated) 003650 over a 3-month period. It summarizes the company's recent annual and quarterly financial performance. It then provides the stock's current and projected price ranges, an evaluation of the stock, and a suggested purchase amount. It outlines buying and selling amounts for the stock across different price ranges. Finally, it shows the stock's predicted probability of rising in price over the next 3 months according to two sectors and on average.
This document provides a summary of a company's financial performance and stock price predictions over several quarters based on an analysis by an algorithm. It shows key metrics like sales, profits, debt ratios, and stock prices historically and makes recommendations to buy, sell, or hold shares based on the current and predicted stock price ranges. The analysis also considers broader market sector performance to determine an overall stock price rise probability score.
This document provides a summary of a company's financial performance and stock analysis over several quarters from 2020-2024. It includes metrics like sales, operating profit, net income, debt ratios, and earnings per share. The document also evaluates the company's current stock price compared to different indication price ranges, and suggests purchasing stocks if the price is between the mid and high mid ranges. Compliance notices at the end explain that the analysis is for reference only and the user bears full responsibility for investment decisions.
This document provides a summary of a company's financial performance and stock analysis over time. It includes tables with metrics like sales, operating profit, net income, debt ratios, and earnings per share from 2020-2024. Charts show the company's stock price probability score compared to industry averages and estimated purchase amounts for different stock price ranges. The analysis concludes the stock is currently undervalued and a purchase is recommended. Disclaimers note the analysis is for reference only and users are responsible for their own investment decisions based on this information.
This document provides a performance analysis of an algorithm company over several time periods. It includes key financial metrics such as sales, operating profit, net income, operating rate, net rate, return on equity, debt ratio, and quick ratio from 2020 to 2024. It also shows the company's stock price, earnings per share, book value per share, and dividends. The document analyzes the company's stock price rise probability score and increase rate for different sectors over time. It provides an investment opinion and suggested purchase amount for the company's stock.
This document provides a performance analysis of an algorithm (consolidated) over several time periods. It includes key financial metrics such as sales, operating profit, net income, operating rate, net rate, and debt ratio from 2020-2024. It also estimates stock prices at different indication price ranges and provides the gap between the current stock price and each range. Finally, it evaluates the stock price rise probability score over several periods and sectors to inform investment decisions.
This document provides a performance analysis of an algorithm (consolidated) company over several time periods. It includes financial metrics like sales, operating profit, net income, debt ratio, and earnings per share for recent quarters and annual periods. It also estimates the company's indication price range and stock price, along with investment opinions and strategies based on the algorithm's analysis of the company's performance and prospects. Disclaimers are provided that the analysis is for reference only and accuracy is not guaranteed, while compliance with laws regarding investment decisions and use of the information is required.
This document provides a summary of key financial metrics and analysis of an algorithm company over several quarters and years. It includes metrics like sales, operating profit, net income, debt ratios, and stock price indicators. Charts show the company's indication price compared to its current stock price and predictions for price changes. The analysis rates the company's stock price rise probability and provides strategies around purchasing amounts based on the indication price ranges.
1. 알기컨 >
tacac.co.kr
코디엠
(별도) 발행일자
활용기간 3개월 (단위 : 억원)
2013.12 2014.12 2015.12 평균 2015.12 2016.03 2016.06 2016.09 2016.12 2017.03
IFRS(개별) IFRS(개별) IFRS(개별) IFRS(개별) IFRS(개별) IFRS(개별) IFRS(개별) IFRS(개별) IFRS(개별) IFRS(개별) IFRS(개별)
매출액 255 381 467 368 106 18 67 113 224 387 76
영업이익 -5 19 20 11 -1 -9 -7 -13 -50 -195 -8
당기순이익 -10 19 15 8 -3 -8 -6 -12 -22 -39 -7
영업이익률 -2.0 5.0 4.3 2.4 -0.9 -50.0 -10.4 -11.5 -22.4 -50.3 -24.3
순이익률 -3.9 5.0 3.2 1.4 -2.8 -44.4 -9.0 -10.6 -9.6 -10.0 -14.4
ROE -37.0 40.4 12.2 5.2 -2.4 -6.6 -5.2 -11.7 -22.4 -43.1 -15.2
부채비율 648.1 459.6 63.4 390.4 63.4 127.9 171.3 208.7 326.8 511.7 235.0
당좌비율 57.9 65.6 152.8 92.1 152.8 254.7 161.5 106.7 80.4 62.7 136.5
유보율 125.0 291.7 547.4 321.3 547.4 547.4 505.3 442.1 426.8 417.3 481.0
EPS -15 28 22 12 -4 -12 -9 -18 -32 -57 -11
BPS 40 70 182 97 182 181 170 153 142 133 171
보통주주당
배당금
0 0 0 0
최근 분기 실적 예상 분기 실적최근 연간 실적
평균
알고리즘 기업실적 분석 2017-02-15
주요재무
정보
210원
314원
418원
522원
626원
고평가 1,680원
-88%
-81%
-75%
-69%
-63%
-100%
-90%
-80%
-70%
-60%
-50%
-40%
-30%
-20%
-10%
0.%
0원
200원
400원
600원
800원
1,000원
1,200원
1,400원
1,600원
1,800원
안전가격 안전보통 보통 고평가보통 고평가
지침가격 차트 (별도)
지침가격
코디엠
격차
격차
(지침가격/
현재주가)
배색
고평가 ~ -63 %
고평가보통 ~ -69 %
보통 ~ -75 %
안전보통 ~ -81 %
안전가격 ~ -88 %
지침가격
626 원
522 원
범위
626 원 이상
522 원
522 원
기업 평가 점수
39.5평가
210 원 210 원 0 원
418 원
314 원
418 원
314 원
고평가
현재주가
1,680 원
314 원
210 원
418 원
매도반도체와반도체장비 80 개 2 위 2,616 개 790 위
의뢰기업의 업종명 전체 업종수
알고리즘
업종순위
전체 상장 기업수
알고리즘
기업순위
투자의견
2. [예정 매입 금액] 임의 작성
알기컨 >
tacac.co.kr
공지사항
-5% -13% -2% 15% -0%-1%
38%
-3% 14%
-46%
-4% 13%
-297%
78%
-19%
-400%
-300%
-200%
-100%
0%
100%
2016.10.20 2016.11.17 2016.12.15 2017.01.13 2017.02.14
주가 상승 확률 증가율
A 섹터
B 섹터
최종평균
56점 54점
48점 47점
55점 55점
30점 30점
48점 47점
54점
37점
43점 42점
48점
12점
55점
46점
0점
10점
20점
30점
40점
50점
60점
2016.09.21 2016.10.20 2016.11.17 2016.12.15 2017.01.13 2017.02.14
주가 상승 확률 점수
A 섹터
B 섹터
최종평균
코디엠
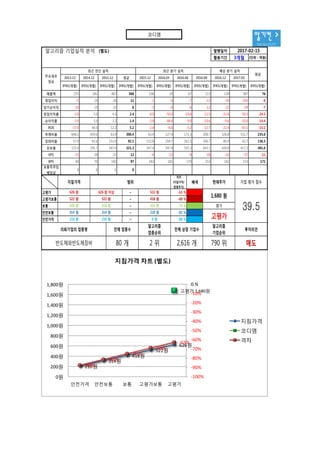
알고리즘 주식매매 전략서 (별도) 발행일자
활용기간
격차
(지침가격/
현재주가)
배색
78,602 원 375 주안전가격 210 원 210 원 ~ 0 원 -88 %
안전보통 314 원 314 원 ~ 210 원 -81 % 73,037 원 233 주
보통 418 원 418 원 ~ 314 원 -75 % 67,472 원 161 주
522 원 -63 % 56,342 원 90 주
고평가보통 522 원 522 원 ~ 418 원 -69 % 61,907 원 119 주
1,680 원 고평가
현재주가 평가 주가 상승 확률 점수 투자의견 예정 매입 금액
29.1 매도 500,000 원
추천 매입 금액 89,820 원 추천 매입 주식수 53 주
지침가격 범위 매수 / 매도 매수 / 매도 주식수
고평가 626 원 626 원 이상 ~
2017-02-15
3개월
주가 상승 확률 점수
A 섹터 56.3 점 53.7 점 47.6 점 46.8 점 55.2 점
B 섹터 30.4 점 30.0 점 46.8 점 46.8 점 54.2 점 37.1 점
2016.09.21 2016.10.20 2016.11.17 2016.12.15 2017.01.13 2017.02.14
54.9 점
29.1
최종 평균 43.3 점 41.8 점 48.0 점 12.1 점 54.7 점 46.0 점
최종 증가율2017.02.142017.01.132016.12.152016.11.172016.10.20
-1 %B 섹터
46.7-46 %
-0 %15 %-2 %-13 %-5 %A 섹터
최종 평균 -4 % 13 % -297 % 78 % -19 %
38 % -3 % 14 % -46 %
최종 점수
3. 알기컨 >
tacac.co.kr
정보와
완전
정보
결
투자판단
있습니
위배
무단으
숙지하
공지사항 (compliance notice)
① 알고리즘 기업분석 컨설팅에서 제공하는 정보는 신뢰할 만한 자료 및 정보와
알고리즘 기업분석 프로그램(TACAP)을 통해 얻어진 것이나 그 정확성이나 완전
성을 보장 할 수 없으며, 시간이 경과함에 따라 변경될 수 있습니다. 따라서 정보
의 오류,누락에 대하여 알고리즘 기업분석 컨설팅에서 제공하는 자료의 대한 결
과에 대해 법적인 책임을 지지 않습니다.
② 알고리즘 기업분석 컨설팅 및 본 사이트에서 제공하는 모든 정보는 투자판단
의 참고자료이며, 투자의 최종 책임은 본 정보를 이용하시는 이용자에게 있습니
다.
③ 알고리즘 기업분석 컨설팅 및 본 사이트에서는 일임매매 등 관련법규에 위배
되는 행위는 일체 하지 않습니다.
④ 이용자는 알고리즘 기업분석 컨설팅 및 본 사이트에서 제공한 정보를 무단으
로 재배포 및 재활용 할 수 없습니다.
⑤ 알고리즘 기업분석 보고서의 정확성을 높이기 위해 활용기간을 필히 숙지하
시길 바랍니다.
Tel : 070 - 4667 - 5009 Email : tacac@tacac.co.kr
Homepage : tacac.co.kr Blog : tacac.blog.me
기업분석신청 : http://tacac.co.kr/?page_id=1374