Newtec provides satellite transmission equipment and traffic shaping solutions. They tested their Tellishape traffic shaper using a virtual test environment that simulated satellite transmission delays. The virtual wall environment allowed them to efficiently test Tellishape by gradually increasing the number of machines used to simulate more users over time. It provided a flexible and scalable solution compared to building their own physical test infrastructure.
The study found that patients who aimed for a systolic blood pressure below 120, lower than current guidelines, reduced their risk of heart attacks, heart failure, strokes, and death by up to a third. Nearly 79 million US adults have high blood pressure, but half of those being treated still have readings over 140; this study suggests blood pressure needs to be more aggressively lowered. Experts anticipate this will significantly change treatment guidelines and further reduce death rates from heart disease.
La Infanta Margarita asistió a varios eventos oficiales y celebraciones, incluyendo la entrega de una pluma de oro a una revista, ser madrina de la botadura de un buque, asistir a misas y conciertos, visitar exposiciones, bodegas, fábricas y jardines botánicos, y presenciar la boda del Príncipe Carlos.
Este documento describe la diferencia entre nativos digitales e inmigrantes digitales. Los nativos digitales son la primera generación que creció con la tecnología digital y son expertos en computadoras, videos juegos e internet. Prefieren imágenes a textos, la multitarea y el acceso aleatorio de la información. Los inmigrantes digitales nacieron antes de los años 90 y están menos familiarizados con la tecnología. Funcionan de forma más estructurada y resuelven problemas de uno en uno. Aunque los inmigrantes se están adaptando lentamente a
agir yuk kullanimina uygun sivi kimyasal toplama damlama sizma tavasi imalati...Karma Metall
Sıvı toplama küveti,Kimyasal toplama paleti,Varil toplama paleti,Varil stoklama küveti,Varil stoklama paleti,Yağ toplama tavası,Yağ toplama kabı,Varil taşma teknesi,Paslanmaz çelik kimyasal toplama küveti,Döküntü yağ toplama küveti,Akaryakıt tankı taşma havuzu,Kimyasal taşma havuzu,Kimyasal tank taşma havuzu,Yağ toplama küveti,Mekanik atık yağ toplama kabı,Yağ boşatma tankı,Yağ boşaltım tavası,Yağ toplama makinası,Yağ boşaltma tanklarıVaril taşıma ve stoklama istasyonları,Varil paleti,Varil stoklama paleti,Varil taşıma paleti,Varil istifleme paleti,Varil paletleri,Varil depolama paleti,Varil taşıma aparatı,Varil kaldırma aparatı, ibc tankı toplama paleti,Ibc tankı stoklama küveti,Yağ toplama küvetiKimyasal akıntı toplama küveti,Kimyasal döküntü toplama küveti,Varil taşıma paleti,Galvaniz çelik varil paleti,Varil paletleri,Asit toplama tavası,Varil çelik paleti,Yağ atık tankı paleti,Kimyasal taşıma kapları,Asit paleti,Asit tavası,Varil toplama küveti,Taşma kabı,Taşma küveti,Taşma paleti,Damlama paleti,Varil taşıma paleti,Varil iş güvenliği paleti,Döküntü toplama paletleri,Döküntü toplama paleti,Kimyasal küvet,Kimyasal toplama küveti,Taşma havuzu,Varil
The document contains performance data and analysis for an algorithm company from December 2020 to April 2024. It provides financial metrics like sales, operating profit, net income, debt ratio, and EPS on a quarterly and annual basis. It also includes the company's stock price trends, probability of price increases, and recommendations to buy, sell, or hold amounts of the company's stocks. The analysis is from The Algorithm Company Analysis Consulting, which provides investment consulting services but does not guarantee the accuracy of the data and analysis.
This document provides a performance analysis and stock trading strategy for Algorithm (consolidated) 003650 over a 3-month period. It summarizes the company's recent annual and quarterly financial performance. It then provides the stock's current and projected price ranges, an evaluation of the stock, and a suggested purchase amount. It outlines buying and selling amounts for the stock across different price ranges. Finally, it shows the stock's predicted probability of rising in price over the next 3 months according to two sectors and on average.
This document provides a summary of a company's financial performance and stock price predictions over several quarters based on an analysis by an algorithm. It shows key metrics like sales, profits, debt ratios, and stock prices historically and makes recommendations to buy, sell, or hold shares based on the current and predicted stock price ranges. The analysis also considers broader market sector performance to determine an overall stock price rise probability score.
This document provides a summary of a company's financial performance and stock analysis over several quarters from 2020-2024. It includes metrics like sales, operating profit, net income, debt ratios, and earnings per share. The document also evaluates the company's current stock price compared to different indication price ranges, and suggests purchasing stocks if the price is between the mid and high mid ranges. Compliance notices at the end explain that the analysis is for reference only and the user bears full responsibility for investment decisions.
This document provides a summary of a company's financial performance and stock analysis over time. It includes tables with metrics like sales, operating profit, net income, debt ratios, and earnings per share from 2020-2024. Charts show the company's stock price probability score compared to industry averages and estimated purchase amounts for different stock price ranges. The analysis concludes the stock is currently undervalued and a purchase is recommended. Disclaimers note the analysis is for reference only and users are responsible for their own investment decisions based on this information.
This document provides a performance analysis of an algorithm company over several time periods. It includes key financial metrics such as sales, operating profit, net income, operating rate, net rate, return on equity, debt ratio, and quick ratio from 2020 to 2024. It also shows the company's stock price, earnings per share, book value per share, and dividends. The document analyzes the company's stock price rise probability score and increase rate for different sectors over time. It provides an investment opinion and suggested purchase amount for the company's stock.
This document provides a performance analysis of an algorithm (consolidated) over several time periods. It includes key financial metrics such as sales, operating profit, net income, operating rate, net rate, and debt ratio from 2020-2024. It also estimates stock prices at different indication price ranges and provides the gap between the current stock price and each range. Finally, it evaluates the stock price rise probability score over several periods and sectors to inform investment decisions.
This document provides a performance analysis of an algorithm (consolidated) company over several time periods. It includes financial metrics like sales, operating profit, net income, debt ratio, and earnings per share for recent quarters and annual periods. It also estimates the company's indication price range and stock price, along with investment opinions and strategies based on the algorithm's analysis of the company's performance and prospects. Disclaimers are provided that the analysis is for reference only and accuracy is not guaranteed, while compliance with laws regarding investment decisions and use of the information is required.
This document provides a summary of key financial metrics and analysis of an algorithm company over several quarters and years. It includes metrics like sales, operating profit, net income, debt ratios, and stock price indicators. Charts show the company's indication price compared to its current stock price and predictions for price changes. The analysis rates the company's stock price rise probability and provides strategies around purchasing amounts based on the indication price ranges.
This document provides financial and performance data for the Algorithm company over several periods from 2020 to 2024. It includes quarterly sales, operating profit, net income, operating rate, net rate, return on equity, debt ratio, quick ratio, and reserve ratio. It also lists earnings per share, book value per share, and dividends over time. The document then provides the company's stock price trends, probability of price increases for different sectors, suggested purchase amounts, and compliance notices about the analysis.
1. 알기컨 >
tacac.co.kr
신화실업
(별도) 발행일자
활용기간 3개월 (단위 : 억원)
2013.12 2014.12 2015.12 평균 2015.09 2015.12 2016.03 2016.06 2016.09 2016.12
IFRS(개별) IFRS(개별) IFRS(개별) IFRS(개별) IFRS(개별) IFRS(개별) IFRS(개별) IFRS(개별) IFRS(개별) IFRS(개별) IFRS(개별)
매출액 771 620 572 654 158 111 160 190 211 234 155
영업이익 -8 15 26 11 7 4 -13 -8 -19 -47 -3
당기순이익 -20 5 19 1 7 1 -12 -4 -22 -117 -2
영업이익률 -1.0 2.4 4.5 2.0 4.4 3.6 -8.1 -4.2 -9.2 -20.2 -5.6
순이익률 -2.6 0.8 3.3 0.5 4.4 0.9 -7.5 -2.1 -10.2 -49.7 -10.7
ROE -5.3 1.3 4.8 0.3 1.8 0.3 -3.2 -1.1 -5.9 -32.4 -6.7
부채비율 115.9 96.6 76.6 96.4 89.1 76.6 85.4 84.7 83.6 82.6 83.7
당좌비율 87.1 88.3 103.4 92.9 104.7 103.4 106.3 118.2 127.7 140.7 116.8
유보율 518.0 519.7 545.9 527.9 547.5 545.9 519.7 511.5 500.1 489.0 519.0
EPS -1,646 412 1,564 110 576 82 -988 -329 -1,777 -9,590 -165
BPS 31,032 31,114 32,431 31,526 32,431 32,431 31,114 30,703 30,152 29,611 31,670
보통주주당
배당금
150 200 350 233
주요재무
정보
알고리즘 기업실적 분석 2016-10-04
최근 분기 실적 예상 분기 실적최근 연간 실적
평균
19,792원
21,432원
23,072원
24,711원
26,351원
고평가 40,350원
-51%
-47%
-43%
-39%
-35%
-60%
-50%
-40%
-30%
-20%
-10%
0.%
0원
5,000원
10,000원
15,000원
20,000원
25,000원
30,000원
35,000원
40,000원
45,000원
안전가격 안전보통 보통 고평가보통 고평가
지침가격 차트 (별도)
지침가격
신화실업
격차
격차
(지침가격/
현재주가)
배색
고평가 ~ -35 %
고평가보통 ~ -39 %
보통 ~ -43 %
안전보통 ~ -47 %
안전가격 ~ -51 %
매도철강 80 개 63 위 2,522 개 1,027 위
의뢰기업의 업종명 전체 업종수
알고리즘
업종순위
전체 상장 기업수
알고리즘
기업순위
투자의견
기업 평가 점수
39.8평가
19,792 원 19,792 원 0 원
23,072 원
21,432 원
23,072 원
21,432 원
고평가
현재주가
40,350 원
21,432 원
19,792 원
23,072 원
지침가격
26,351 원
24,711 원
범위
26,351 원 이상
24,711 원
24,711 원
2. [예정 매입 금액] 임의 작성
알기컨 >
tacac.co.kr
공지사항
-17%
10%
4% -0%
16%
46%
-1%
14%
-2%
-45%
15%
5%
-31%
30%
-6%
-60%
-40%
-20%
0%
20%
40%
60%
2016.06.03 2016.07.04 2016.08.01 2016.08.30 2016.09.30
주가 상승 확률 증가율
A 섹터
B 섹터
최종평균
43점
36점
41점 42점 42점
51점
20점
37점 37점
42점 42점
29점31점
37점 39점
30점
42점 40점
0점
10점
20점
30점
40점
50점
60점
2016.05.04 2016.06.03 2016.07.04 2016.08.01 2016.08.30 2016.09.30
주가 상승 확률 점수
A 섹터
B 섹터
최종평균
신화실업
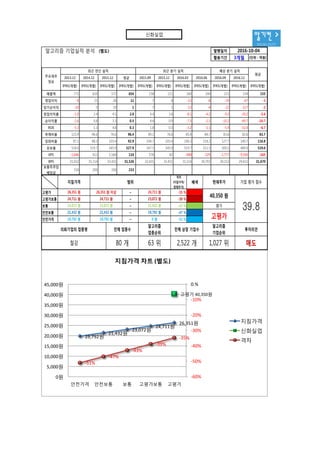
알고리즘 주식매매 전략서 (별도) 발행일자
활용기간
격차
(지침가격/
현재주가)
배색
2016-10-04
3개월
53.2 매도 500,000 원
추천 매입 금액 109,298 원 추천 매입 주식수 3 주
지침가격 범위 매수 / 매도 매수 / 매도 주식수
고평가 26,351 원 26,351 원 이상 ~
현재주가 평가 주가 상승 확률 점수 투자의견 예정 매입 금액
40,350 원 고평가
24,711 원 -35 % 37,920 원 1 주
고평가보통 24,711 원 24,711 원 ~ 23,072 원 -39 % 42,361 원 2 주
보통 23,072 원 23,072 원 ~ 21,432 원 -43 % 46,803 원 2 주
안전보통 21,432 원 21,432 원 ~ 19,792 원 -47 % 51,244 원 2 주
55,686 원 3 주안전가격 19,792 원 19,792 원 ~ 0 원 -51 %
31.3 점 36.8 점 38.7 점 29.6 점 42.0 점 39.7 점
50.7 점
53.2
최종 평균
B 섹터 20.0 점 37.1 점 42.4 점 42.4 점 41.7 점 28.8 점
2016.05.04 2016.06.03 2016.07.04 2016.08.01 2016.08.30 2016.09.30 주가 상승 확률 점수
A 섹터 42.6 점 36.5 점 40.6 점 42.4 점 42.4 점
46 %B 섹터
49.03 %
16 %-0 %4 %10 %-17 %A 섹터
최종 평균 15 % 5 % -31 % 30 % -6 %
-1 % 14 % -2 % -45 %
최종 점수최종 증가율2016.09.302016.08.302016.08.012016.07.042016.06.03
3. 알기컨 >
tacac.co.kr
정보와
완전
정보
결
투자판단
있습니
위배
무단으
숙지하
공지사항 (compliance notice)
① 알고리즘 기업분석 컨설팅에서 제공하는 정보는 신뢰할 만한 자료 및 정보와
알고리즘 기업분석 프로그램(TACAP)을 통해 얻어진 것이나 그 정확성이나 완전
성을 보장 할 수 없으며, 시간이 경과함에 따라 변경될 수 있습니다. 따라서 정보
의 오류,누락에 대하여 알고리즘 기업분석 컨설팅에서 제공하는 자료의 대한 결
과에 대해 법적인 책임을 지지 않습니다.
② 알고리즘 기업분석 컨설팅 및 본 사이트에서 제공하는 모든 정보는 투자판단
의 참고자료이며, 투자의 최종 책임은 본 정보를 이용하시는 이용자에게 있습니
다.
③ 알고리즘 기업분석 컨설팅 및 본 사이트에서는 일임매매 등 관련법규에 위배
되는 행위는 일체 하지 않습니다.
④ 이용자는 알고리즘 기업분석 컨설팅 및 본 사이트에서 제공한 정보를 무단으
로 재배포 및 재활용 할 수 없습니다.
⑤ 알고리즘 기업분석 보고서의 정확성을 높이기 위해 활용기간을 필히 숙지하
시길 바랍니다.
Tel : 070 - 4667 - 5009 Email : tacac@tacac.co.kr
Homepage : tacac.co.kr Blog : tacac.blog.me
기업분석신청 : http://tacac.co.kr/?page_id=1374