제이준코스메틱 025620-알고리즘 기업분석 보고서
•
0 likes•120 views

제이준코스메틱 025620-알고리즘 기업분석 보고서
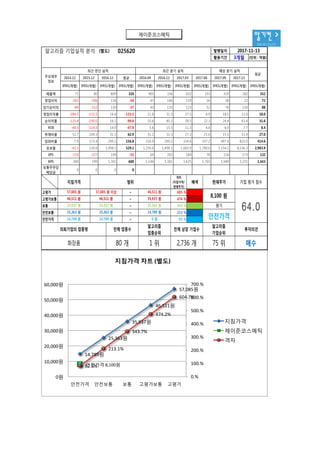
![[예정 매입 금액] 임의 작성
알기컨 >
tacac.co.kr
공지사항
-3%
8%
1% 3%
-6%
-89%
47%
3%
-21%
-29%-34%
27%
2%
-7%
-15%
-100%
-80%
-60%
-40%
-20%
0%
20%
40%
60%
2017.07.12 2017.08.09 2017.09.07 2017.10.13 2017.11.10
주가 상승 확률 증가율
A 섹터
B 섹터
최종평균
46점 45점
49점 50점 51점
48점49점
26점
48점 50점
41점
32점
48점
35점
49점 50점
46점
40점
0점
10점
20점
30점
40점
50점
60점
2017.06.14 2017.07.12 2017.08.09 2017.09.07 2017.10.13 2017.11.10
주가 상승 확률 점수
A 섹터
B 섹터
최종평균
제이준코스메틱
알고리즘 주식매매 전략서 (별도) 025620 발행일자
활용기간
격차
(지침가격/
현재주가)
배색
-4,414,401 원 -298 주안전가격 14,789 원 14,789 원 ~ 0 원 83 %
안전보통 25,363 원 25,363 원 ~ 14,789 원 213 % -11,392,051 원 전량매도
보통 35,937 원 35,937 원 ~ 25,363 원 344 % -18,369,701 원 전량매도
46,511 원 605 % -32,325,001 원 전량매도
고평가보통 46,511 원 46,511 원 ~ 35,937 원 474 % -25,347,351 원 전량매도
8,100 원 안전가격
현재주가 평가 주가 상승 확률 점수 투자의견 예정 매입 금액
44.2 매수 10,000,000 원
추천 매입 금액 5,345,195 원 추천 매입 주식수 660 주
지침가격 범위 매수 / 매도 매수 / 매도 주식수
고평가 57,085 원 57,085 원 이상 ~
2017-11-13
3개월
주가 상승 확률 점수
A 섹터 46.3 점 45.0 점 49.0 점 49.7 점 51.4 점
B 섹터 48.8 점 25.8 점 49.7 점 49.7 점 41.3 점 32.1 점
2017.06.14 2017.07.12 2017.08.09 2017.09.07 2017.10.13 2017.11.10
48.3 점
44.2
최종 평균 47.5 점 35.4 점 48.7 점 49.6 점 46.3 점 40.2 점
최종 증가율2017.11.102017.10.132017.09.072017.08.092017.07.12
-89 %B 섹터
42.3-5 %
-6 %3 %1 %8 %-3 %A 섹터
최종 평균 -34 % 27 % 2 % -7 % -15 %
47 % 3 % -21 % -29 %
최종 점수](data:image/gif;base64,R0lGODlhAQABAIAAAAAAAP///yH5BAEAAAAALAAAAAABAAEAAAIBRAA7)
More Related Content
What's hot
What's hot (20)
Similar to 제이준코스메틱 025620-알고리즘 기업분석 보고서
Similar to 제이준코스메틱 025620-알고리즘 기업분석 보고서 (19)
More from 알고리즘 기업분석 컨설팅-알기컨,algikeon
More from 알고리즘 기업분석 컨설팅-알기컨,algikeon (20)
제이준코스메틱 025620-알고리즘 기업분석 보고서
- 1. 알기컨 > tacac.co.kr 제이준코스메틱 (별도) 025620 발행일자 활용기간 3개월 (단위 : 억원) 2014.12 2015.12 2016.12 평균 2016.09 2016.12 2017.03 2017.06 2017.09 2017.12 IFRS(개별) IFRS(개별) IFRS(개별) IFRS(개별) IFRS(개별) IFRS(개별) IFRS(개별) IFRS(개별) IFRS(개별) IFRS(개별) IFRS(개별) 매출액 71 80 809 320 405 336 432 233 319 182 352 영업이익 -202 -106 134 -58 47 106 119 16 58 22 72 당기순이익 -89 -152 130 -37 43 135 123 52 78 116 88 영업이익률 -284.5 -132.5 16.6 -133.5 11.6 31.5 27.5 6.9 18.1 12.0 18.0 순이익률 -125.4 -190.0 16.1 -99.8 10.6 40.2 28.5 22.3 24.4 63.4 31.6 ROE -44.3 -114.3 14.9 -47.9 5.6 15.5 11.3 4.6 6.0 7.7 8.4 부채비율 52.7 104.5 31.5 62.9 55.2 31.5 27.3 21.0 15.5 11.4 27.0 당좌비율 7.9 172.4 290.1 156.8 216.0 290.1 324.6 337.2 497.4 822.0 414.6 유보율 -41.5 130.6 1,498.1 529.1 1,250.0 1,498.1 1,683.9 1,780.6 3,154.1 8,536.3 2,983.9 EPS -133 -227 194 -55 64 202 184 78 116 173 132 BPS 300 199 1,301 600 1,144 1,301 1,625 1,703 1,949 2,231 1,443 보통주주당 배당금 0 0 0 0 최근 분기 실적 예상 분기 실적최근 연간 실적 평균 주요재무 정보 알고리즘 기업실적 분석 2017-11-13 14,789원 25,363원 35,937원 46,511원 57,085원 안전가격 8,100원82.6% 213.1% 343.7% 474.2% 604.7% 0.% 100.% 200.% 300.% 400.% 500.% 600.% 700.% 0원 10,000원 20,000원 30,000원 40,000원 50,000원 60,000원 안전가격 안전보통 보통 고평가보통 고평가 지침가격 차트 (별도) 지침가격 제이준코스메틱 격차 격차 (지침가격/ 현재주가) 배색 고평가 ~ 605 % 고평가보통 ~ 474 % 보통 ~ 344 % 안전보통 ~ 213 % 안전가격 ~ 83 % 35,937 원 지침가격 57,085 원 46,511 원 범위 57,085 원 이상 46,511 원 46,511 원 현재주가 8,100 원 14,789 원 0 원 35,937 원 25,363 원 35,937 원 25,363 원 안전가격 25,363 원 14,789 원 평가 매수화장품 80 개 1 위 2,736 개 75 위 의뢰기업의 업종명 전체 업종수 알고리즘 업종순위 전체 상장 기업수 알고리즘 기업순위 투자의견 기업 평가 점수 64.0 14,789 원
- 2. [예정 매입 금액] 임의 작성 알기컨 > tacac.co.kr 공지사항 -3% 8% 1% 3% -6% -89% 47% 3% -21% -29%-34% 27% 2% -7% -15% -100% -80% -60% -40% -20% 0% 20% 40% 60% 2017.07.12 2017.08.09 2017.09.07 2017.10.13 2017.11.10 주가 상승 확률 증가율 A 섹터 B 섹터 최종평균 46점 45점 49점 50점 51점 48점49점 26점 48점 50점 41점 32점 48점 35점 49점 50점 46점 40점 0점 10점 20점 30점 40점 50점 60점 2017.06.14 2017.07.12 2017.08.09 2017.09.07 2017.10.13 2017.11.10 주가 상승 확률 점수 A 섹터 B 섹터 최종평균 제이준코스메틱 알고리즘 주식매매 전략서 (별도) 025620 발행일자 활용기간 격차 (지침가격/ 현재주가) 배색 -4,414,401 원 -298 주안전가격 14,789 원 14,789 원 ~ 0 원 83 % 안전보통 25,363 원 25,363 원 ~ 14,789 원 213 % -11,392,051 원 전량매도 보통 35,937 원 35,937 원 ~ 25,363 원 344 % -18,369,701 원 전량매도 46,511 원 605 % -32,325,001 원 전량매도 고평가보통 46,511 원 46,511 원 ~ 35,937 원 474 % -25,347,351 원 전량매도 8,100 원 안전가격 현재주가 평가 주가 상승 확률 점수 투자의견 예정 매입 금액 44.2 매수 10,000,000 원 추천 매입 금액 5,345,195 원 추천 매입 주식수 660 주 지침가격 범위 매수 / 매도 매수 / 매도 주식수 고평가 57,085 원 57,085 원 이상 ~ 2017-11-13 3개월 주가 상승 확률 점수 A 섹터 46.3 점 45.0 점 49.0 점 49.7 점 51.4 점 B 섹터 48.8 점 25.8 점 49.7 점 49.7 점 41.3 점 32.1 점 2017.06.14 2017.07.12 2017.08.09 2017.09.07 2017.10.13 2017.11.10 48.3 점 44.2 최종 평균 47.5 점 35.4 점 48.7 점 49.6 점 46.3 점 40.2 점 최종 증가율2017.11.102017.10.132017.09.072017.08.092017.07.12 -89 %B 섹터 42.3-5 % -6 %3 %1 %8 %-3 %A 섹터 최종 평균 -34 % 27 % 2 % -7 % -15 % 47 % 3 % -21 % -29 % 최종 점수
- 3. 알기컨 > tacac.co.kr 정보와 완전 정보 결 투자판단 있습니 위배 무단으 숙지하 공지사항 (compliance notice) ① 알고리즘 기업분석 컨설팅에서 제공하는 정보는 신뢰할 만한 자료 및 정보와 알고리즘 기업분석 프로그램(TACAP)을 통해 얻어진 것이나 그 정확성이나 완전 성을 보장 할 수 없으며, 시간이 경과함에 따라 변경될 수 있습니다. 따라서 정보 의 오류,누락에 대하여 알고리즘 기업분석 컨설팅에서 제공하는 자료의 대한 결 과에 대해 법적인 책임을 지지 않습니다. ② 알고리즘 기업분석 컨설팅 및 본 사이트에서 제공하는 모든 정보는 투자판단 의 참고자료이며, 투자의 최종 책임은 본 정보를 이용하시는 이용자에게 있습니 다. ③ 알고리즘 기업분석 컨설팅 및 본 사이트에서는 일임매매 등 관련법규에 위배 되는 행위는 일체 하지 않습니다. ④ 이용자는 알고리즘 기업분석 컨설팅 및 본 사이트에서 제공한 정보를 무단으 로 재배포 및 재활용 할 수 없습니다. ⑤ 알고리즘 기업분석 보고서의 정확성을 높이기 위해 활용기간을 필히 숙지하 시길 바랍니다. ① Consulting The Algori accuracy o change ove results of Consulting ② informatio investmen up ③ do anythin transaction ④ The Algori informatio ⑤ analysis re Tel : 070 - 4667 - 5009 Email : tacac@tacac.co.kr Homepage : tacac.co.kr Blog : tacac.blog.me SERVICES M&A,IPO,구조조정,기술경영,경영전략,가족기업 컨설팅신청 : http://tacac.co.kr/?page_id=1374