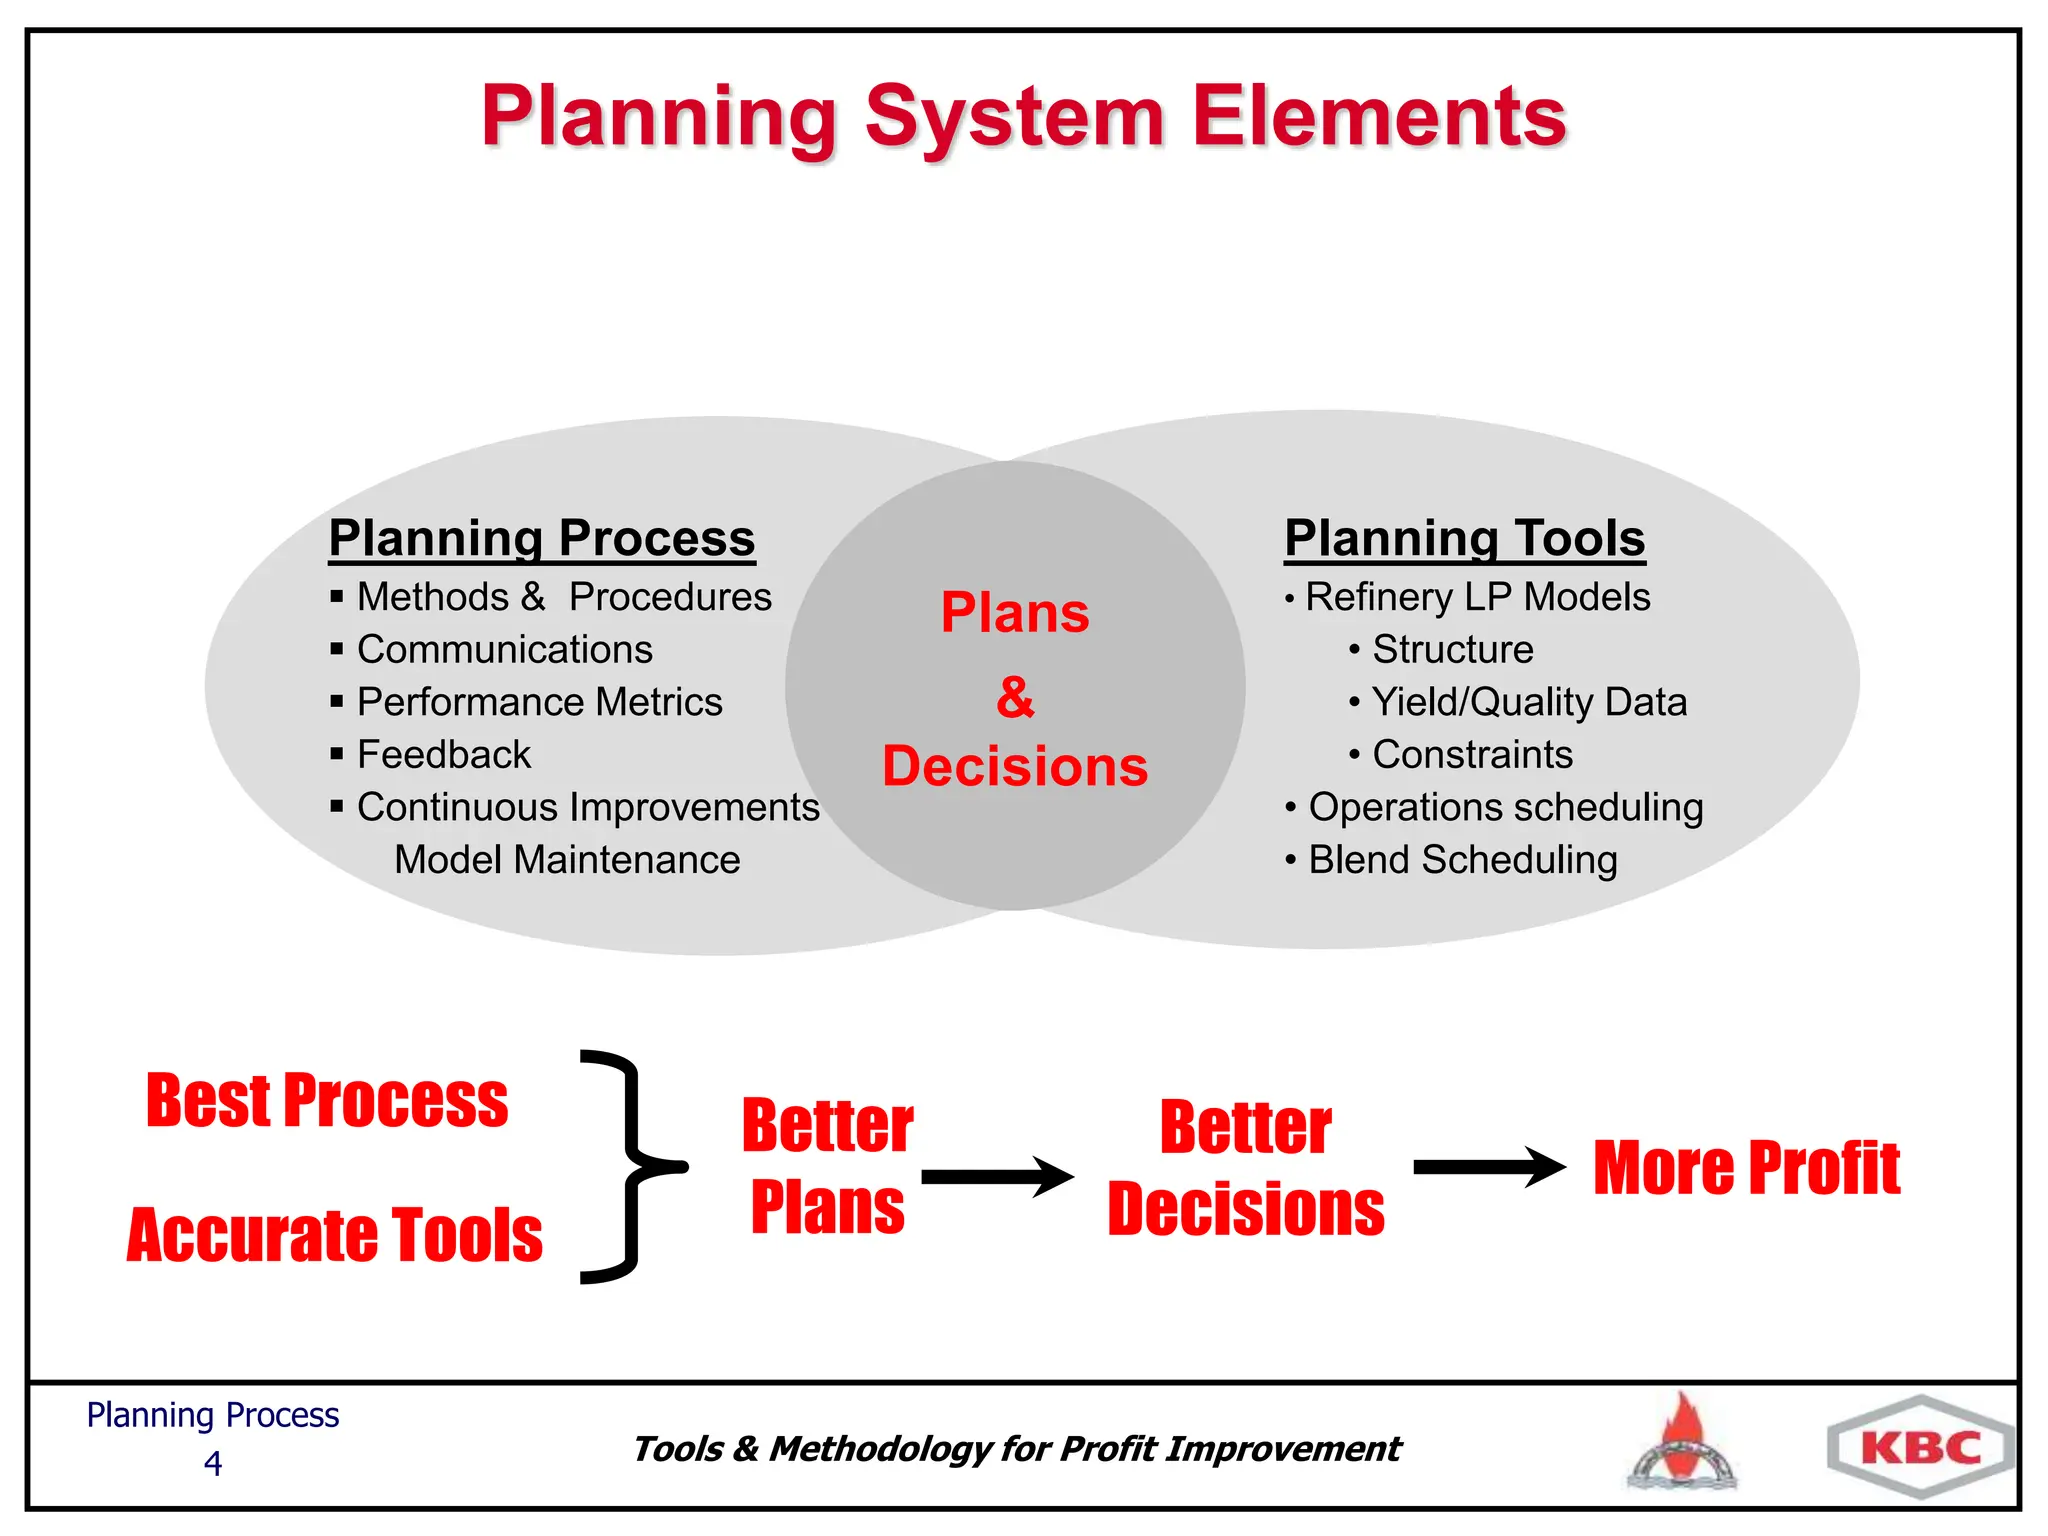
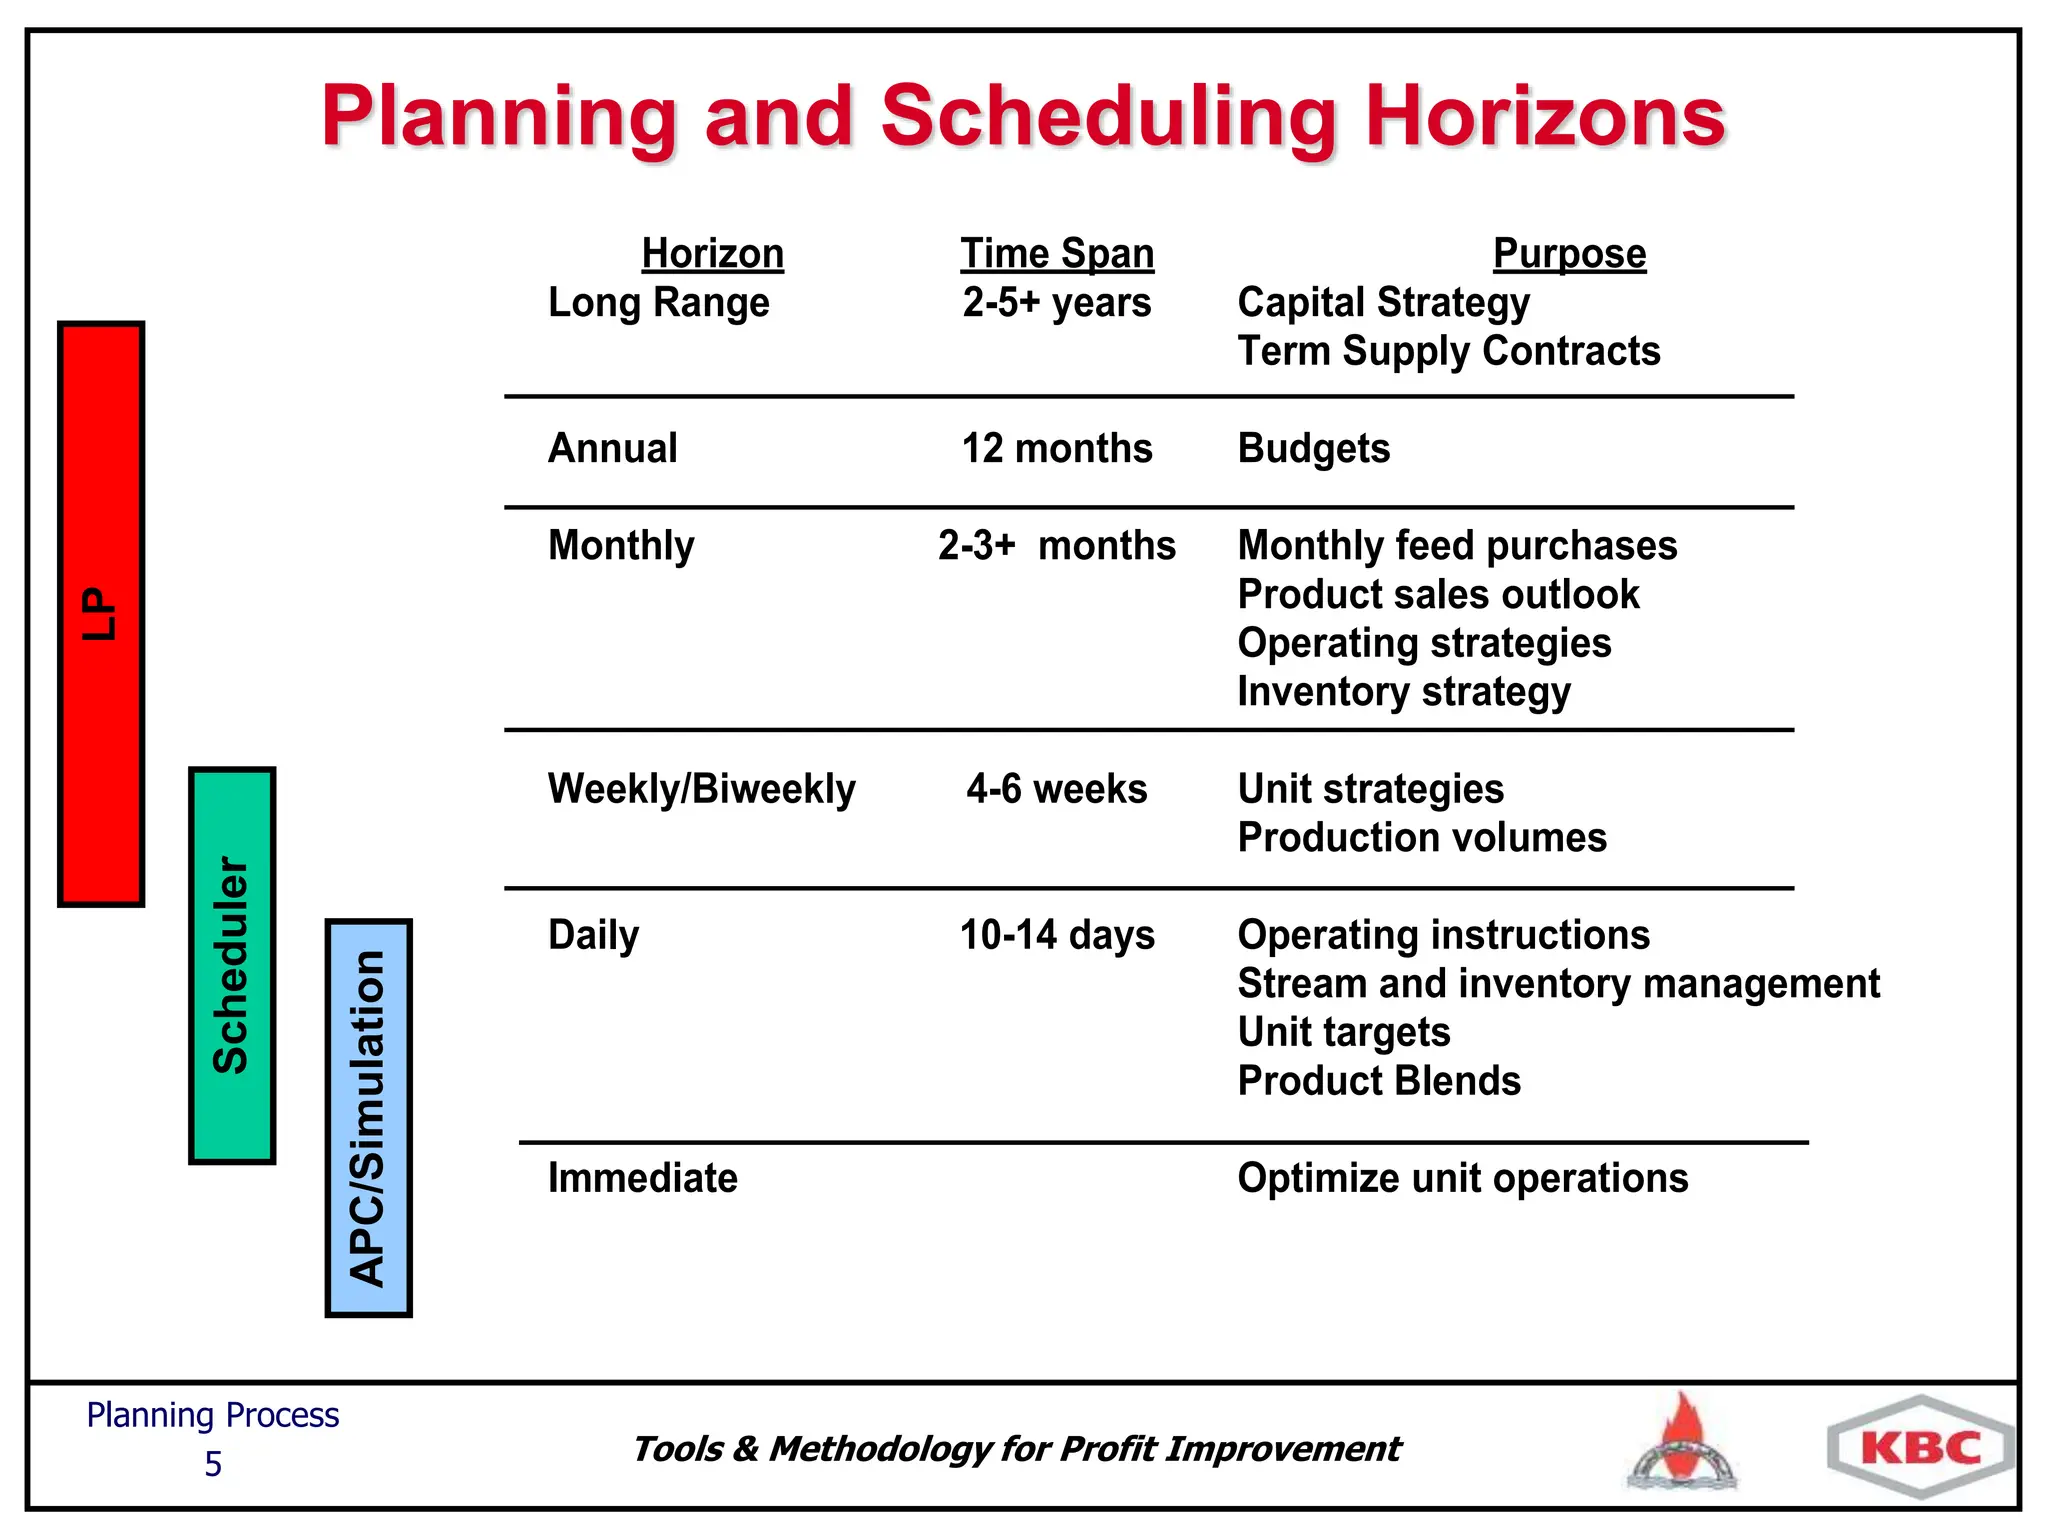
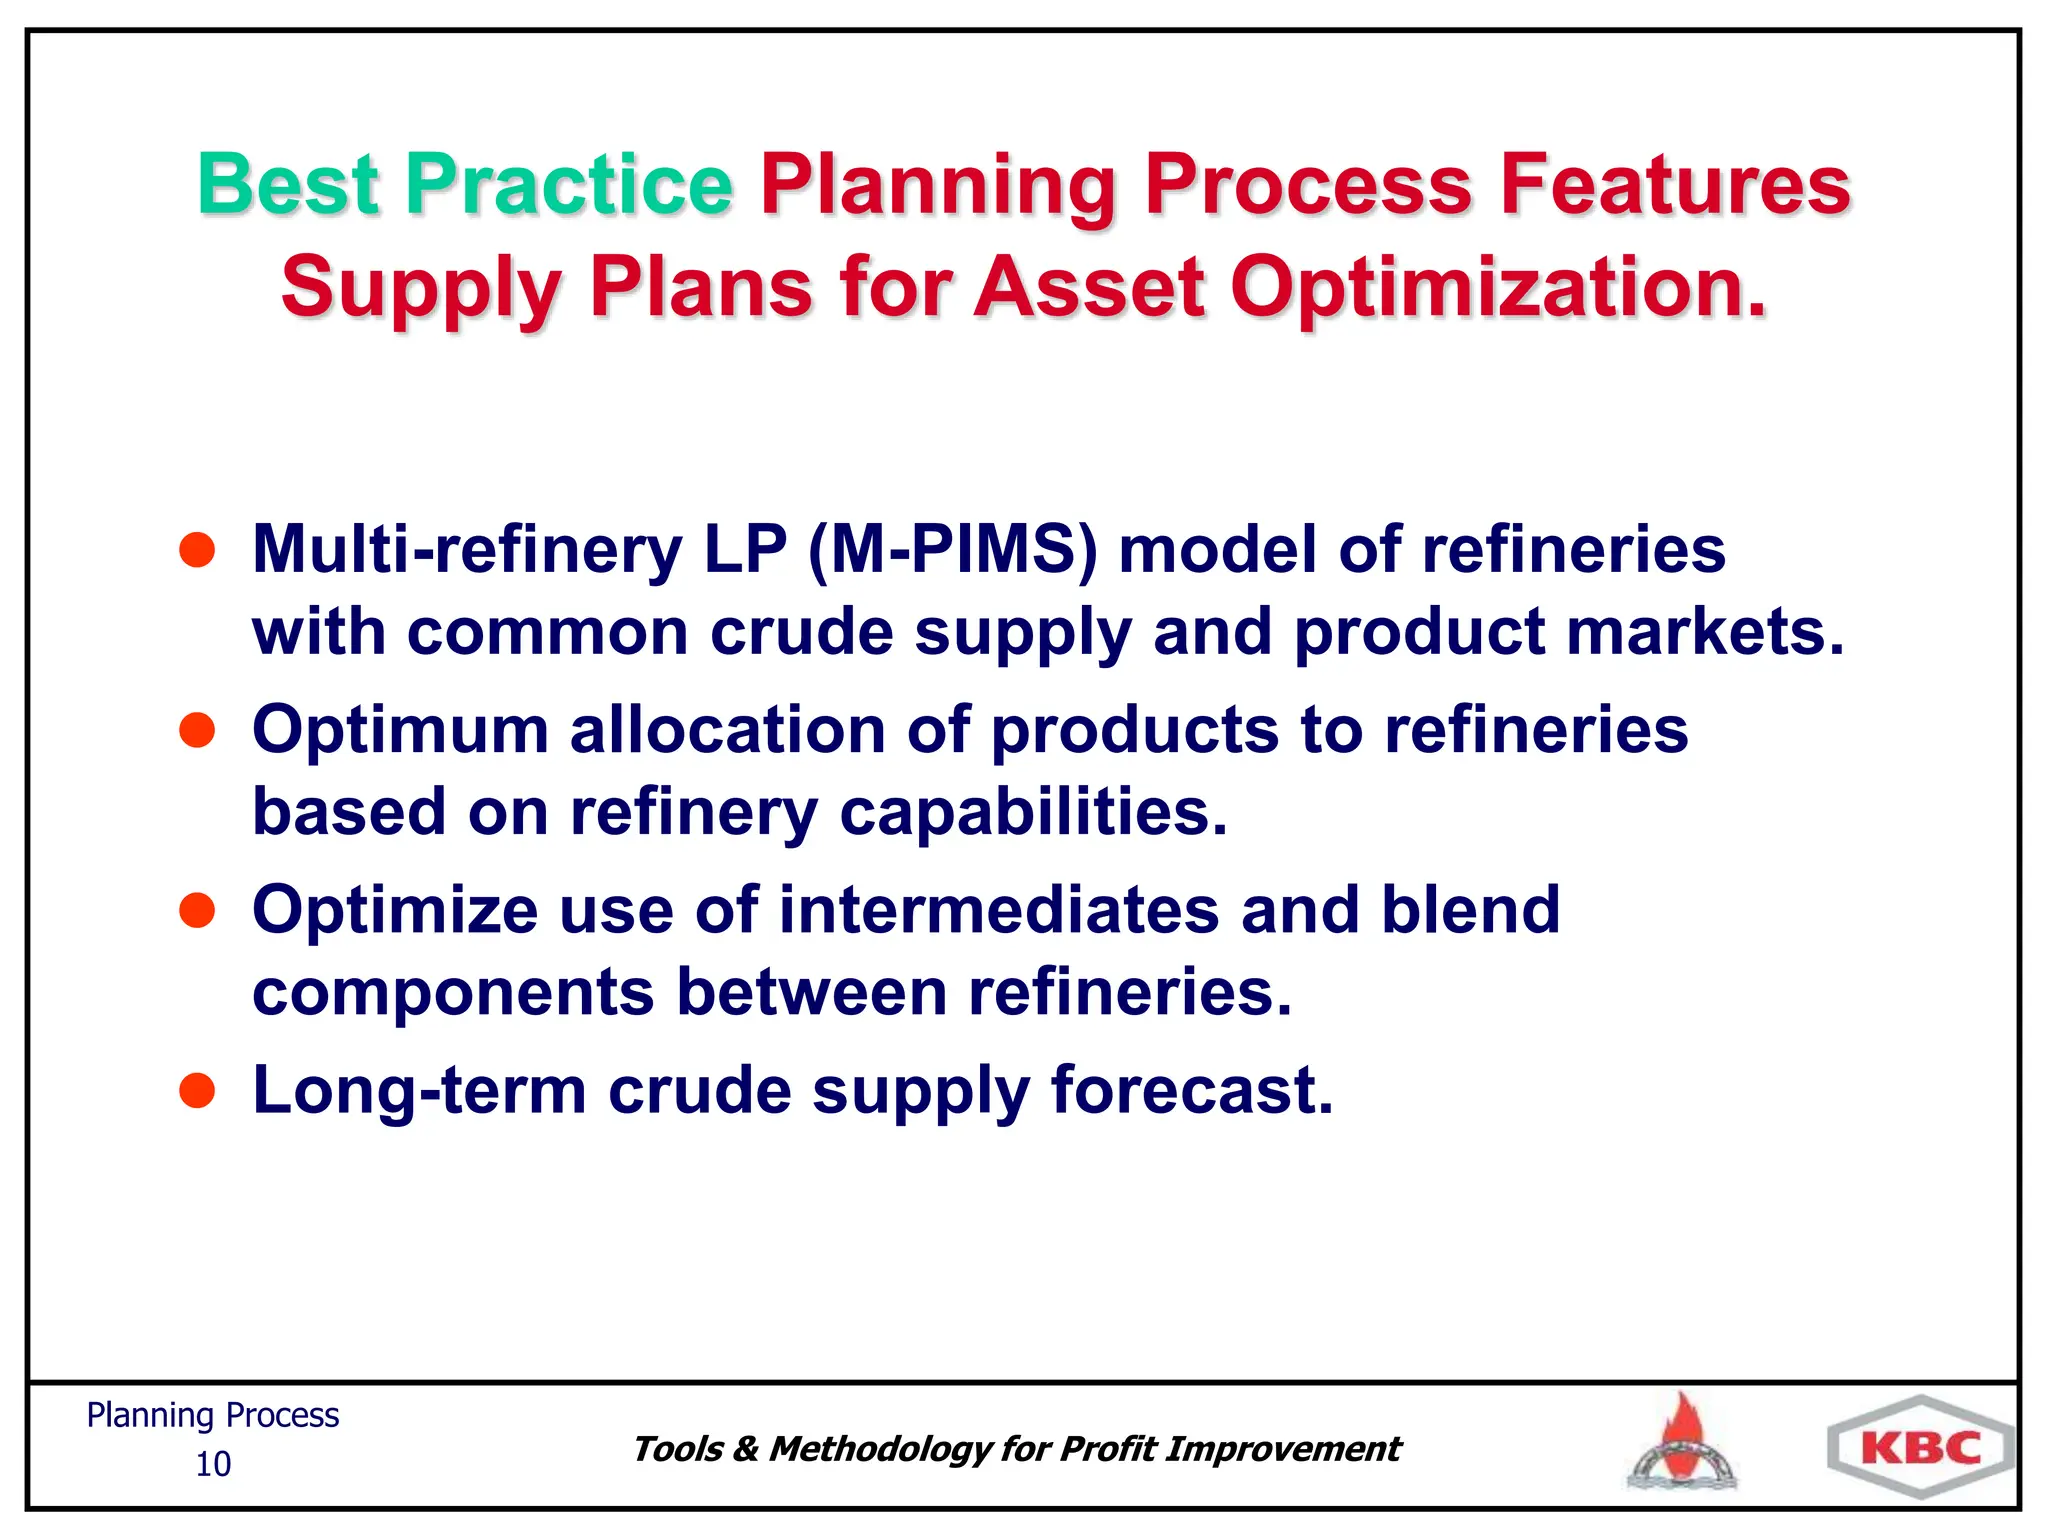
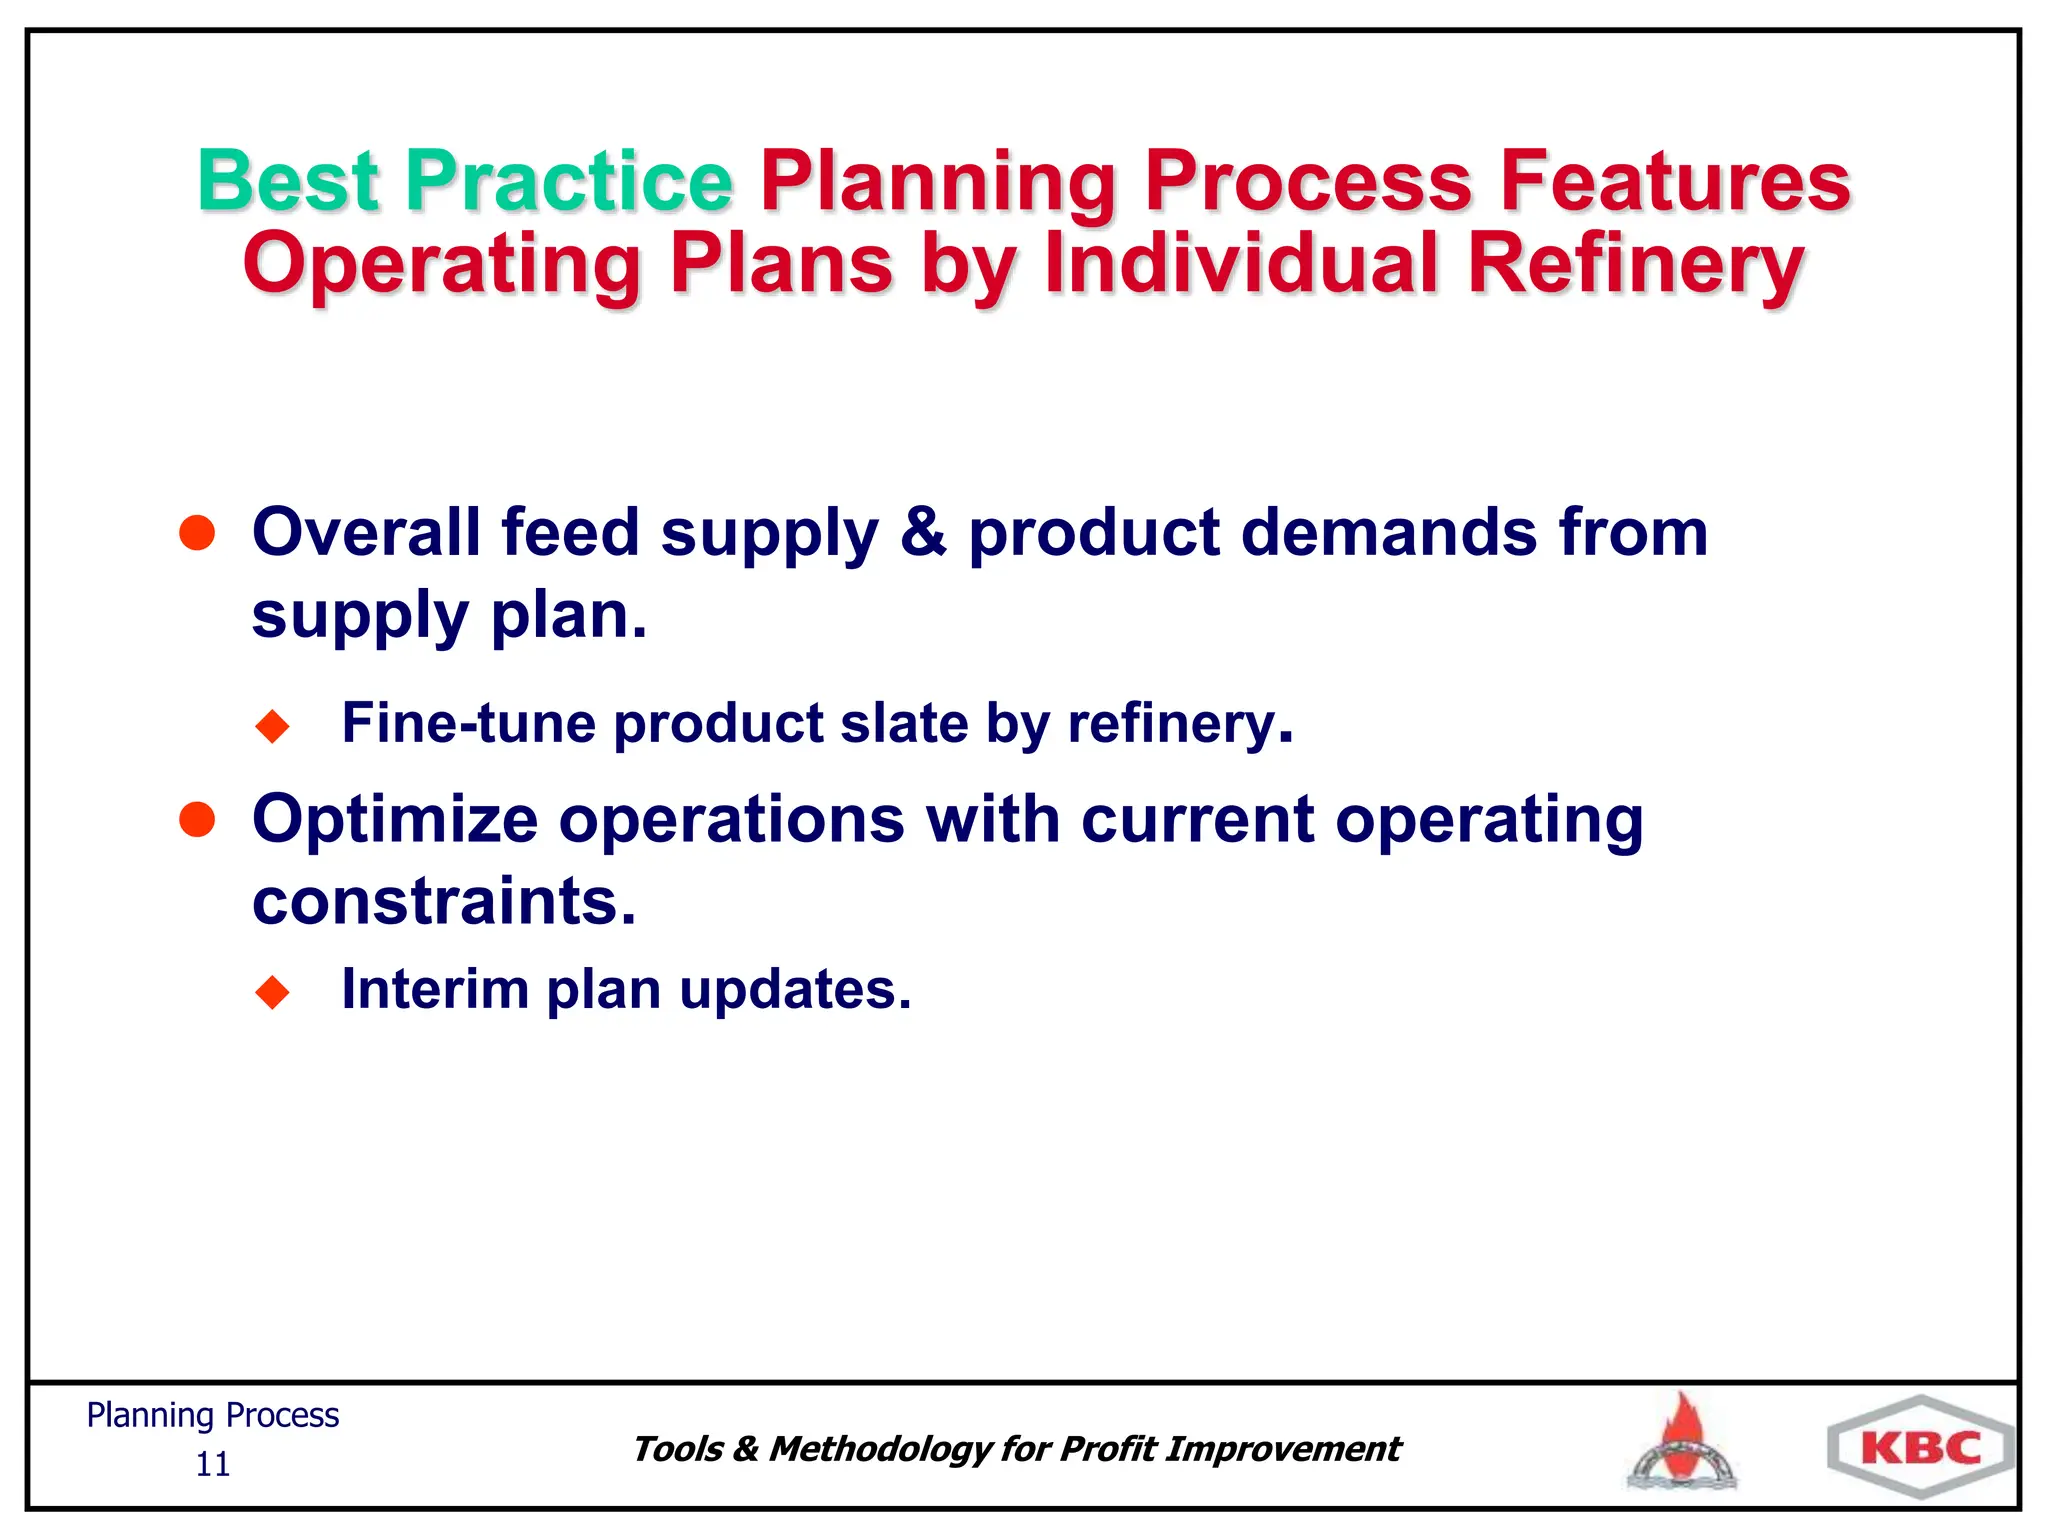
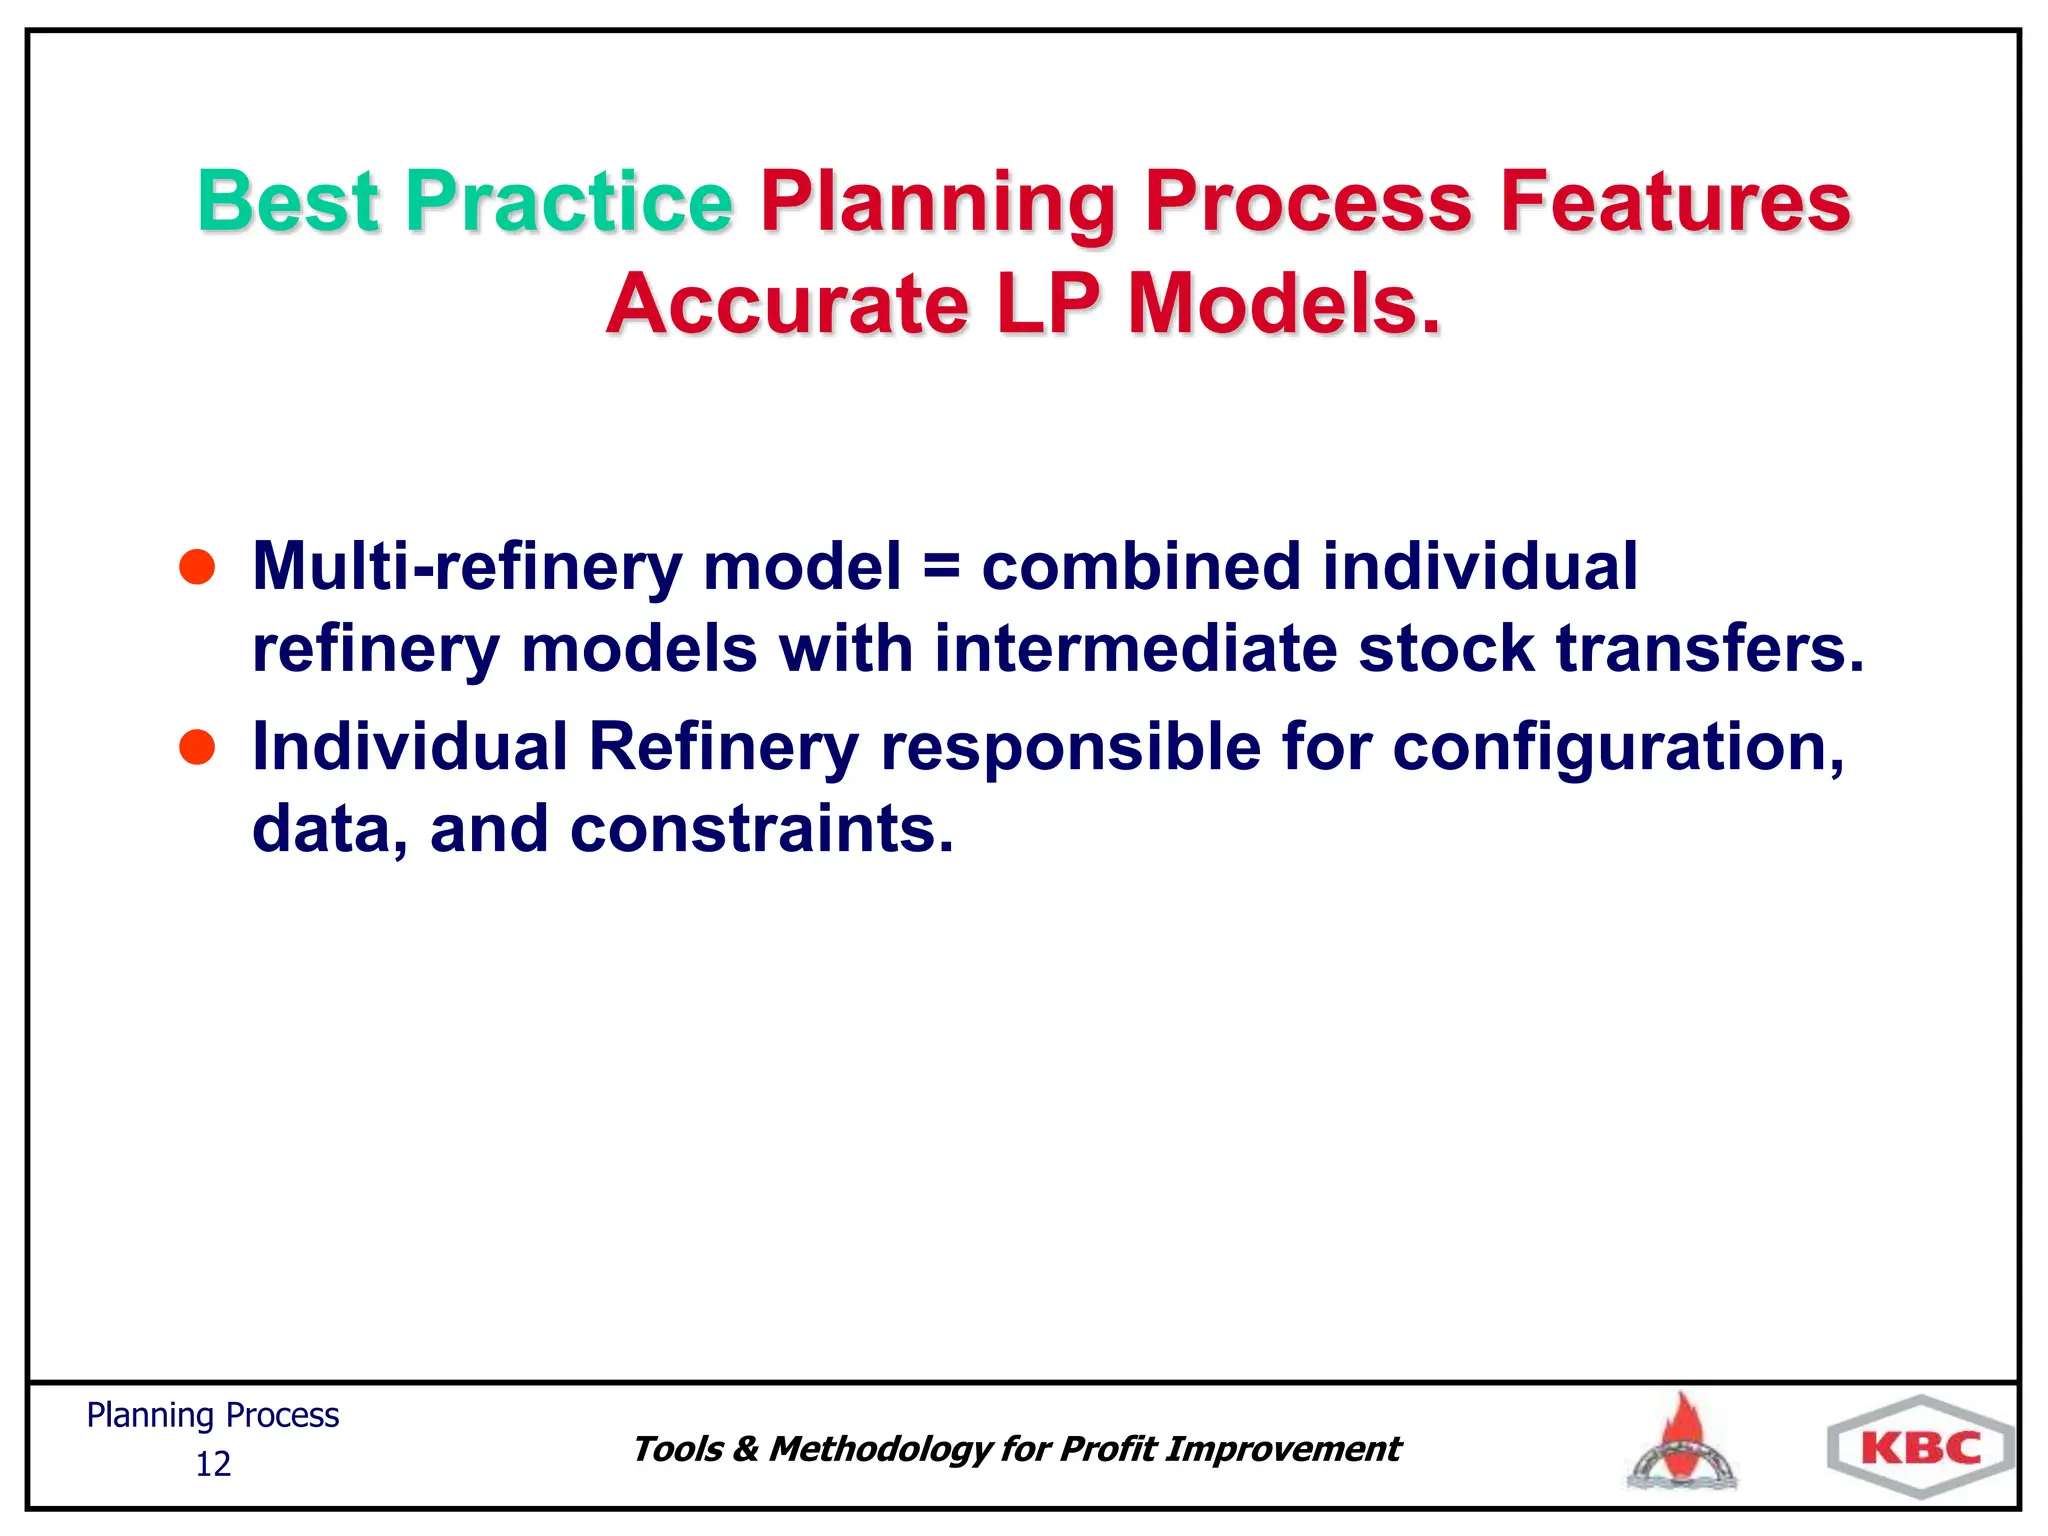
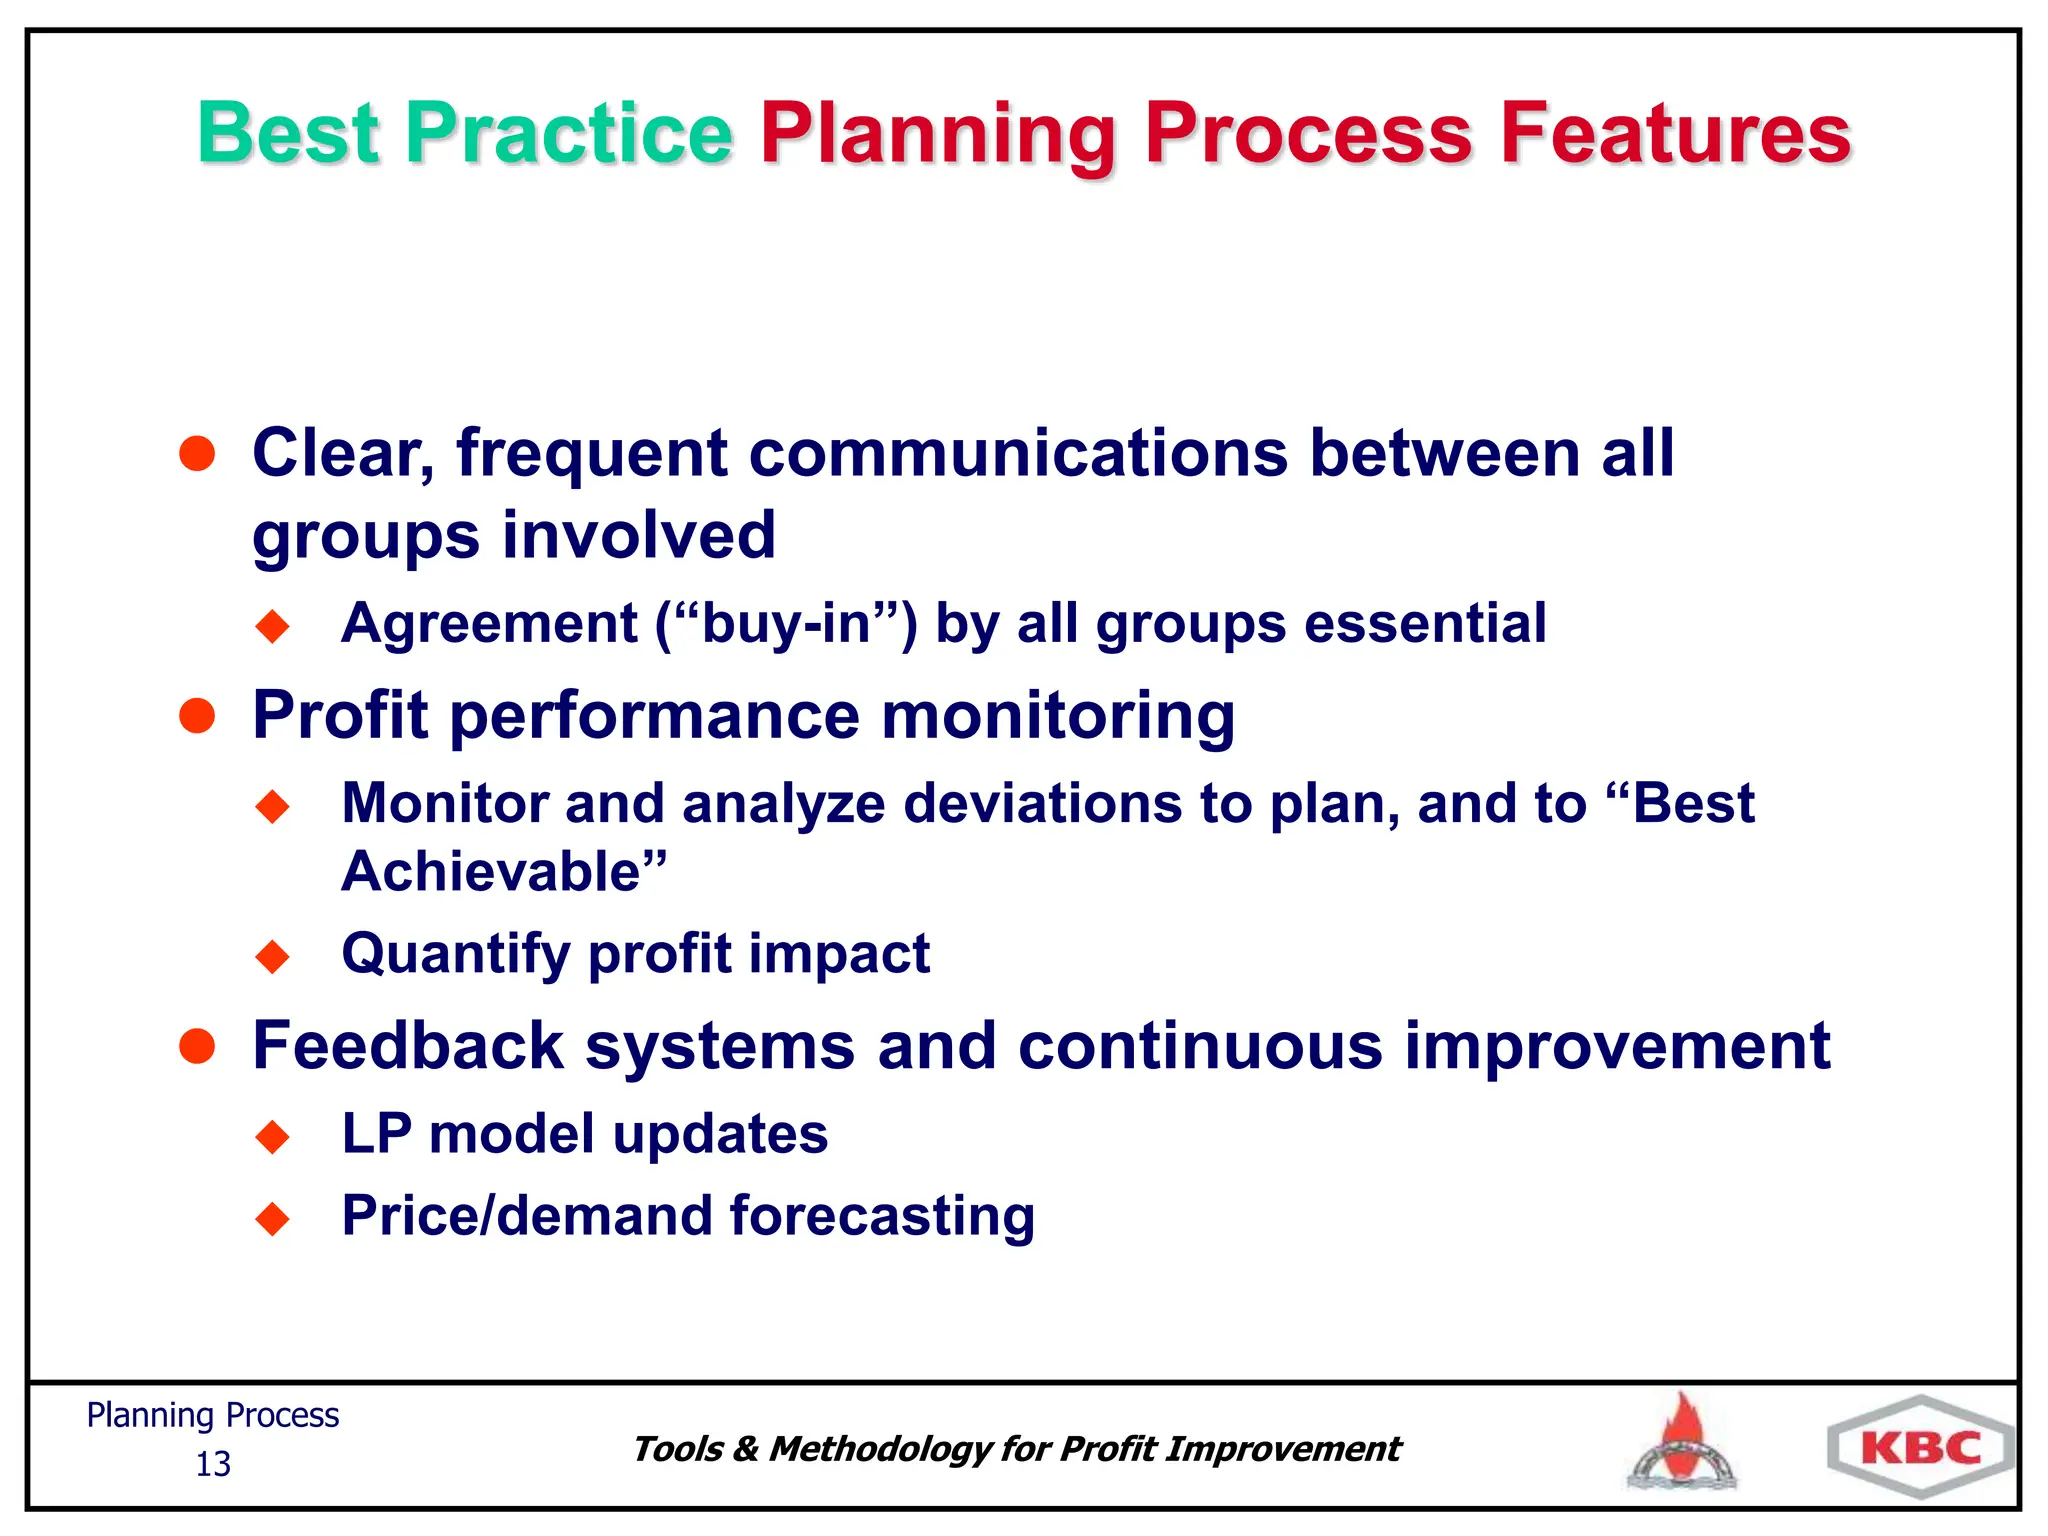
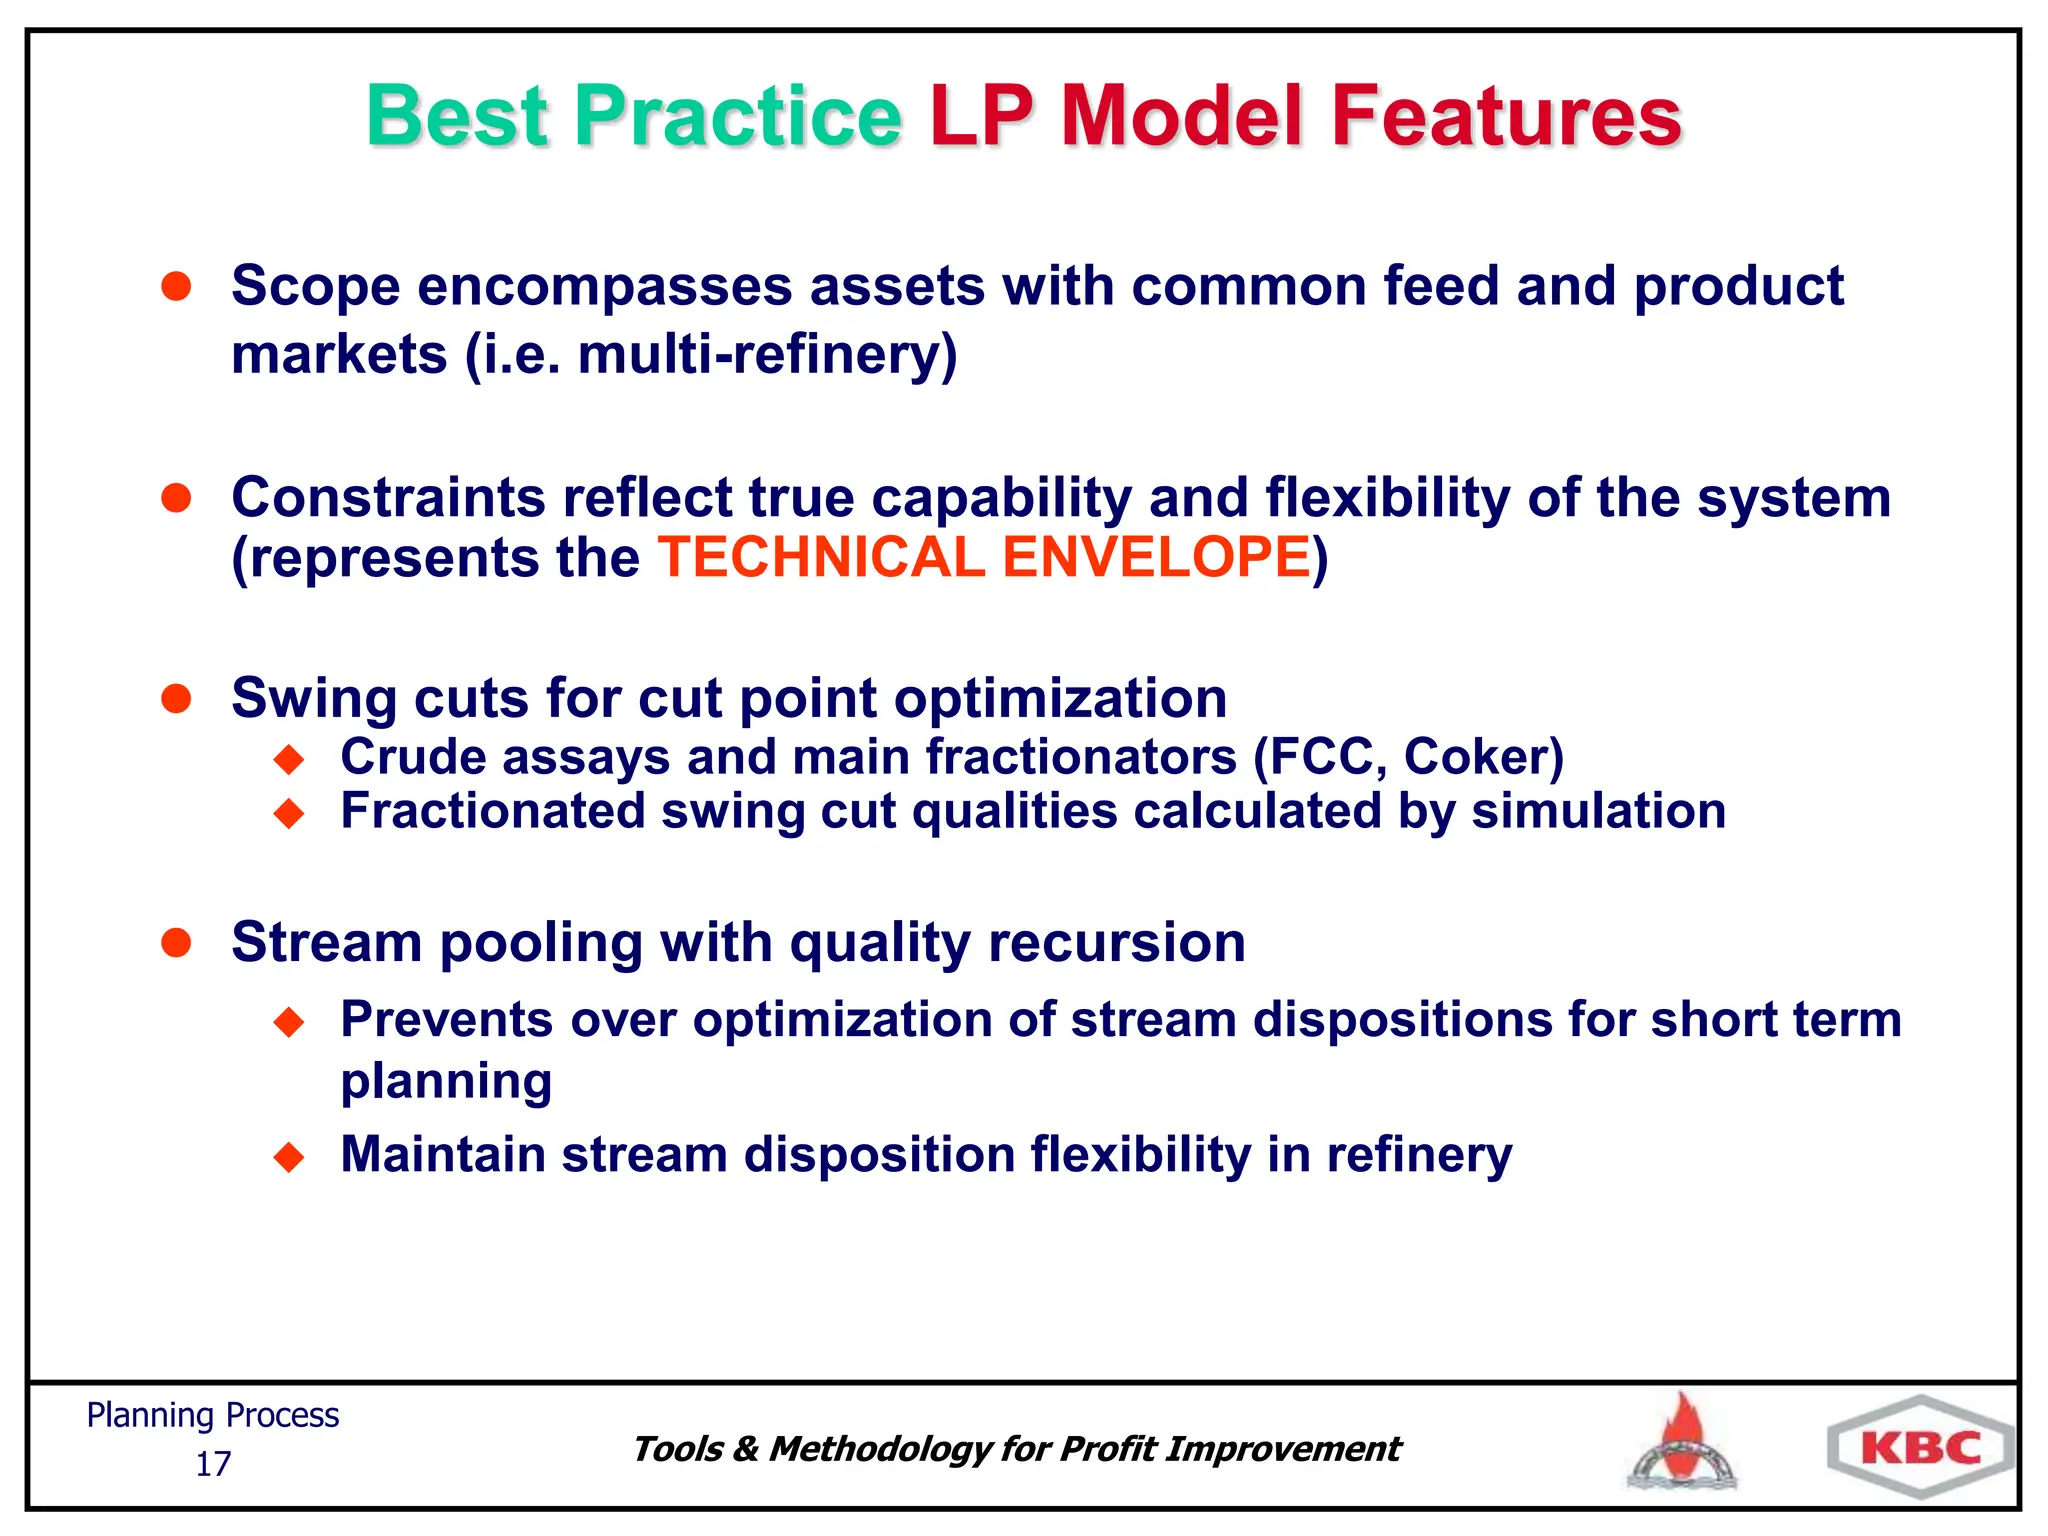
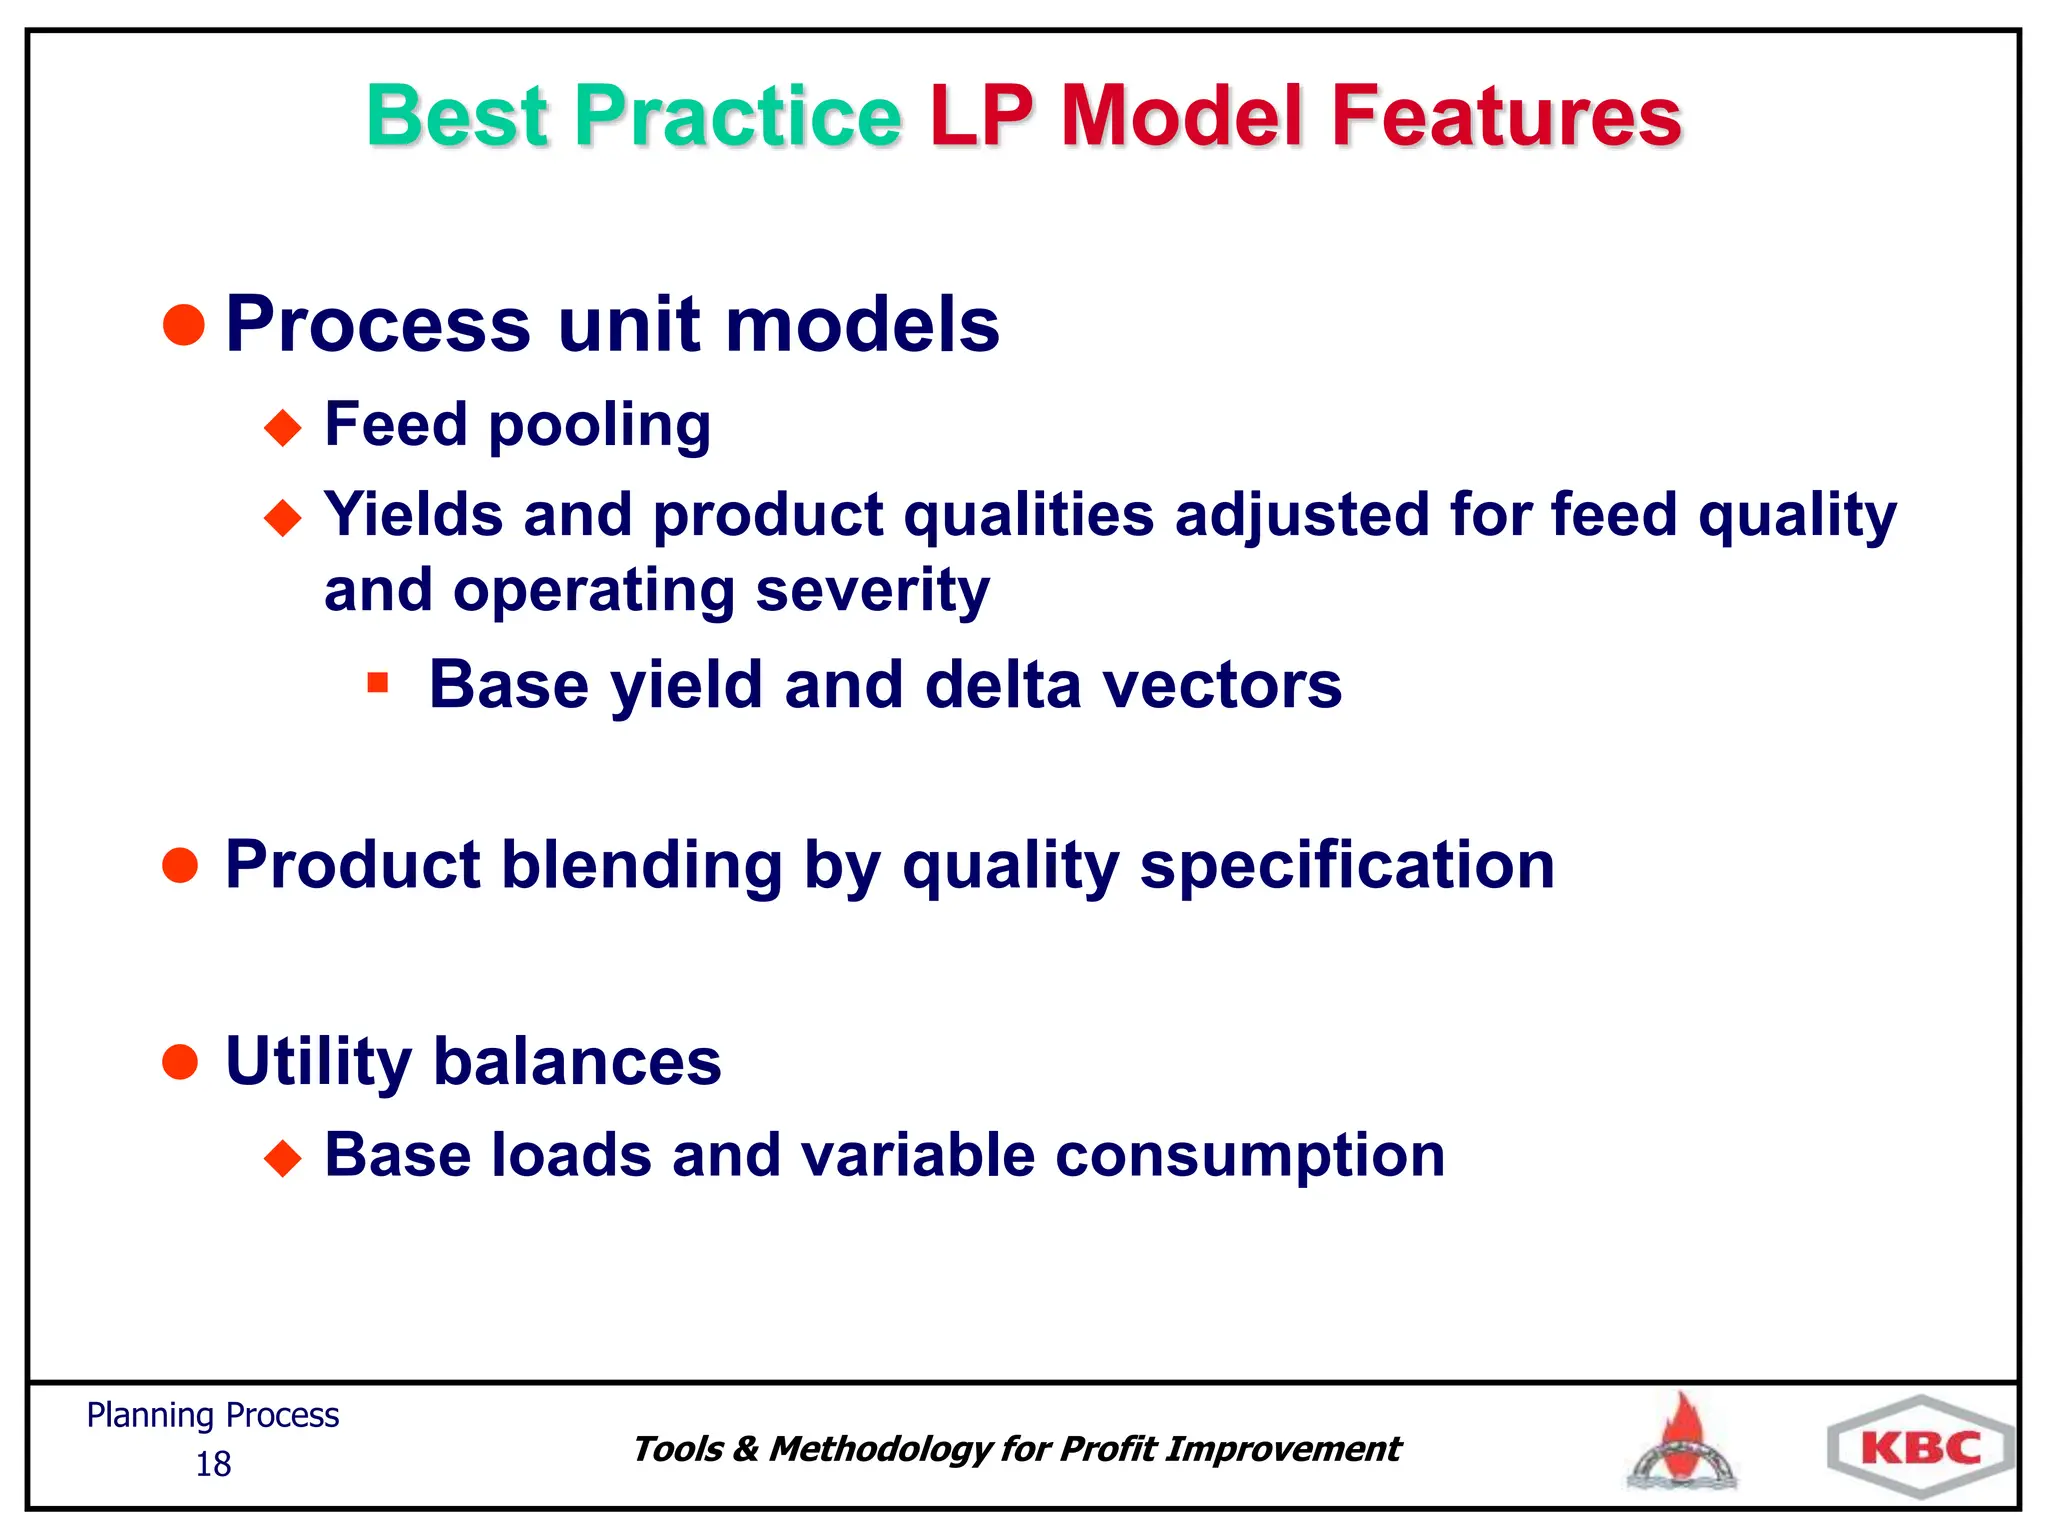
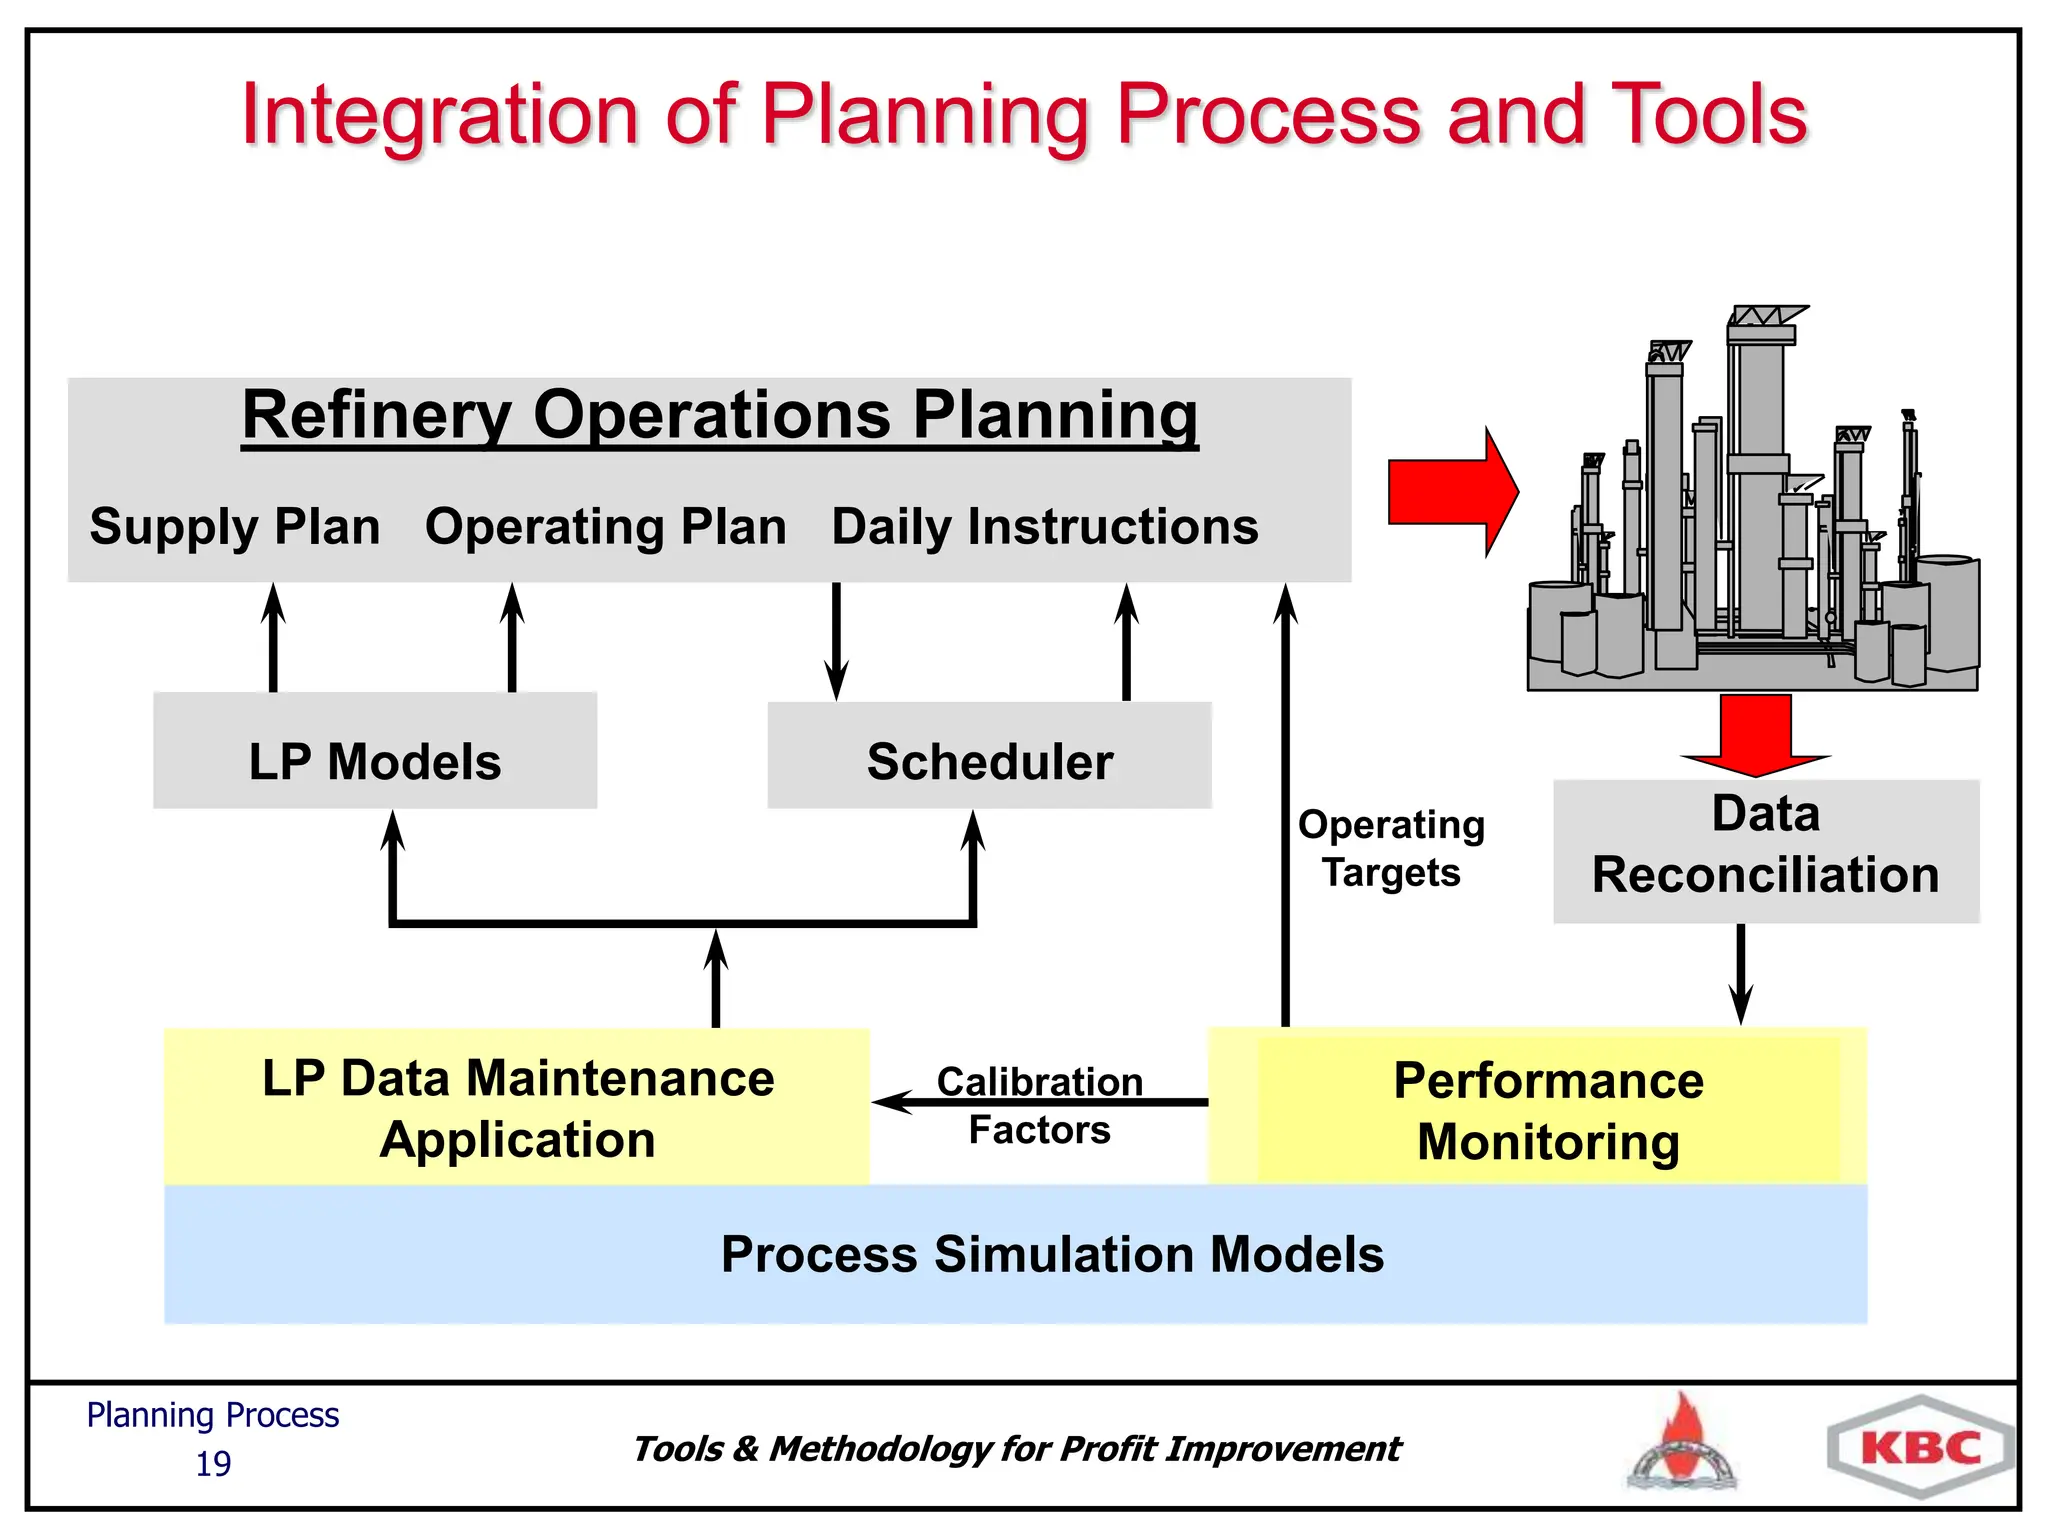
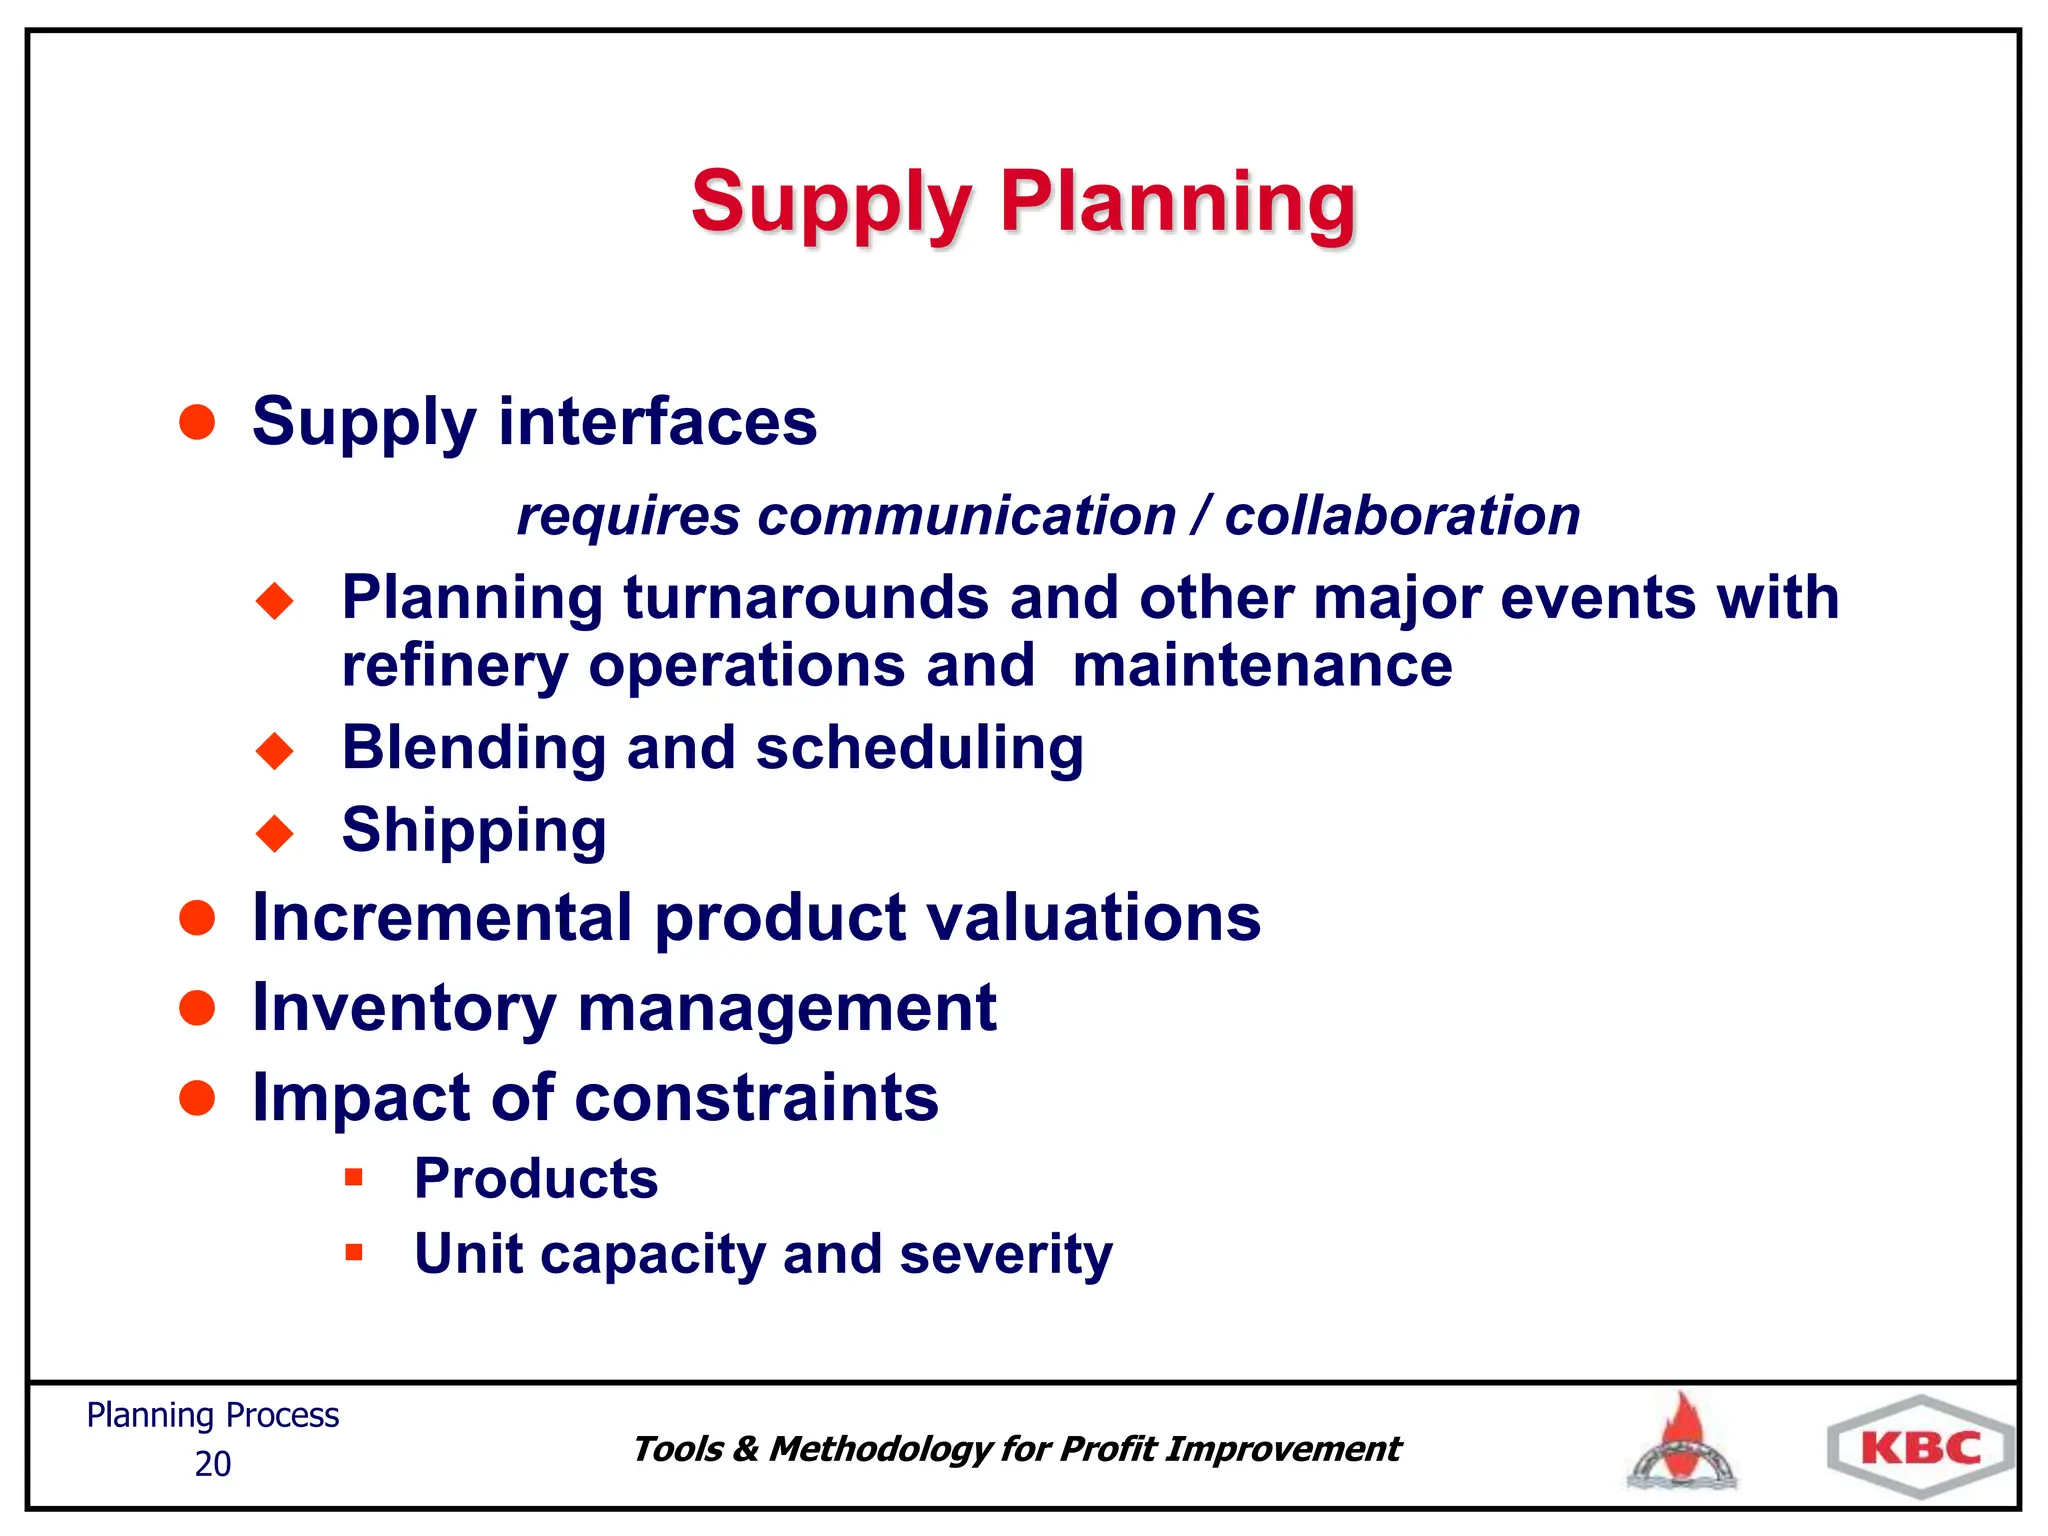
This document discusses best practices for refinery planning processes and tools. It recommends that planning processes involve multi-refinery linear programming models, accurate representation of unit operations, and clear communication between planning and operations teams. Regular performance reviews should use backcasting to understand profit deviations and ensure continuous improvement. The goal is for refineries to operate according to the optimal plan defined by the linear programming model.
Production planning and control (PPC) involves planning production and ensuring production targets are met. PPC has three stages - planning, operations, and control. Planning determines production schedules and sequences. Operations carry out production according to plans. Control monitors performance against targets and provides feedback to improve performance. The objective of PPC is to deliver quality products to customers on time while optimizing resource use and minimizing costs and lead times. PPC functions include routing, scheduling, loading, dispatching, and inventory control.
M. Anbalagan has nearly 6 years of experience in quality control and supplier quality in the industrial sector. He is adept at carrying out tests and inspections to ensure quality standards are met for both in-house processes and supplier processes. Anbalagan is also proficient in developing quality improvement processes, performing supplier audits, and resolving quality issues. His experience includes roles in quality assurance, reducing inspection times, implementing quality systems, and improving supplier performance.
The document outlines Project LAKSHYA's goals of improving productivity, quality, customer satisfaction and process efficiency at two plants. Key performance indicators are designed for Plant 2 focusing on improved productivity, customer focus, reduced costs, quality improvement, system improvements and innovation. Managers are given objectives in these areas and will form teams to implement action plans. The status review in October 2013 found data collection was in progress. The document also discusses manufacturing system design, strategy, policies, infrastructure and continual improvement initiatives.
- Air Products implemented SAP APO to integrate demand planning, supply planning, and production scheduling in order to improve forecast accuracy, reduce inventory levels, and improve customer service.
- Key factors for a successful APO implementation included focusing on business processes first before technology, dedicating full-time resources to the project, and having a multi-year change management effort to fully realize benefits.
- Air Products saw improvements like reduced inventory levels and instability, improved forecast accuracy from 50% to 70%, higher on-time delivery rates from 60% to 97%, and more accurate financial forecasting.
The document discusses issues with the maintenance department's planning and scheduling process. Specifically, it notes that the inability to forecast incoming vendor costs up to 72 hours in advance contributes to $10 million in annual over budget costs. The analysis found that using single vendor codes instead of multi-vendor codes could help address this by increasing forecast accuracy and reducing rescheduling costs. Implementing standardized planning codes as recommended may help align budgets, improve business processes, and save the company $10 million or more over multiple years.
The statistical process control can help manufacturers to control processes and ensure consistent output. In the dynamic realm of manufacturing, achieving consistent product quality is paramount.
Gail Rodriguez has over 15 years of experience utilizing Lean Six Sigma methodologies to improve processes and reduce costs. She has worked in quality roles at various manufacturing companies, managing projects that delivered over $5.4 million in annual savings. Rodriguez is skilled in DMAIC methodology and has trained others in Lean, Six Sigma, and quality systems. Currently she works as a Lean manufacturing instructor at a community college in North Carolina.
PRESENTATION ON S&OP KUNZITE SUPPLY CHAINHpm India
The document discusses the S&OP (Sales and Operations Planning) process. S&OP is a formal process consisting of meetings where data from various business areas is discussed to agree on the best course of action to balance supply and demand and meet profitability goals. The document outlines traditional S&OP challenges, benefits of S&OP including improved forecasting, capacity utilization and customer service, and how S&OP relates to other business plans.
This document discusses several key issues impacting a company's total business: [1] Managing warehouses and the supply chain, [2] Ensuring compliance, [3] Developing a lean culture, and [4] Harmonizing global logistics and sales & operations planning. It provides analysis on implementing more efficient processes to reduce costs, outlines challenges of coordinating a global S&OP process, and proposes an implementation plan for evaluating and selecting 3PL partners to help optimize warehouse and logistics operations.
Praveen Mole is a production supervisor with over 3 years of experience in manufacturing roles. He has expertise in areas like assembly line work, CNC programming, hydraulic machines, brazing, and new product development for auto air conditioning systems. Praveen is skilled in planning and executing projects while meeting quality standards. He also strives to improve processes through techniques to reduce costs, downtime, and enhance efficiency. Praveen received diploma in mechanical engineering and has undergone various trainings related to quality, lean manufacturing, and SAP.
Presentation made by Anshu Chauhan, Asstt Manager, Colorant India,at All India Seminar on Lean Management Techniques & the application for textile MSME
Supply planning is broken. Modern business challenges have reduced forecast accuracy, increased the effect of the bullwhip, and pushed inventories into a permanent state of imbalance.
Learn what MIT revealed at the Gartner Supply Chain Conference at https://o8supplychain.com/supply-planning-featured-case-studies/why-a-forecast-is-not-a-plan-and-what-mit-research-reveals-ppc/
Modern businessenvironmentandmanagementaccountingIsmail Noordin
The document discusses key aspects of the modern business environment including just-in-time production, total quality management, and computer integrated manufacturing. It describes how modern businesses operate in a highly competitive environment using advanced technologies like robotics. Methods like just-in-time focus on receiving goods only as needed to reduce waste and inventory costs. Total quality management seeks to ensure the highest quality through continuous feedback and improvements. Computer integrated manufacturing integrates the manufacturing enterprise through integrated systems and data communications.
Upstream optimization: How continuous improvement methods are having a positi...Tara Bilby
The experiences of four energy industry companies show how continuous improvement techniques can produce measurable benefits, including improved on-time work order completion, cost savings, increased productivity, inventory reductions, and improved process effectiveness.
Upstream optimization: How continuous improvement methods are having a positi...Argo, Inc.
Continuous improvement techniques can help energy companies improve performance in changing market conditions. The document discusses four case studies where energy companies used continuous improvement to streamline operations, reduce waste, and lower costs. This resulted in benefits like improved on-time work completion, higher productivity, lower inventory levels, and increased process effectiveness. Continuous improvement helps identify inefficiencies and implement improvements to address issues across all levels of a company's operations.
Production Planning and Control
Objective of PPC
Classification/Functions of PPC
Levels of PPC
Factors determining Production Planning Procedures
Production Planning System
Factors Determining PC procedures
Six sigma aims to reduce defects and conform to customer specifications. To make sure that each project adheres to customer specifications Adev Research assists your organization focus on process improvements and variation reduction.
Production Planning and Control
Objective of PPC
There are three stages in PPC
Classification/Functions of PPC
Benefits of PPC
Limitations of PPC
Production Planning / Operations Planning
Factors determining Production Planning Procedures
Production Planning System
Production Control
Factors Determining PC procedures
Main Functions of Production Planning
& Control Department
Plant Planning & Facility Planning
FBMC is a consulting firm that has 25 years of experience implementing change programs and delivering cost benefits and performance improvements to major companies. They use a balanced "top-down" and "bottom-up" analysis approach to understand a business's capabilities, costs, processes and opportunities for improvement. Their unique low-cost implementation approach allows clients to achieve significant cost savings while still receiving the same level of services as from major consulting companies.
Oil and Gas companies are facing energy transition with a significant increase in energy demand, but also a shift towards a lower carbon fuel mix. In addition, digitalization is disrupting manifested business models. A new way of business steering and planning is required to cope with these challenges in order to shape a successful strategy for the future.
Resume - Steve K. Mu - Supply Chain Engineer 0611Ko-Ping Mu
This document summarizes the professional experience and qualifications of Steve K. Mu. As a supply chain engineer, Mu has improved supply chain performance at GopherScope Mfg. through various projects. He developed quantitative forecasting methods to improve forecast accuracy by 37% and reduced average inventory levels by 23% without impacting demand fulfillment. Mu also reduced lead times by 18% by creating an integrated replenishment plan with a supplier. Additionally, he developed systems to automate data extraction and manipulation, saving 34% of analysts' time.
This document is a process quality assurance report submitted by Anglia Ruskin University. It contains solutions to three questions related to quality assurance techniques. For question 1, it proposes a 24-month business plan to reduce reworks and costs using statistical process control methods like control charts, Pareto analysis, ISO/BS standards, Six Sigma, and total quality management. For question 2, it demonstrates how to construct a Pareto chart and analyzes a Pareto chart of claims by product component. For question 3, it constructs a Pareto chart of total claim costs by component and analyzes which components contribute most to costs.
An Intelligent Decision and Management Support ToolMuna Hamdi
1. The document proposes an Intelligent Decision and Management Support Tool (IDMST) to help food production managers make quick decisions that balance costs and profits.
2. The IDMST would use real-time shopfloor data, simulations, and a knowledge base to evaluate decision options and recommend the most cost-effective actions.
3. Such a tool could help small- and medium-sized food companies improve productivity and decision-making without requiring complex and expensive systems.
This document discusses goals and processes for managing a supply chain at Sasmos. It aims for customer satisfaction through cost, schedule and quality commitments. It takes a two-dimensional approach to project management, applying different levels of formality for small and large projects. Key areas covered include purchasing, operations, distribution, integration, organization, planning, scheduling, resources, quality, risk management and tracking. The document also discusses trends toward strategic sourcing, alliances and partnerships to improve performance and reduce costs.
Discover the latest insights on Data Driven Maintenance with our comprehensive webinar presentation. Learn about traditional maintenance challenges, the right approach to utilizing data, and the benefits of adopting a Data Driven Maintenance strategy. Explore real-world examples, industry best practices, and innovative solutions like FMECA and the D3M model. This presentation, led by expert Jules Oudmans, is essential for asset owners looking to optimize their maintenance processes and leverage digital technologies for improved efficiency and performance. Download now to stay ahead in the evolving maintenance landscape.
Optimizing Gradle Builds - Gradle DPE Tour Berlin 2024Sinan KOZAK
Sinan from the Delivery Hero mobile infrastructure engineering team shares a deep dive into performance acceleration with Gradle build cache optimizations. Sinan shares their journey into solving complex build-cache problems that affect Gradle builds. By understanding the challenges and solutions found in our journey, we aim to demonstrate the possibilities for faster builds. The case study reveals how overlapping outputs and cache misconfigurations led to significant increases in build times, especially as the project scaled up with numerous modules using Paparazzi tests. The journey from diagnosing to defeating cache issues offers invaluable lessons on maintaining cache integrity without sacrificing functionality.
Null Bangalore | Pentesters Approach to AWS IAMDivyanshu
#Abstract:
- Learn more about the real-world methods for auditing AWS IAM (Identity and Access Management) as a pentester. So let us proceed with a brief discussion of IAM as well as some typical misconfigurations and their potential exploits in order to reinforce the understanding of IAM security best practices.
- Gain actionable insights into AWS IAM policies and roles, using hands on approach.
#Prerequisites:
- Basic understanding of AWS services and architecture
- Familiarity with cloud security concepts
- Experience using the AWS Management Console or AWS CLI.
- For hands on lab create account on [killercoda.com](https://killercoda.com/cloudsecurity-scenario/)
# Scenario Covered:
- Basics of IAM in AWS
- Implementing IAM Policies with Least Privilege to Manage S3 Bucket
- Objective: Create an S3 bucket with least privilege IAM policy and validate access.
- Steps:
- Create S3 bucket.
- Attach least privilege policy to IAM user.
- Validate access.
- Exploiting IAM PassRole Misconfiguration
-Allows a user to pass a specific IAM role to an AWS service (ec2), typically used for service access delegation. Then exploit PassRole Misconfiguration granting unauthorized access to sensitive resources.
- Objective: Demonstrate how a PassRole misconfiguration can grant unauthorized access.
- Steps:
- Allow user to pass IAM role to EC2.
- Exploit misconfiguration for unauthorized access.
- Access sensitive resources.
- Exploiting IAM AssumeRole Misconfiguration with Overly Permissive Role
- An overly permissive IAM role configuration can lead to privilege escalation by creating a role with administrative privileges and allow a user to assume this role.
- Objective: Show how overly permissive IAM roles can lead to privilege escalation.
- Steps:
- Create role with administrative privileges.
- Allow user to assume the role.
- Perform administrative actions.
- Differentiation between PassRole vs AssumeRole
Try at [killercoda.com](https://killercoda.com/cloudsecurity-scenario/)
Rainfall intensity duration frequency curve statistical analysis and modeling...bijceesjournal
Using data from 41 years in Patna’ India’ the study’s goal is to analyze the trends of how often it rains on a weekly, seasonal, and annual basis (1981−2020). First, utilizing the intensity-duration-frequency (IDF) curve and the relationship by statistically analyzing rainfall’ the historical rainfall data set for Patna’ India’ during a 41 year period (1981−2020), was evaluated for its quality. Changes in the hydrologic cycle as a result of increased greenhouse gas emissions are expected to induce variations in the intensity, length, and frequency of precipitation events. One strategy to lessen vulnerability is to quantify probable changes and adapt to them. Techniques such as log-normal, normal, and Gumbel are used (EV-I). Distributions were created with durations of 1, 2, 3, 6, and 24 h and return times of 2, 5, 10, 25, and 100 years. There were also mathematical correlations discovered between rainfall and recurrence interval.
Findings: Based on findings, the Gumbel approach produced the highest intensity values, whereas the other approaches produced values that were close to each other. The data indicates that 461.9 mm of rain fell during the monsoon season’s 301st week. However, it was found that the 29th week had the greatest average rainfall, 92.6 mm. With 952.6 mm on average, the monsoon season saw the highest rainfall. Calculations revealed that the yearly rainfall averaged 1171.1 mm. Using Weibull’s method, the study was subsequently expanded to examine rainfall distribution at different recurrence intervals of 2, 5, 10, and 25 years. Rainfall and recurrence interval mathematical correlations were also developed. Further regression analysis revealed that short wave irrigation, wind direction, wind speed, pressure, relative humidity, and temperature all had a substantial influence on rainfall.
Originality and value: The results of the rainfall IDF curves can provide useful information to policymakers in making appropriate decisions in managing and minimizing floods in the study area.
3. Tools & Methodology for Profit Improvement
Planning Process
3
Petroleum Supply Chain
Supply Chain Management within refinery
Trade-offs between inventory (working capital) and
supply chain costs
Blendstock inventory vs. optimum product blending
Product inventory vs. economies of shipment size
Product inventory vs. customer demands
Intermediate feedstock inventory vs. plant reliability
Accurate refinery planning essential to evaluate supply
chain costs
4. Tools & Methodology for Profit Improvement
Planning Process
4
Planning Process
Methods & Procedures
Communications
Performance Metrics
Feedback
Continuous Improvements
Model Maintenance
Planning Tools
• Refinery LP Models
• Structure
• Yield/Quality Data
• Constraints
• Operations scheduling
• Blend Scheduling
Plans
&
Decisions
Accurate Tools
Best Process Better
Plans
Better
Decisions
More Profit
Planning System Elements
5. Tools & Methodology for Profit Improvement
Planning Process
5
Planning and Scheduling Horizons
Horizon Time Span Purpose
Long Range 2-5+ years Capital Strategy
Term Supply Contracts
Annual 12 months Budgets
Monthly 2-3+ months Monthly feed purchases
Product sales outlook
Operating strategies
Inventory strategy
Weekly/Biweekly 4-6 weeks Unit strategies
Production volumes
Daily 10-14 days Operating instructions
Stream and inventory management
Unit targets
Product Blends
Immediate Optimize unit operations
LP
Scheduler
APC/Simulation
6. Tools & Methodology for Profit Improvement
Planning Process
6
Obstacles to Good Planning
Limitations
Resources and manpower
Knowledge and experience
View limited to KNPC only
Lack of simulation models for accurate yield predictions
Result
Out-of-date planning models
Inaccurate predictions of product production
Operations ignore planning directions/strategies
Experience factors and spreadsheets used for local
strategies and optimization
Planning operates in “glorious isolation”
7. Tools & Methodology for Profit Improvement
Planning Process
7
Common Planning Problems
Crude quality impact not adequately modeled
Limited cut point optimization
Perfect fractionation
Limited process unit yields representation
Limited feed quality and severity adjustments
Models over-constrained;
Constraints not challenged
Inconsistencies between integrated and local LP models
Ineffective analysis of Actual vs. Plan
Ineffective LP model maintenance
8. Tools & Methodology for Profit Improvement
Planning Process
8
Typical 10-15c/bbl benefit
Or $30 million/year for KNPC
Benefits of Improved Planning
Increased value of products produced
Improved utilization of facilities
Optimized operating instructions to process units and
to blending
Better timing of product liftings
Plan closer to optimum; Feasible schedules closer to
the plan
Better response to market opportunities and changes in
liftings
Better tactics to deal with planned plant shutdowns
Reduced inventories and internal oil movements
9. Tools & Methodology for Profit Improvement
Planning Process
9
Best Practices
Planning Processes
And
Planning Tools
10. Tools & Methodology for Profit Improvement
Planning Process
10
Best Practice Planning Process Features
Supply Plans for Asset Optimization.
Multi-refinery LP (M-PIMS) model of refineries
with common crude supply and product markets.
Optimum allocation of products to refineries
based on refinery capabilities.
Optimize use of intermediates and blend
components between refineries.
Long-term crude supply forecast.
11. Tools & Methodology for Profit Improvement
Planning Process
11
Best Practice Planning Process Features
Operating Plans by Individual Refinery
Overall feed supply & product demands from
supply plan.
Fine-tune product slate by refinery.
Optimize operations with current operating
constraints.
Interim plan updates.
12. Tools & Methodology for Profit Improvement
Planning Process
12
Best Practice Planning Process Features
Accurate LP Models.
Multi-refinery model = combined individual
refinery models with intermediate stock transfers.
Individual Refinery responsible for configuration,
data, and constraints.
13. Tools & Methodology for Profit Improvement
Planning Process
13
Best Practice Planning Process Features
Clear, frequent communications between all
groups involved
Agreement (“buy-in”) by all groups essential
Profit performance monitoring
Monitor and analyze deviations to plan, and to “Best
Achievable”
Quantify profit impact
Feedback systems and continuous improvement
LP model updates
Price/demand forecasting
14. Tools & Methodology for Profit Improvement
Planning Process
14
Best Practice Planning Process Features
VIRTUOUS CIRCLE
EXECUTE
PLAN
MEASURE
PERFORMANCE
REVIEW
15. Tools & Methodology for Profit Improvement
Planning Process
15
Operations Planning Cycles
PLAN
SCHEDULE
OPERATE
Variance Analysis
Model Update
Feedback
&
Adjustment
16. Tools & Methodology for Profit Improvement
Planning Process
16
Complexity
Detail
Accuracy Ease of Use
Input Data Management
Interpretation of results
Solution speed
Maintenance
Linear models of non-linear refinery operations
Key: Accurately capture major economic drivers
Planning Tools
17. Tools & Methodology for Profit Improvement
Planning Process
17
Best Practice LP Model Features
Scope encompasses assets with common feed and product
markets (i.e. multi-refinery)
Constraints reflect true capability and flexibility of the system
(represents the TECHNICAL ENVELOPE)
Swing cuts for cut point optimization
Crude assays and main fractionators (FCC, Coker)
Fractionated swing cut qualities calculated by simulation
Stream pooling with quality recursion
Prevents over optimization of stream dispositions for short term
planning
Maintain stream disposition flexibility in refinery
18. Tools & Methodology for Profit Improvement
Planning Process
18
Best Practice LP Model Features
Process unit models
Feed pooling
Yields and product qualities adjusted for feed quality
and operating severity
Base yield and delta vectors
Product blending by quality specification
Utility balances
Base loads and variable consumption
19. Tools & Methodology for Profit Improvement
Planning Process
19
LP Models Scheduler
Refinery Operations Planning
Supply Plan Operating Plan Daily Instructions
Process Simulation Models
LP Data Maintenance
Application
Calibration
Factors
Performance
Monitoring
Data
Reconciliation
Operating
Targets
Integration of Planning Process and Tools
20. Tools & Methodology for Profit Improvement
Planning Process
20
Supply Planning
Supply interfaces
requires communication / collaboration
Planning turnarounds and other major events with
refinery operations and maintenance
Blending and scheduling
Shipping
Incremental product valuations
Inventory management
Impact of constraints
Products
Unit capacity and severity
21. Tools & Methodology for Profit Improvement
Planning Process
21
Product Blending
Inventory management
Blendstock and finished product
Shipment schedule coordination
Product quality giveaway
Tracking and reporting
Economic and operational impacts
22. Tools & Methodology for Profit Improvement
Planning Process
22
Operations Planning
Typically 1 month time horizon.
Monthly operating plan.
Optimum asset utilization, and product production.
Spot sales opportunities for products, intermediates and
blend components.
Valuations and impact on plan.
Unit shutdown planning.
Planned and unplanned maintenance and Turnarounds.
Inventory management.
Outages, overfills.
Interface with scheduling, operations, maintenance.
23. Tools & Methodology for Profit Improvement
Planning Process
23
Refinery Scheduling
Scheduling does not optimise, but sequences
operations
Methodology for translating plan into operating
orders
Interfaces with planning / operations / process engineers /
maintenance
Updating operating instructions
Frequency
Methodology / techniques
Communication techniques
Written / electronic
Daily meetings
24. Tools & Methodology for Profit Improvement
Planning Process
24
Performance Measurement
What was the actual operation?
Record flows in volume, convert to weight.
Record lab tests for critical qualities.
Cumulative Month to date Mass Balances on
critical process using sensible method for
accounting for missing data.
Volume and weight average of product
dispatched * critical quality giveaway.
ANYTHING UNMEASURED CANNOT BE
CONTROLLED
25. Tools & Methodology for Profit Improvement
Planning Process
25
Performance Review Aims
Ensure that refinery always operates at
optimum as defined by LP model plan.
NOT to allocate BLAME.
Constructive, NOT Destructive, criticism.
NOT to figure out how much profit was lost
because no human can forecast future.
Update plan with better data, more realistic
constraints, technical envelope.
Ensure operations are always at current
optimum.
26. Tools & Methodology for Profit Improvement
Planning Process
26
Back-casting
A method of measuring the planned vs. actual
profit deviation, and identifying the causes.
Profit deviation need not be a loss. Can be extra
profit because plan was too pessimistic.
Backcasting uses the LP model (using cases) to
calculate profit.
Compare Backcast solutions to help understand
the cause of profit differences.
27. Tools & Methodology for Profit Improvement
Planning Process
27
Using Back-casting Cases in
Performance Review
Are deviations “one-off” or part of a trend?
Are measurements of actual performance
believable and accurate?
Decide what actions required to avoid negative
(or positive) deviations in future.
28. Tools & Methodology for Profit Improvement
Planning Process
28
Actions From Performance Review
Do more research into cause by process engineers,
including simulation model runs, plant test runs, lab
testing.
Change the LP model data.
Add, tighten, or free up, constraints in the LP model.
Change Process operations and product blending to make
more profit at no cost.
Persuade management to accept costs for items like extra
demurrage and maintenance using Backcasting results.
Make case to Corporate Planning for extra investments
using Backcasting results.
29. Tools & Methodology for Profit Improvement
Planning Process
29
Profitability Gaps
Prices
Crude Plan Actual
Products Plan Actual
Rates
Crude Plan Opt Actual
Products Plan Opt Opt Actual Opt
Refinery
capacity Plan Actual Best
Lost
Opportunity
Margin
$/bbl
Plan Actual
Best
Achievable
Market
Planning
Refinery