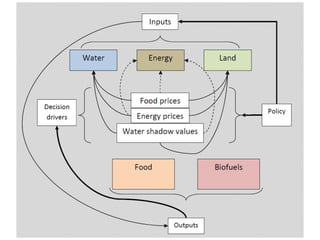
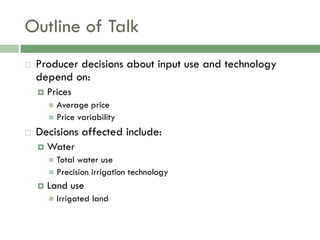
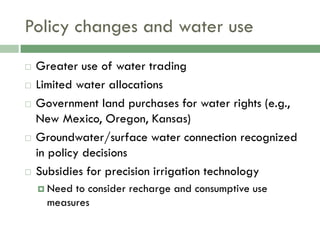
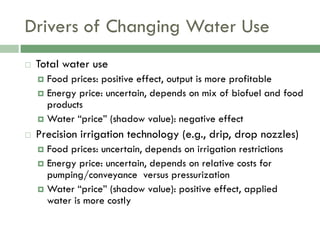
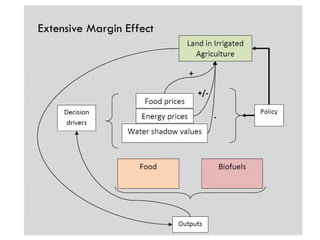
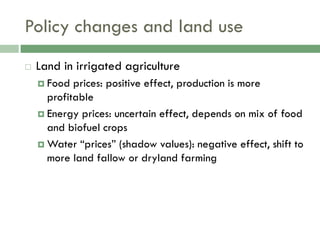
- Producer decisions around input use and technology depend on prices, price variability, and policies. Policy changes include greater water trading, limited allocations, and subsidies for precision irrigation.
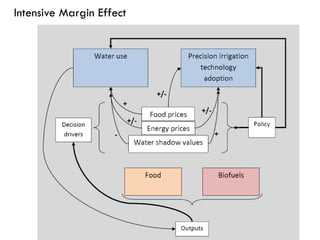
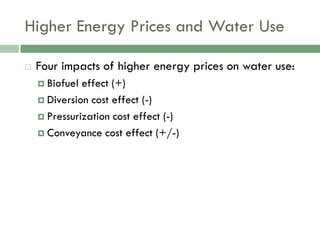
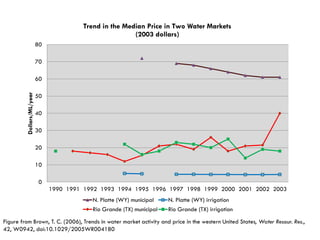
- Higher energy prices could increase or decrease total water use depending on impacts to biofuel production, pumping costs, and conveyance costs. Water trading allows farmers to adopt conservation technologies by selling unused water.
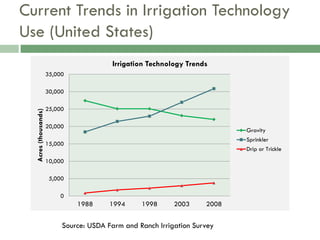
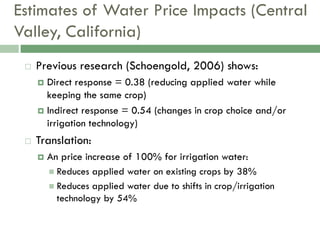
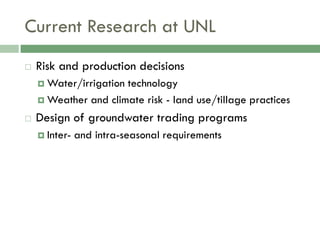
- Estimates show a 100% water price increase could reduce applied water by 38-54% by changing crops or irrigation methods. Current research examines risk, production decisions, and groundwater trading program design.