Download to read offline
![<script type="text/javascript" src="../js/themes/gray.js"></script>
-->
<!-- 1b) Optional: the exporting module -->
<script type="text/javascript" src="js/modules/exporting.js"></script>
<!-- 2. Add the JavaScript to initialize the chart on document ready -->
<script type="text/javascript">
/**
* Visualize an HTML table using Highcharts. The top (horizontal) header
* is used for series names, and the left (vertical) header is used
* for category names. This function is based on jQuery.
* @param {Object} table The reference to the HTML table to visualize
* @param {Object} options Highcharts options
*/
Highcharts.visualize = function(table, options) {
// the categories
options.xAxis.categories = [];
$('tbody th', table).each( function(i) {
options.xAxis.categories.push(this.innerHTML);
});
// the data series
options.series = [];
$('tr', table).each( function(i) {
var tr = this;](https://image.slidesharecdn.com/2190pertemuan24polling-141220203744-conversion-gate01/85/2190-pertemuan24-polling-2-320.jpg)
![$('th, td', tr).each( function(j) {
if (j > 0) { // skip first column
if (i == 0) { // get the name and init the series
options.series[j - 1] = {
name: this.innerHTML,
data: []
};
} else { // add values
options.series[j - 1].data.push(parseFloat(this.innerHTML));
}
}
});
});
var chart = new Highcharts.Chart(options);
}
// On document ready, call visualize on the datatable.
$(document).ready(function() {
var table = document.getElementById('datatable'),
options = {
chart: {
renderTo: 'container',
defaultSeriesType: 'column'
},
title: {
text: 'HASIL POLING TENTANG TAMPILAN WEBSITE'
},](https://image.slidesharecdn.com/2190pertemuan24polling-141220203744-conversion-gate01/85/2190-pertemuan24-polling-3-320.jpg)

![<!--<table id="datatable" class="datatable" width="70%" style="visibility:hidden">-->
<!---untuk koneksi database dan menampilkan data-->
<?php
include_once "koneksi.php";
$query=mysql_query("SELECT id_calon,nama_calon FROM jawabpoling WHERE
id_pelaksanaan='$id_pelaksanaan'");
?>
<table border=0 id="datatable" class="table table-striped table-hover" width="90%" align="center">
<thead>
<tr>
<th width="14%"> </th>
<th width="20%">Sangat Baik</th>
<th width="20%">Baik</th>
<th width="20%">Cukup</th>
<th width="20%">Kurang</th>
<th width="20%">Sangat Kurang</th>
</tr>
</thead>
<tbody>
<tr>
<th><div align="left">Jumlah Voter</div></th>
<td align="center"><?php
$query1=mysql_query("SELECT count(*) as jumlah FROM jawabpoling WHERE jawaban='A'");
$hs=mysql_fetch_array($query1);
echo $hs['jumlah'];?></td>](https://image.slidesharecdn.com/2190pertemuan24polling-141220203744-conversion-gate01/85/2190-pertemuan24-polling-5-320.jpg)
![<td align="center"><?php
$query1=mysql_query("SELECT count(*) as jumlah FROM jawabpoling WHERE jawaban='B'");
$hs=mysql_fetch_array($query1);
echo $hs['jumlah'];?></td>
<td align="center"><?php
$query1=mysql_query("SELECT count(*) as jumlah FROM jawabpoling WHERE jawaban='C'");
$hs=mysql_fetch_array($query1);
echo $hs['jumlah'];?></td>
<td align="center"><?php
$query1=mysql_query("SELECT count(*) as jumlah FROM jawabpoling WHERE jawaban='D'");
$hs=mysql_fetch_array($query1);
echo $hs['jumlah'];?></td>
<td align="center"><?php
$query1=mysql_query("SELECT count(*) as jumlah FROM jawabpoling WHERE jawaban='E'");
$hs=mysql_fetch_array($query1);
echo $hs['jumlah'];?></td>
</tr>
</tbody>
</table>
</body>
</html>](https://image.slidesharecdn.com/2190pertemuan24polling-141220203744-conversion-gate01/85/2190-pertemuan24-polling-6-320.jpg)


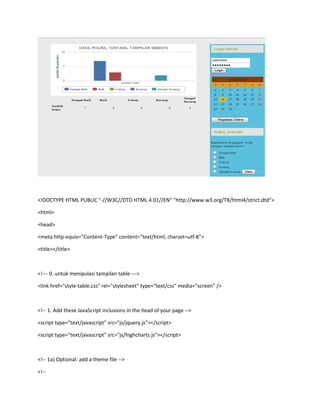
The document discusses visualizing an HTML table containing poll results using Highcharts. It includes instructions to include necessary JavaScript libraries, initialize a chart on page load by passing the table and chart options to a Highcharts visualization function, and output the poll response counts from a database into the table. This will generate an interactive column chart of the poll results from the data in the HTML table.
![Ex[1].3 php db connectivity](https://cdn.slidesharecdn.com/ss_thumbnails/ex1-3phpdbconnectivity-130227182839-phpapp02-thumbnail.jpg?width=640&height=640&fit=bounds)