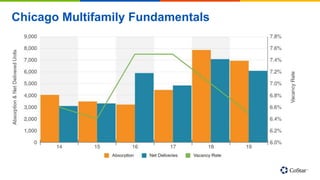
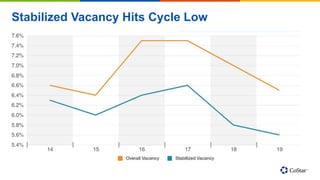
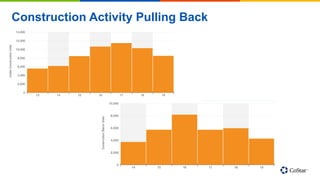
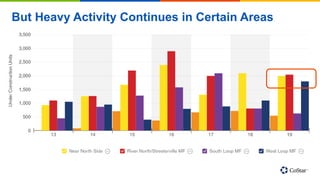
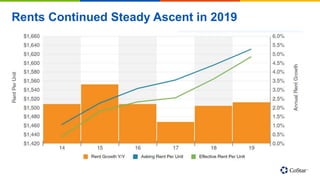
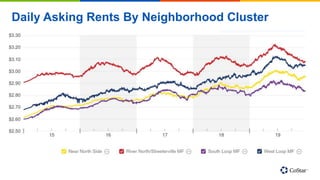
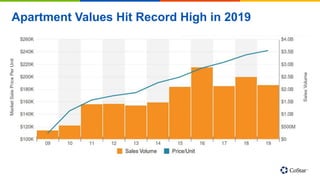
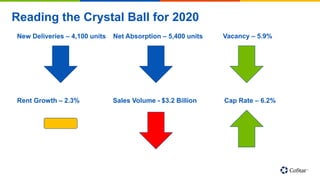
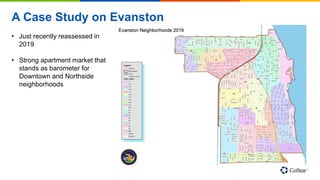
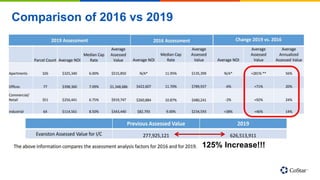
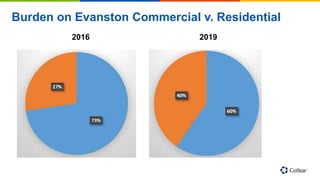
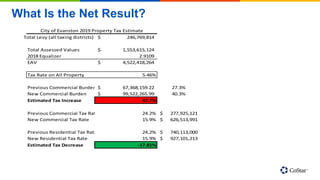
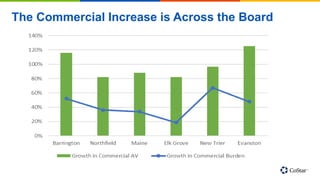
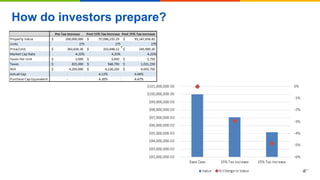
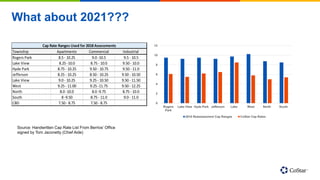
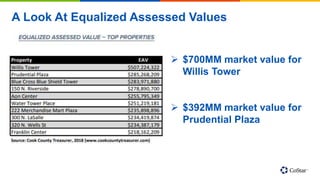
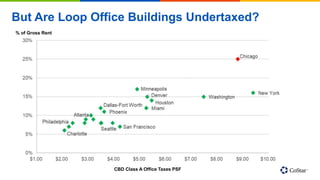
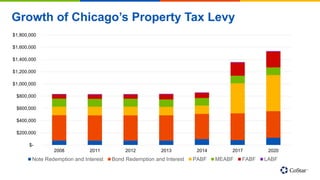
Chicago Commercial Update
A Recap of 2019 and Look at 2020
January 2020
Brandon Svec, Director & Market Economist
Agenda
• Demand Drivers
• Recap of 2019 and Looking Forward to 2020
• CRE Taxes and the 2019 Reassessments
• Questions
Demand Drivers
Chicago Employment Market At A Glance
Employment Growth Geographically Bifurcated
City of Chicago Population and Household Trends
Source: Census Bureau
% Change 2010 - 2018
0.56%
2.24%
-2.74%
8.65%
5.72%
-4.00%
-2.00%
0.00%
2.00%
4.00%
6.00%
8.00%
10.00%
Population Households Family Households Nonfamily
Households
Single Households
City of Chicago Population Age Breakout
-80,000
-40,000
0
40,000
80,000
0
200,000
400,000
600,000
800,000
0-19 20-34 35-54 55-64 65+
Total Change since 2010
Total Population Change since 2010
Source: Census Bureau
Cook County Homeownership Rate Trends
S&P/Case-Shiller Price Index – Chicago v National
Chicago
National
Recap of 2019 and Looking Forward to 2020
Chicago Multifamily Fundamentals
Stabilized Vacancy Hits Cycle Low
Daily Vacancy Across Neighborhood Clusters
Construction Activity Pulling Back
But Heavy Activity Continues in Certain Areas
Rents Continued Steady Ascent in 2019
Daily Asking Rents By Neighborhood Cluster
Apartment Values Hit Record High in 2019
Reading the Crystal Ball for 2020
New Deliveries – 4,100 units Net Absorption – 5,400 units Vacancy – 5.9%
Rent Growth – 2.3% Sales Volume - $3.2 Billion Cap Rate – 6.2%
Trends We’re Watching in 2020
• Chicago’s fiscal situation
• Pace of office-using job growth
• Spread between value of for rent and for sale housing
• Interest rates
• Millennial migration trends
• Impact of new assessment valuation methodology
• Investors risk appetite towards Chicago
2019 Reassessments and CRE Taxes
A Case Study on Evanston
• Just recently reassessed in
2019
• Strong apartment market that
stands as barometer for
Downtown and Northside
neighborhoods
Comparison of 2016 vs 2019
125% Increase!!!
Burden on Evanston Commercial v. Residential
2016 2019
What Is the Net Result?
Total Levy (all taxing districts) 246,769,814$
Total Assessed Values 1,553,615,124$
2018 Equalizer 2.9109
EAV 4,522,418,264$
Tax Rate on All Property 5.46%
Previous Commercial Burden 67,368,159.22$ 27.3%
New Commercial Burden 99,522,265.99$ 40.3%
Estimated Tax Increase 47.7%
Previous Commercial Tax Rate 24.2% 277,925,121$
New Commercial Tax Rate 15.9% 626,513,991$
Previous Residential Tax Rate 24.2% 740,113,000$
New Residential Tax Rate 15.9% 927,101,213$
Estimated Tax Decrease -17.81%
City of Evanston 2019 Property Tax Estimate
The Commercial Increase is Across the Board
How do investors prepare?
What about 2021???
Township Apartments Commercial Industrial
Rogers Park 8.5 - 10.25 9.0 -10.5 9.5 - 10.5
Lake View 8.25 -10.0 8.75 - 10.0 9.50 - 10.0
Hyde Park 8.75 - 10.25 9.50 - 10.75 9.50 - 11.0
Jefferson 8.25 - 10.25 8.50 - 10.25 9.50 - 10.50
Lake View 9.0 - 10.25 9.25 - 10.50 9.50 - 11.50
West 9.25 - 11.00 9.25 -11.75 9.50 - 12.25
North 8.0 -10.0 8.0 -9.75 8.75 - 10.0
South 8 -9.50 8.75 - 11.0 9.0 - 11.0
CBD 7.50 - 8.75 7.50 - 8.75
Cap Rate Ranges Used for 2018 Assessments
0
2
4
6
8
10
12
Rogers
Park
Lake View Hyde Park Jefferson Lake West North South
2018 Reassessment Cap Ranges CoStar Cap Rates
Source: Handwritten Cap Rate List From Berrios’ Office
signed by Tom Jaconetty (Chief Aide)
A Look At Equalized Assessed Values
 $700MM market value for
Willis Tower
 $392MM market value for
Prudential Plaza
But Are Loop Office Buildings Undertaxed?
CBD Class A Office Taxes PSF
% of Gross Rent
Growth of Chicago’s Property Tax Levy
$-
$200,000
$400,000
$600,000
$800,000
$1,000,000
$1,200,000
$1,400,000
$1,600,000
$1,800,000
2008 2011 2012 2013 2014 2017 2020
Note Redemption and Interest Bond Redemption and Interest PABF MEABF FABF LABF
Questions?

2020 Market Outlook Presentation - Brandon Svec

  • 1.
    Chicago Commercial Update ARecap of 2019 and Look at 2020 January 2020 Brandon Svec, Director & Market Economist
  • 2.
    Agenda • Demand Drivers •Recap of 2019 and Looking Forward to 2020 • CRE Taxes and the 2019 Reassessments • Questions
  • 3.
  • 4.
  • 5.
  • 6.
    City of ChicagoPopulation and Household Trends Source: Census Bureau % Change 2010 - 2018 0.56% 2.24% -2.74% 8.65% 5.72% -4.00% -2.00% 0.00% 2.00% 4.00% 6.00% 8.00% 10.00% Population Households Family Households Nonfamily Households Single Households
  • 7.
    City of ChicagoPopulation Age Breakout -80,000 -40,000 0 40,000 80,000 0 200,000 400,000 600,000 800,000 0-19 20-34 35-54 55-64 65+ Total Change since 2010 Total Population Change since 2010 Source: Census Bureau
  • 8.
  • 9.
    S&P/Case-Shiller Price Index– Chicago v National Chicago National
  • 10.
    Recap of 2019and Looking Forward to 2020
  • 11.
  • 12.
  • 13.
    Daily Vacancy AcrossNeighborhood Clusters
  • 14.
  • 15.
    But Heavy ActivityContinues in Certain Areas
  • 16.
    Rents Continued SteadyAscent in 2019
  • 17.
    Daily Asking RentsBy Neighborhood Cluster
  • 18.
    Apartment Values HitRecord High in 2019
  • 19.
    Reading the CrystalBall for 2020 New Deliveries – 4,100 units Net Absorption – 5,400 units Vacancy – 5.9% Rent Growth – 2.3% Sales Volume - $3.2 Billion Cap Rate – 6.2%
  • 20.
    Trends We’re Watchingin 2020 • Chicago’s fiscal situation • Pace of office-using job growth • Spread between value of for rent and for sale housing • Interest rates • Millennial migration trends • Impact of new assessment valuation methodology • Investors risk appetite towards Chicago
  • 21.
  • 22.
    A Case Studyon Evanston • Just recently reassessed in 2019 • Strong apartment market that stands as barometer for Downtown and Northside neighborhoods
  • 23.
    Comparison of 2016vs 2019 125% Increase!!!
  • 24.
    Burden on EvanstonCommercial v. Residential 2016 2019
  • 25.
    What Is theNet Result? Total Levy (all taxing districts) 246,769,814$ Total Assessed Values 1,553,615,124$ 2018 Equalizer 2.9109 EAV 4,522,418,264$ Tax Rate on All Property 5.46% Previous Commercial Burden 67,368,159.22$ 27.3% New Commercial Burden 99,522,265.99$ 40.3% Estimated Tax Increase 47.7% Previous Commercial Tax Rate 24.2% 277,925,121$ New Commercial Tax Rate 15.9% 626,513,991$ Previous Residential Tax Rate 24.2% 740,113,000$ New Residential Tax Rate 15.9% 927,101,213$ Estimated Tax Decrease -17.81% City of Evanston 2019 Property Tax Estimate
  • 26.
    The Commercial Increaseis Across the Board
  • 27.
  • 28.
    What about 2021??? TownshipApartments Commercial Industrial Rogers Park 8.5 - 10.25 9.0 -10.5 9.5 - 10.5 Lake View 8.25 -10.0 8.75 - 10.0 9.50 - 10.0 Hyde Park 8.75 - 10.25 9.50 - 10.75 9.50 - 11.0 Jefferson 8.25 - 10.25 8.50 - 10.25 9.50 - 10.50 Lake View 9.0 - 10.25 9.25 - 10.50 9.50 - 11.50 West 9.25 - 11.00 9.25 -11.75 9.50 - 12.25 North 8.0 -10.0 8.0 -9.75 8.75 - 10.0 South 8 -9.50 8.75 - 11.0 9.0 - 11.0 CBD 7.50 - 8.75 7.50 - 8.75 Cap Rate Ranges Used for 2018 Assessments 0 2 4 6 8 10 12 Rogers Park Lake View Hyde Park Jefferson Lake West North South 2018 Reassessment Cap Ranges CoStar Cap Rates Source: Handwritten Cap Rate List From Berrios’ Office signed by Tom Jaconetty (Chief Aide)
  • 29.
    A Look AtEqualized Assessed Values  $700MM market value for Willis Tower  $392MM market value for Prudential Plaza
  • 30.
    But Are LoopOffice Buildings Undertaxed? CBD Class A Office Taxes PSF % of Gross Rent
  • 31.
    Growth of Chicago’sProperty Tax Levy $- $200,000 $400,000 $600,000 $800,000 $1,000,000 $1,200,000 $1,400,000 $1,600,000 $1,800,000 2008 2011 2012 2013 2014 2017 2020 Note Redemption and Interest Bond Redemption and Interest PABF MEABF FABF LABF
  • 32.

Editor's Notes

  • #29 this particular cap rate list was handwritten and signed by Tom Jaconetty, Berrios' chief aide, and covers the period 2016 to 2018. Office property analysts were given the list and told to pretty much follow it in setting individual assessments, according to the spokesman. Kaegi obtained the list from a staffer who remained with the office after Berrios left last winter.
  • #30 City tax rate is just one of potentially 1400 taxing bodies in Cook county, so not the only driver Equalizer was 2.91 for 2018 tax year (2019 bills) $700 million for willis $392 million for Prudential
  • #32 $1.18 Billion Contribution in 2020